
The trade-off between work and leisure underlying the supply of labor involves the
income effect and the _____ effect.
A) substitution
B) elasticity
C) production
D) wage
Which of the following is NOT a reason that markets usually lead to efficiency?
A) People are naturally efficient.
B) Individuals have incentives to offer what people want.
C) Trade encourages efficiency.
D) Inefficient firms will lose business.
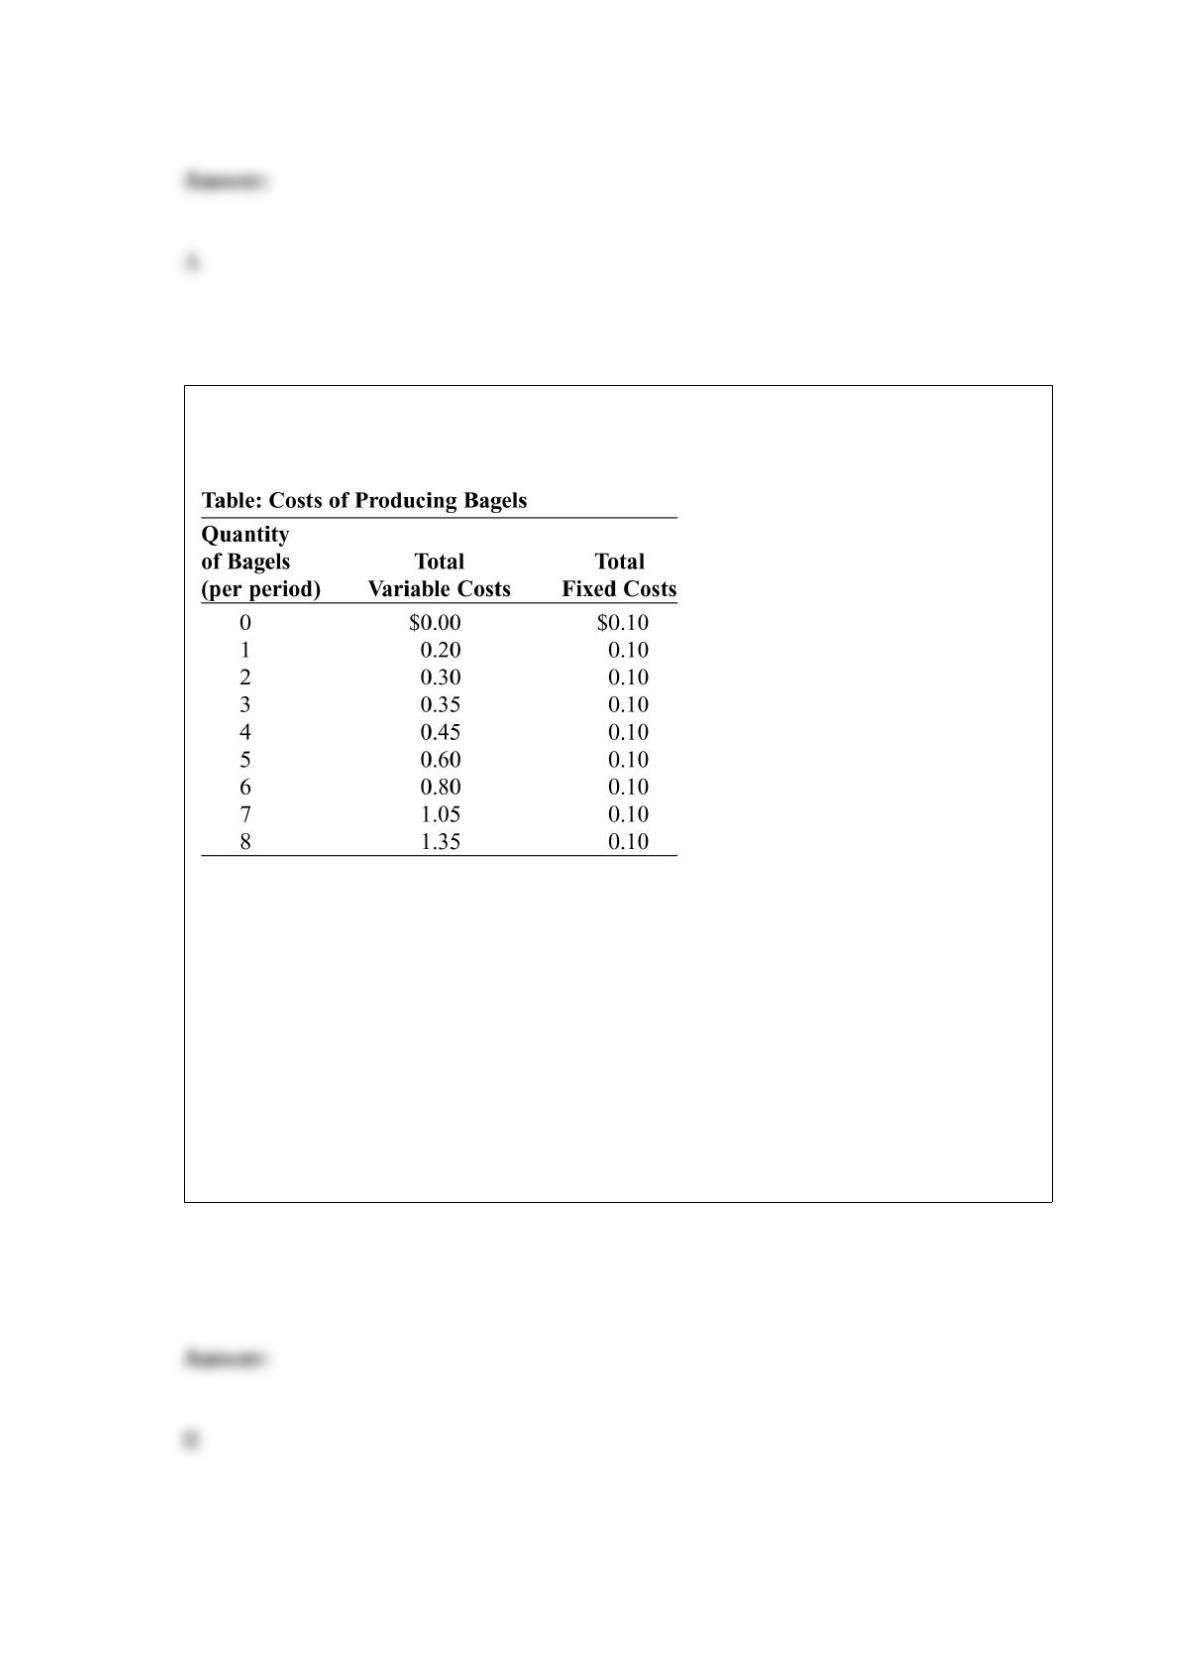
(Table: Costs of Producing Bagels) Look at the table Cost of Producing Bagels. The
average total cost of producing 6 bagels is:
A) $0.10.
B) $0.15.
C) $0.20.
D) $0.80.

(Table: Value of the Marginal Product of Labor and Demand) In the figure Value of the
Marginal Product of Labor and Demand, the total product of labor is shown for the
hourly production of power cords. Assume that the market for power cords is perfectly
competitive. If the price of a power cord is $2, the value of the marginal product for the
third worker is:
A) $2.
B) $10.
C) $60.
D) $80.
If Allison drives to a large city 100 miles from her small community to do her
back-to-school shopping, this will:
A) hurt Allison’s community because Allison’s spending will be income for people in
the large city.
B) hurt the city because Allison will take the goods that she purchases back home to her
small town.
C) help Allison’s community because Allison’s shopping in the big city leaves more
goods for the other small-town residents to buy.
D) help the city because people from small towns usually buy things that people in big
cities don’t want.
Price discrimination leads to a _____ price for consumers with a _____ demand.
A) higher; more elastic
B) higher; perfectly elastic
C) lower; more elastic
D) lower; less elastic
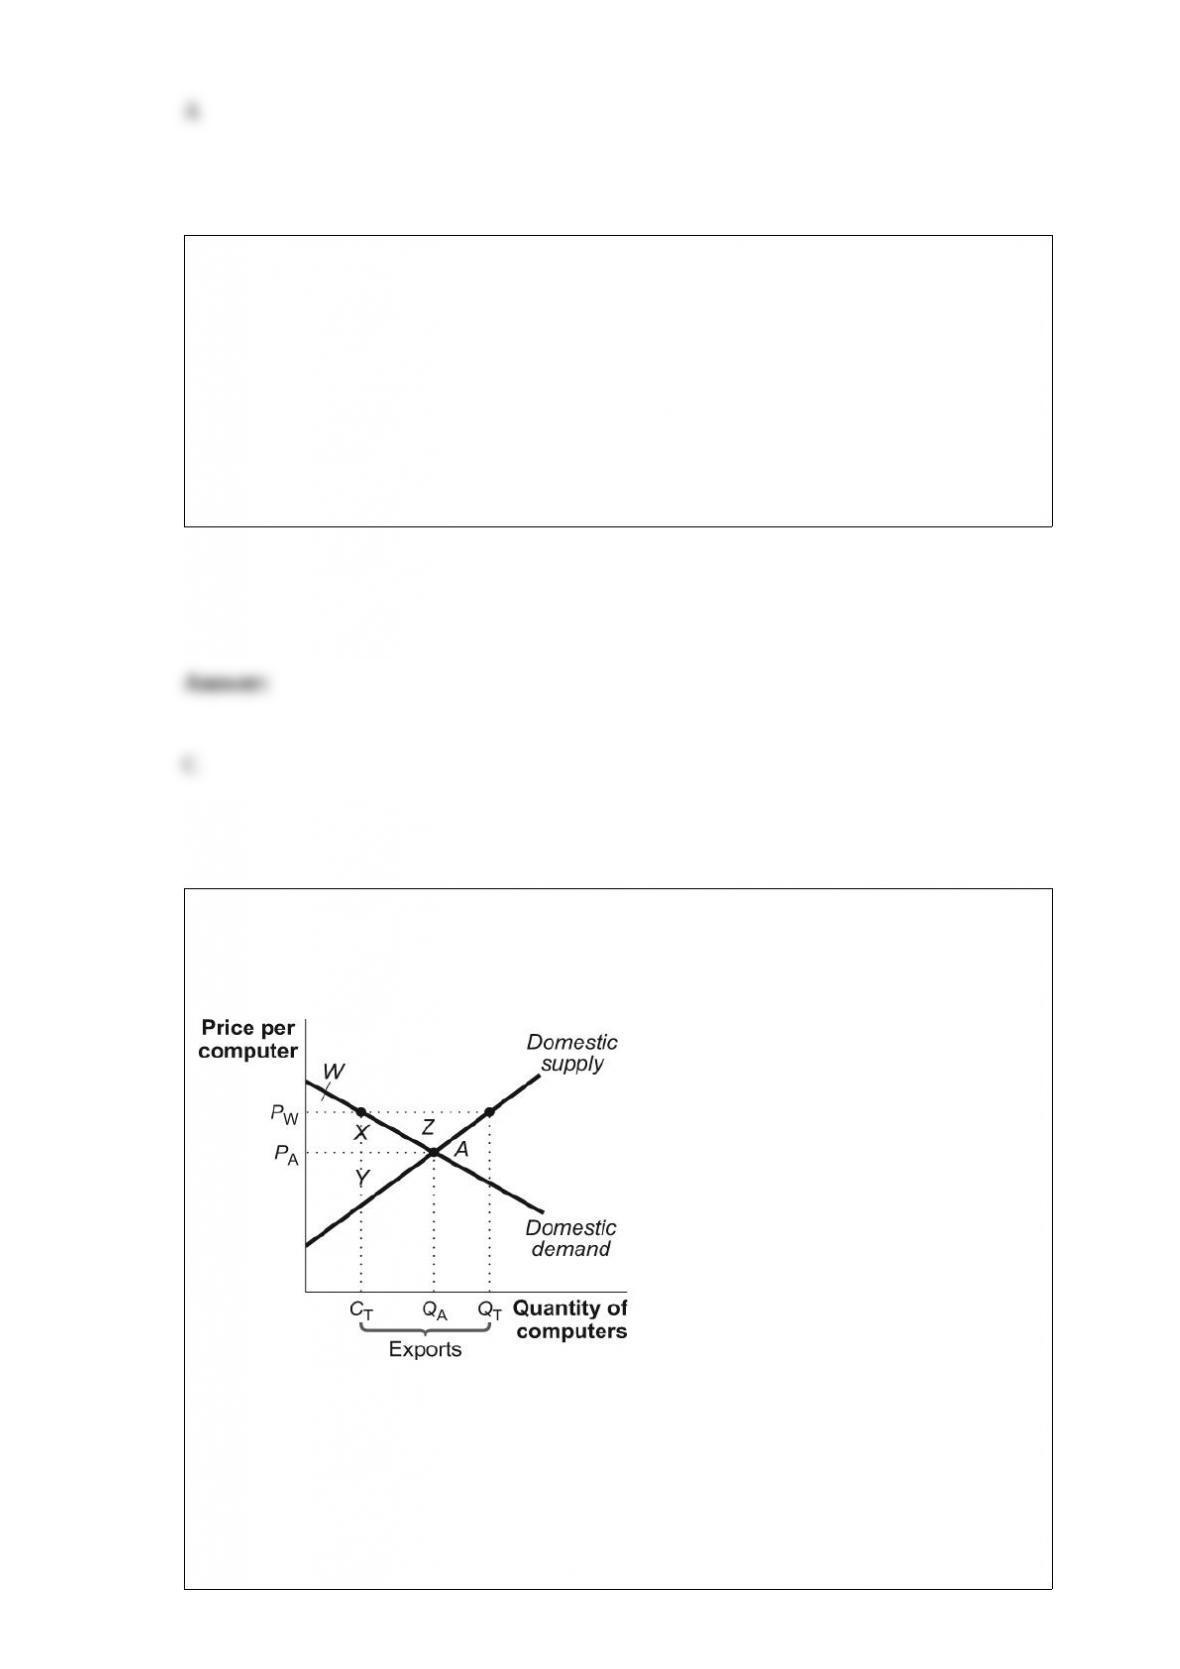
Figure: The Market for Computers
(Figure: The Market for Computers) Look at the figure The Market for Computers.
Assume that PA is the autarky price and PW is the world price. Consumer surplus
without international trade would be area:
A) W + X + Y.

B) W.
C) Y.
D) W + X.
In a time-series graph, large changes can be made to appear trivial by:
A) changing the scale of the axes.
B) labeling more intervals.
C) defining the dependent variable.
D) defining the independent variable.
Oligopoly is a market structure characterized by:
A) independence in decision making.
B) interdependence: each firm’s decision affects the profit of the other firms.
C) substantial diseconomies of scale.
D) a large number of small firms.

Which of the following principles underlies the gains from trade?
A) Resources are scarce.
B) Marginal analysis is used for “how much” decisions.
C) Resources should be used as efficiently as possible to achieve society’s goals.
D) People usually exploit opportunities to make themselves better off.
The market for soft drinks, which is dominated by Coca Cola and Pepsi, is best
considered to be an example of:
A) perfect competition.
B) monopolistic competition.
C) oligopoly.
D) monopoly.

Which of the following oversees international trade agreements?
A) NAFTA
B) the World Trade Organization
C) the European Union
D) the Federal Reserve Bank
Figure: The Monopolist
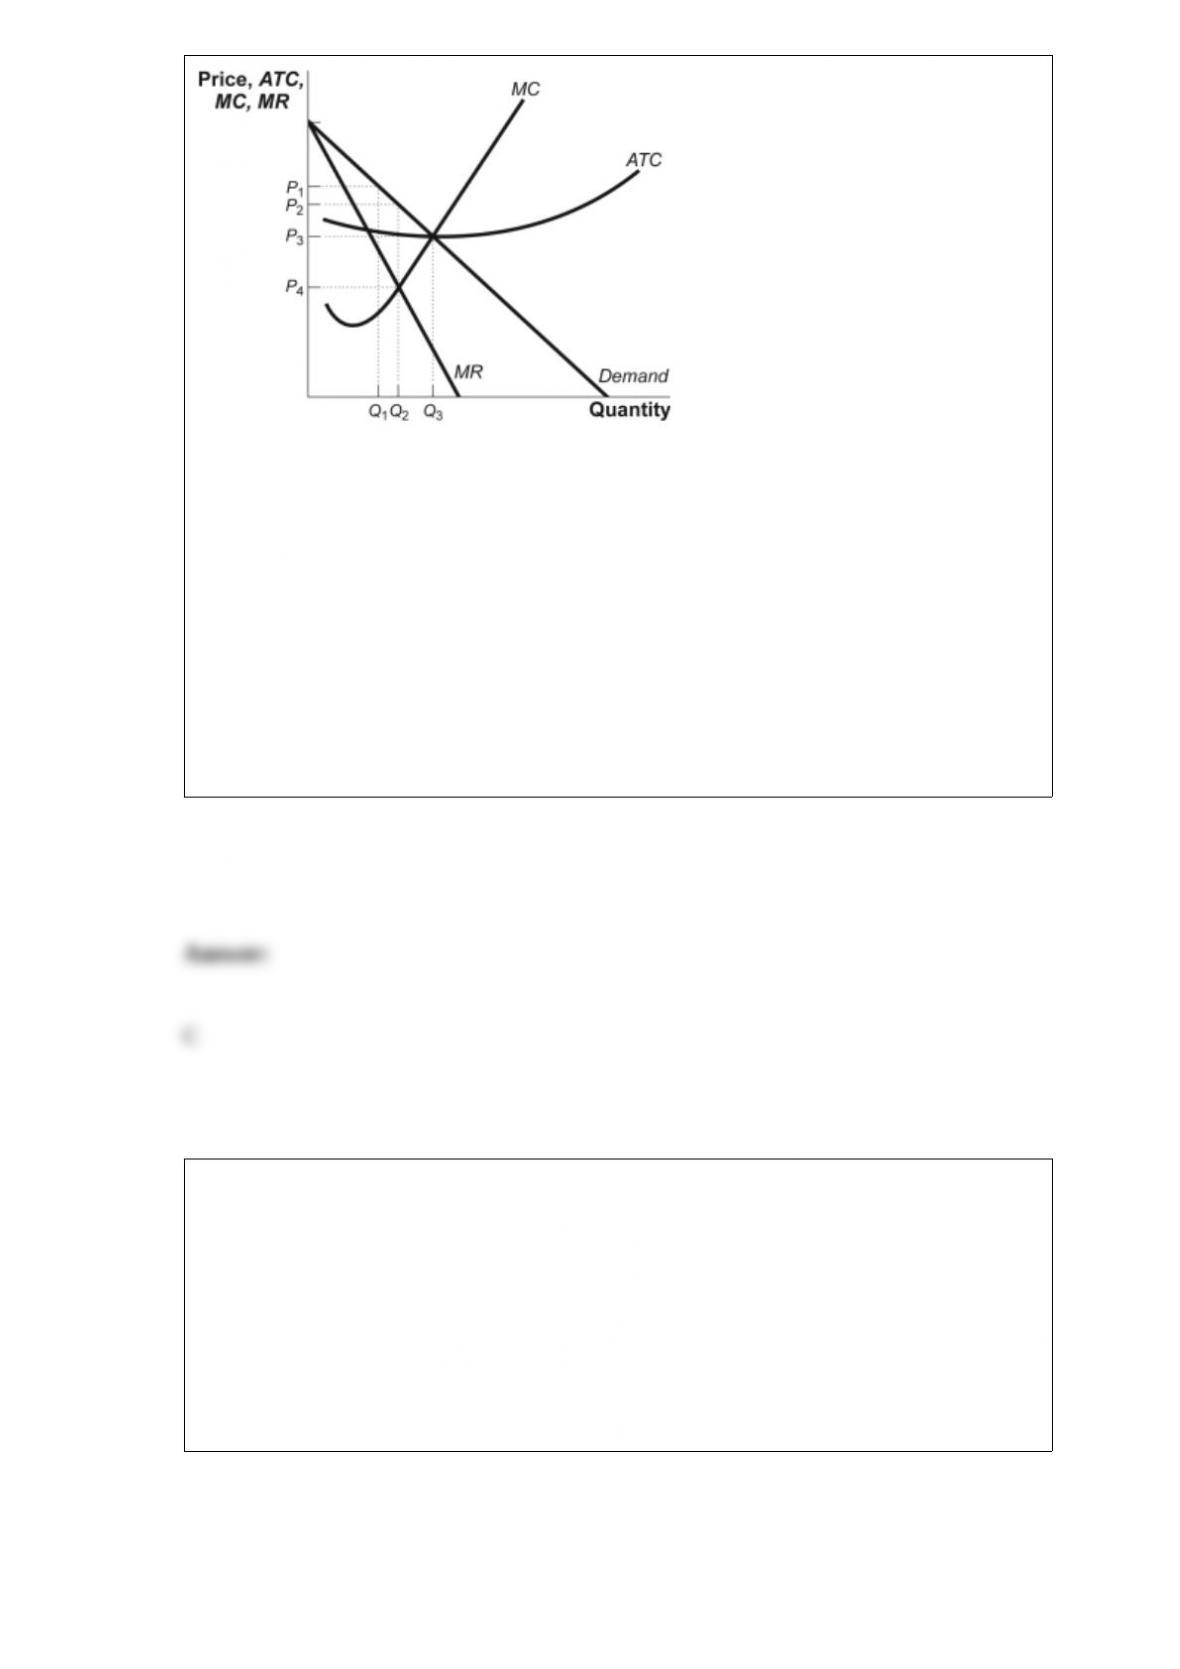
(Figure: The Monopolist) Look at the figure The Monopolist. If this monopolist
attempts to profit-maximize, it will produce _____ units and sell them at _____.
A) Q1; P1
B) Q2; P4
C) Q2; P2
D) Q3; P3
The price elasticity of demand along a demand curve with a constant slope:
A) is equal to the slope.
B) is greater than the slope.
C) is less than the slope.
D) increases in absolute value as the price rises.
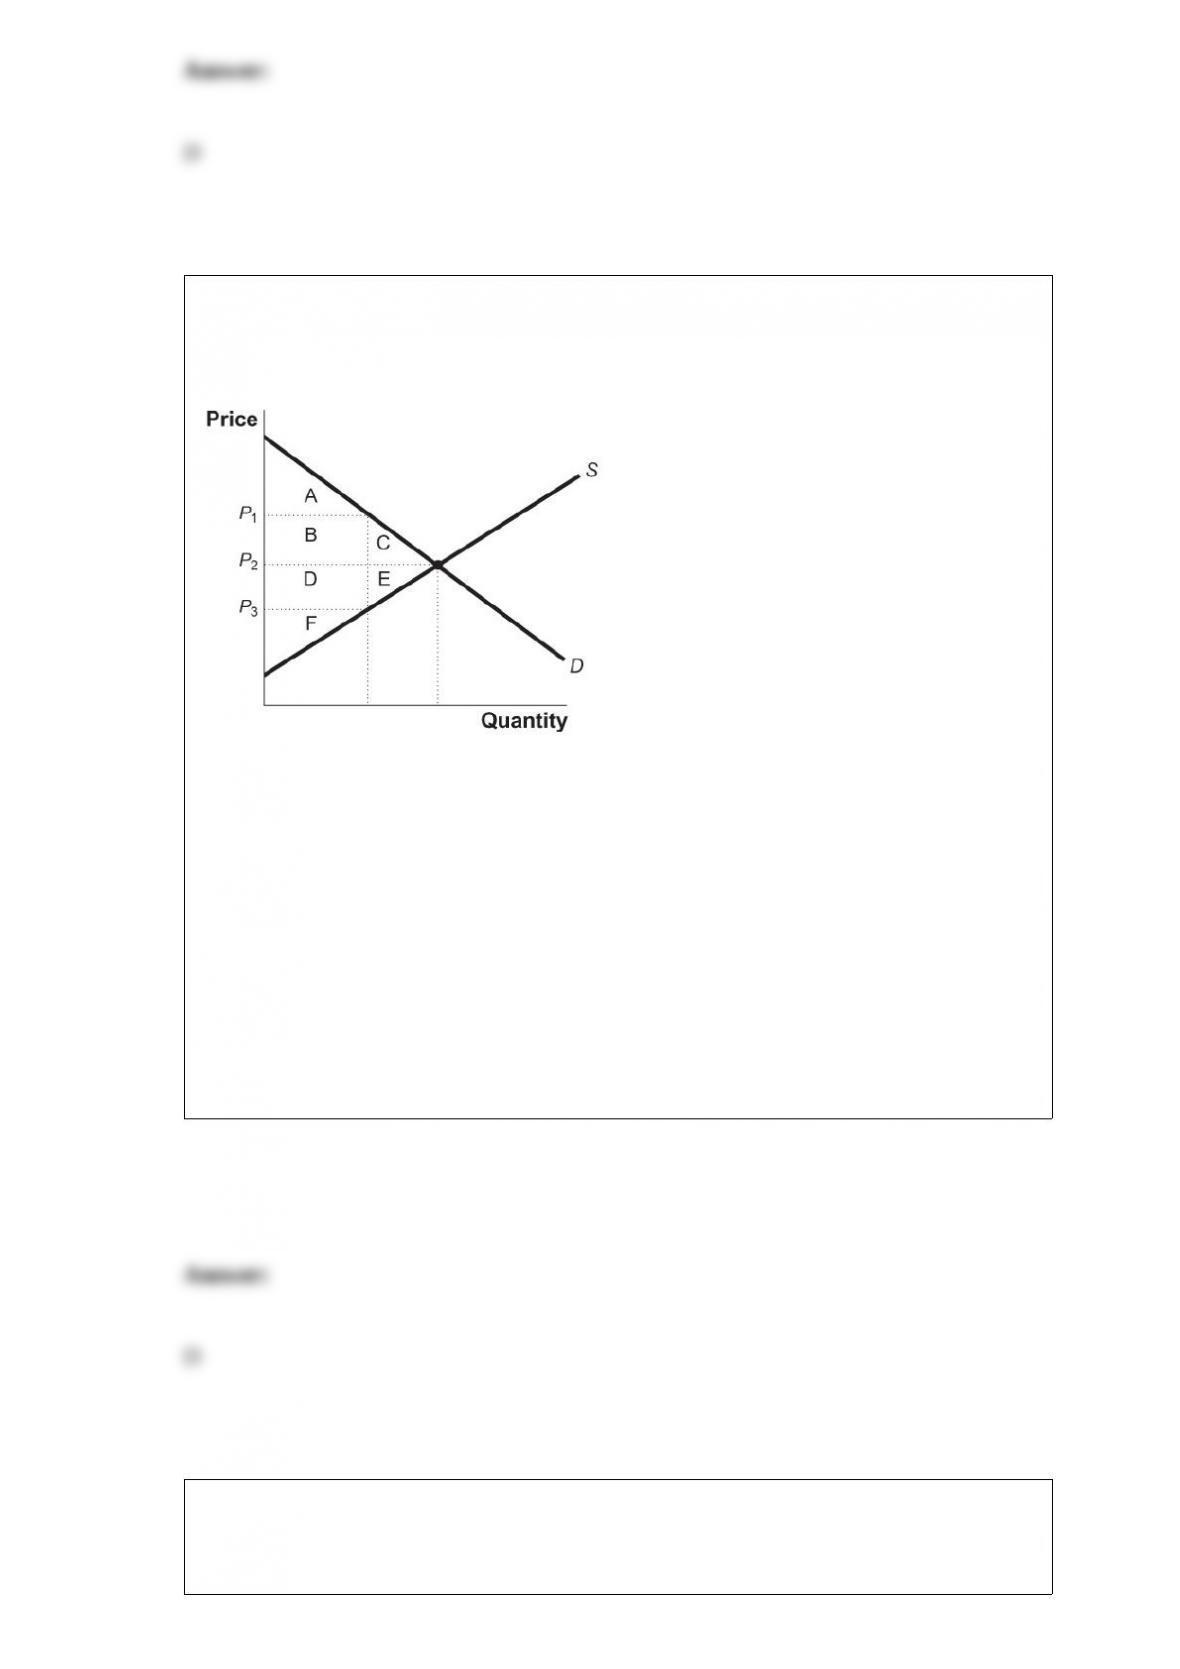
Figure: Change in the Total Surplus
(Figure: Change in Total Surplus) Look at the figure Change in Total Surplus. Which of
the following areas represent the change in total surplus when the price falls from P1 to
P2?
A) A, B, and C
B) B and C
C) B, C, D, and E
D) C and E
The trade-off between equity and efficiency occurs because:
A) the efficient allocation of resources is bad for business and industry.

B) allocating resources fairly may cause inefficiency.
C) everyone must pay more tax to ensure equity.
D) efficiency is politically unpopular.
The time allocation budget line shows an individual’s _____ and the income that allows
consumption of marketed goods.
A) preferences for leisure
B) trade-offs between the consumption of leisure
C) labor supply for the consumption of leisure
D) indifference between the consumption of leisure
Suppose the price of gasoline increases 10% and quantity of gasoline demanded in
Orlando drops 5% per day. Demand for gasoline in Orlando is:
A) price elastic.
B) price inelastic.
C) price unit-elastic.
D) perfectly price inelastic.
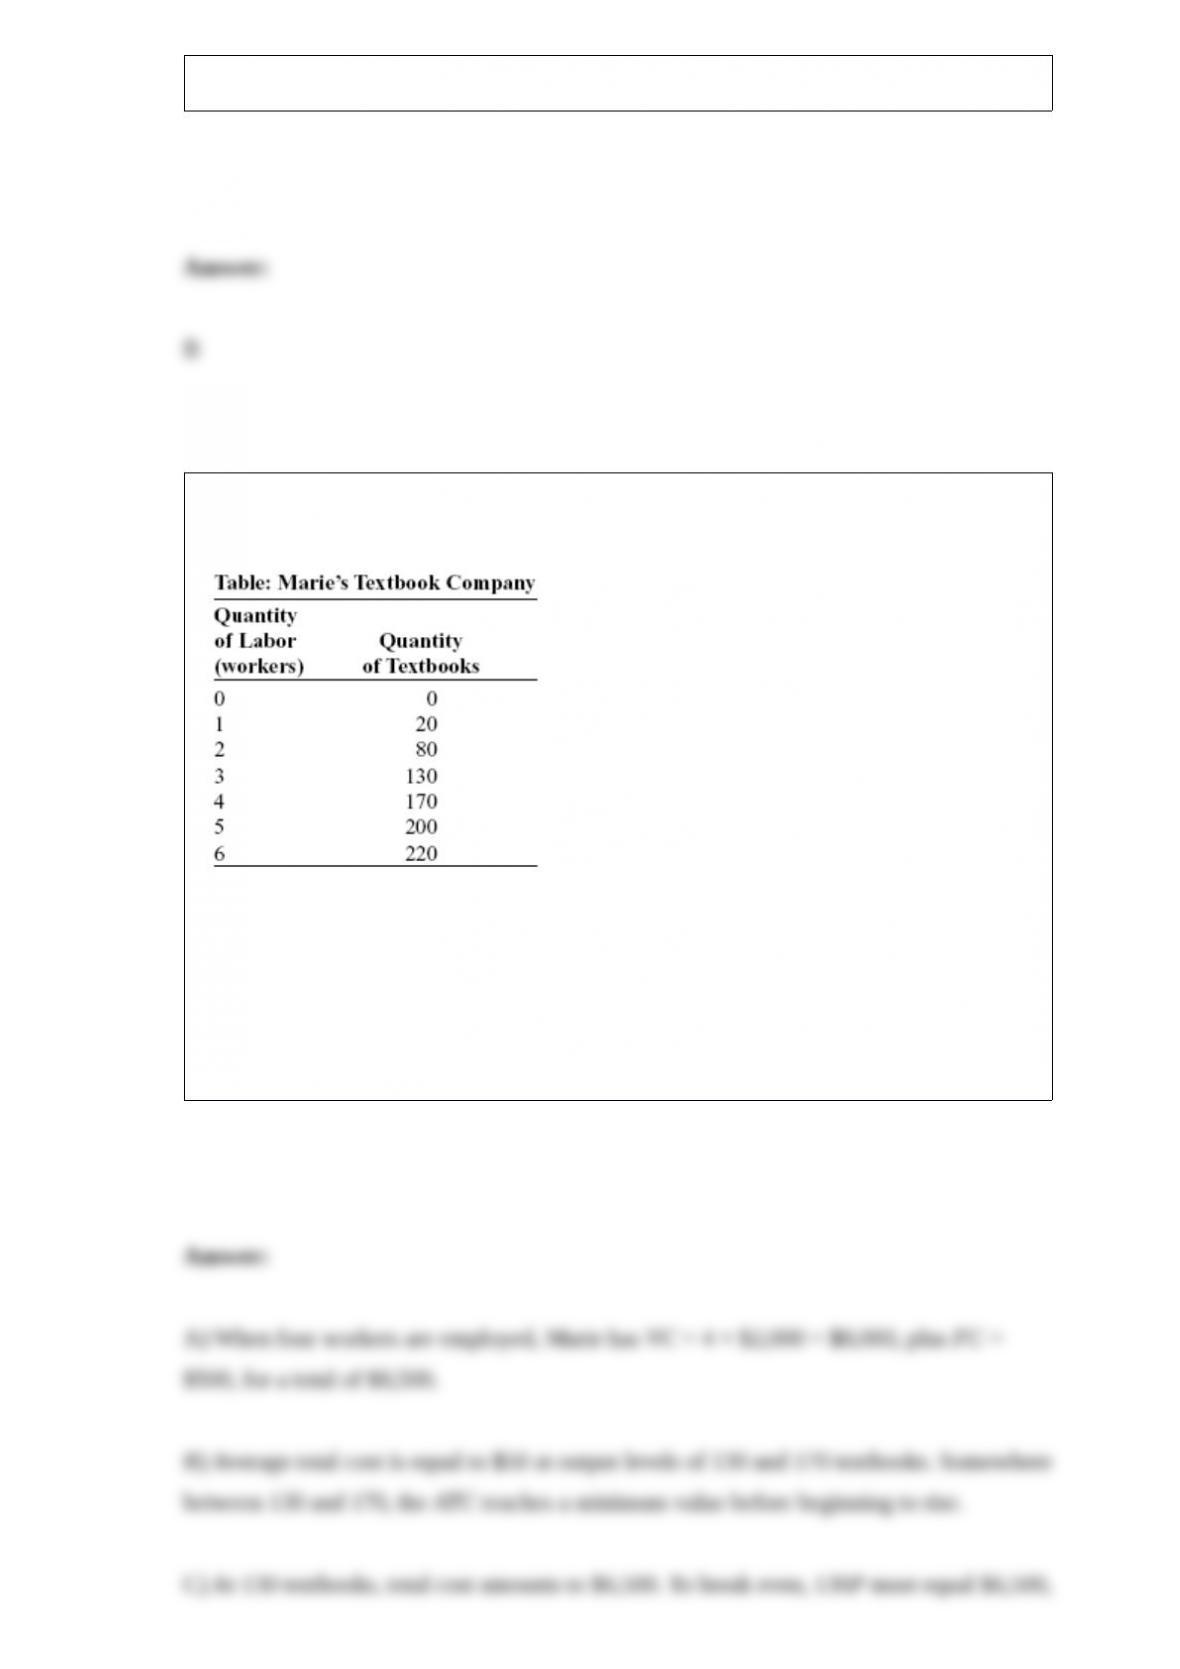
(Table: Marie’s Textbook Company) Look at the table Marie’s Textbook Company.
Marie has fixed costs of $500 per month and hires workers for $2,000 each per month.
With as much precision as possible, calculate the following: A) total cost of production
when four workers are employed B) the output level that produces the lowest average
total cost C) the price that Marie must charge to break even on the production of 130
textbooks
It is cheaper to produce corn in Kansas than in Death Valley, California, because corn
needs a lot of water and moderate temperatures. This statement best represents this
economic concept:
A) Resources are scarce.
B) Markets move toward equilibrium.
C) Resources should be used as efficiently as possible to achieve society’s goals.
D) Markets usually lead to efficiency.
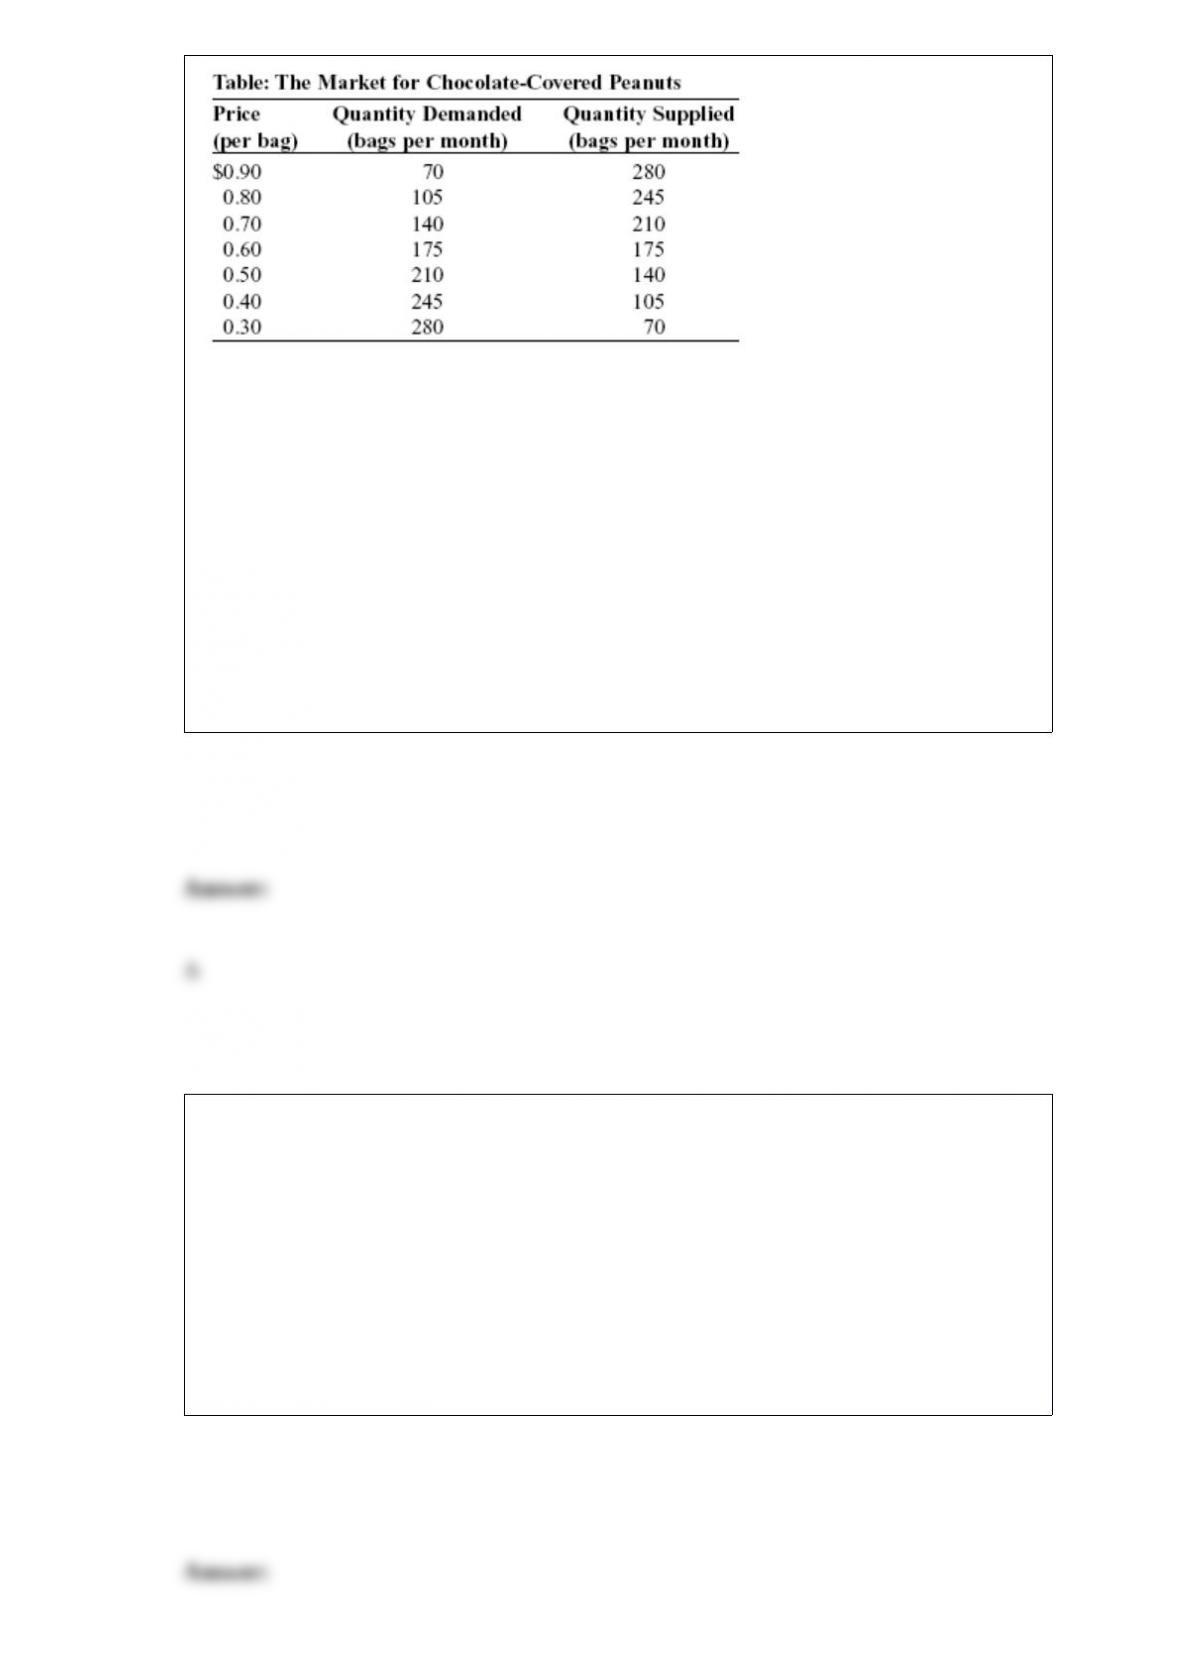
(Table: The Market for Chocolate-Covered Peanuts) Look at the table The Market for
Chocolate-Covered Peanuts. If the price of chocolate-covered peanuts is $0.80, there is
a monthly:
A) surplus of 140 bags.
B) shortage of 140 bags.
C) surplus of 70 bags.
D) shortage of 70 bags.
Suppose the demand curve for good Z is downward-sloping. If the price of good Z
decreases because of a shift in supply, this will cause:
A) an increase in the demand for good Z.
B) a movement along the demand curve of good Z.
C) no effect on the quantity demanded of good Z.
D) fewer people to purchase good Z.

Scenario: Betty’s Cookie Shop
Betty runs a cookie shop where she sells cookies for $1 each. She employs five people,
each of whom worked a total of 500 hours last year; she paid them $10 per hour. Her
costs of equipment and raw materials add up to $75,000. Her business ability is
legendary, and other companies have offered to pay Betty $100,000 to come to work for
them. She also knows she could sell her cookie shop for $150,000. The bank in town
pays an annual interest rate of 3% on all funds deposited with it.
(Scenario: Betty’s Cookie Shop) Betty’s implicit and explicit costs are equal to:
A) $80,000.
B) $184,500.
C) $204,500.
D) $100,000.
Coworkers Yvonne and Rodney are washing dishes and sweeping the floors of the store.
They know that to finish both tasks as quickly as possible, each of them should focus on
just one task, but they don’t know who should do what. Yvonne and Rodney should
determine which one:
A) has the absolute advantage in dishwashing.
B) has the comparative advantage in dishwashing.
C) has the production possibility frontier that is farthest from the origin in dishwashing.
D) can wash the dishes faster.
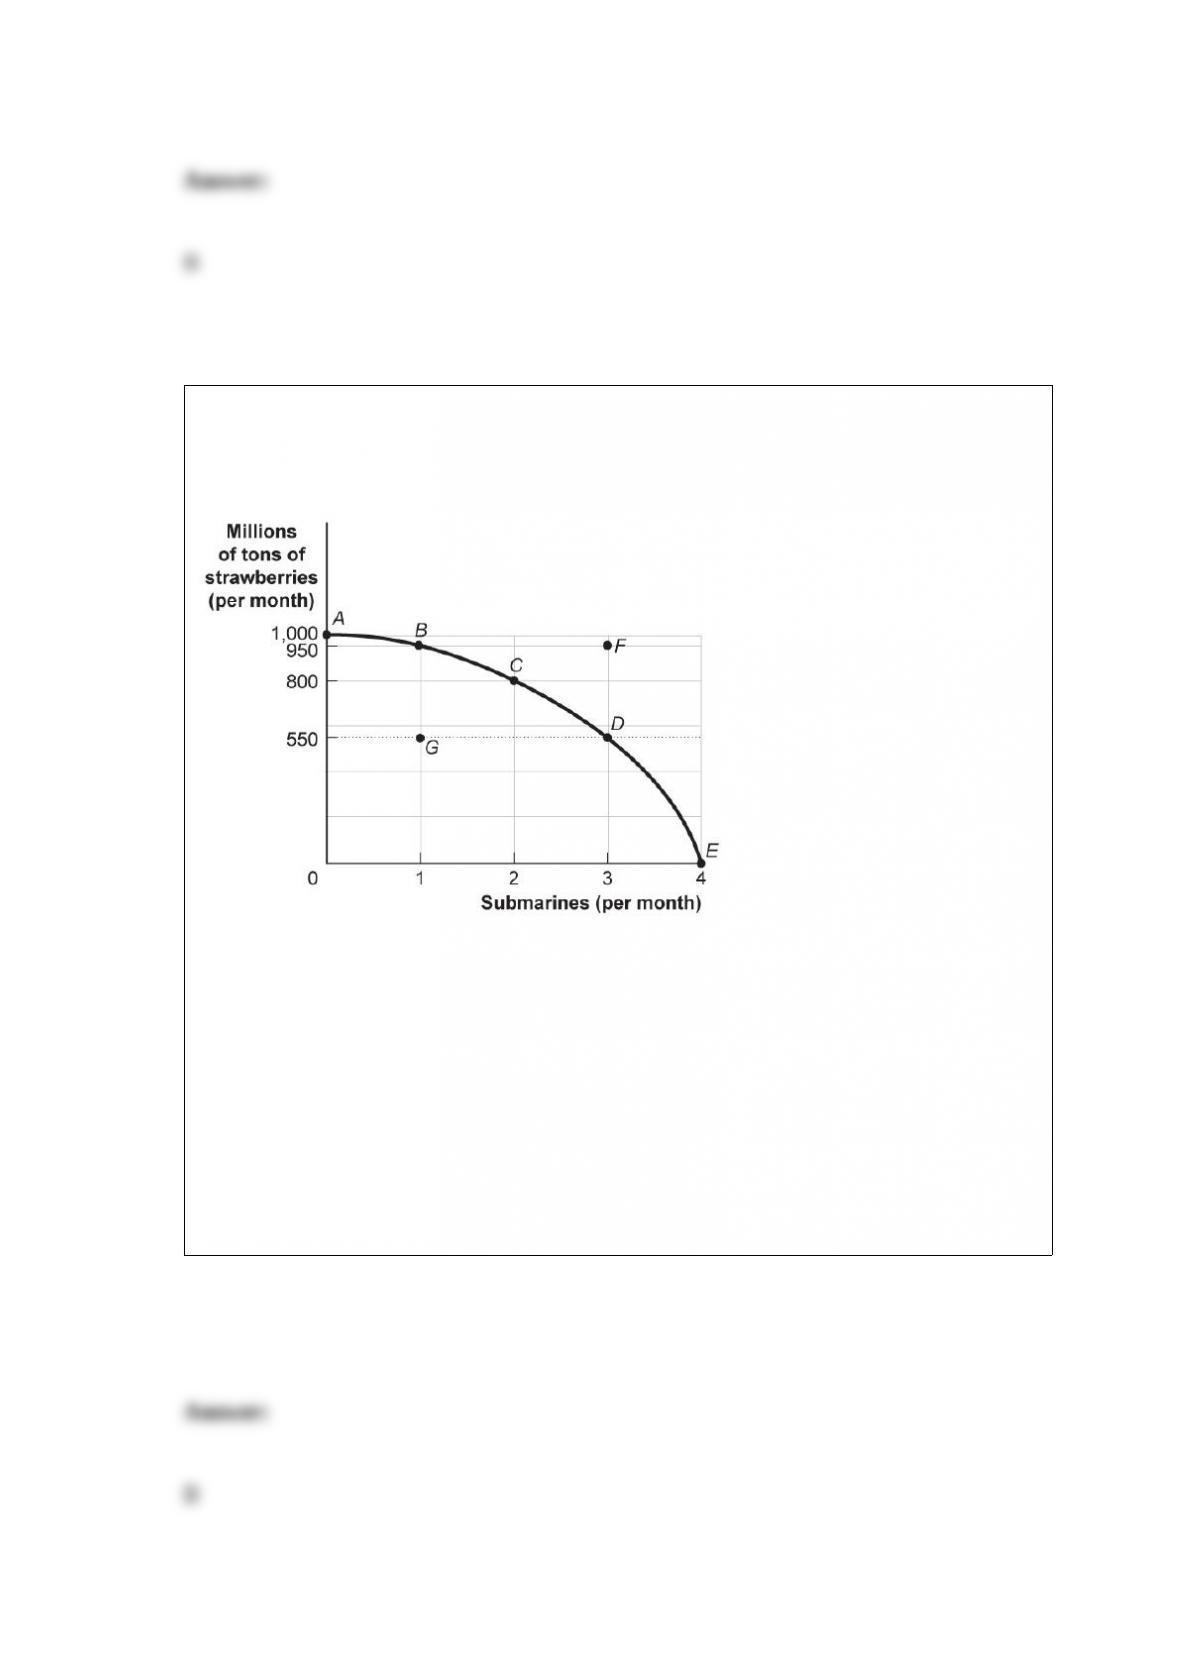
Figure: Strawberries and Submarines
(Figure: Strawberries and Submarines) Look at the figure Strawberries and Submarines.
Suppose the economy is operating at point G. This implies that:
A) the economy can move to a point such as C only if it improves its technology.
B) the economy has unemployment and/or inefficiently allocates resources.
C) the economy lacks the resources to achieve a combination such as C.
D) people in this economy don’t really like strawberries or submarines.
High-fructose corn syrup, which is derived from corn, is an important ingredient in the
production of many soft drinks. If the price of corn increases, one would expect:
A) the supply curve for soft drinks to shift left.
B) the quantity supplied of soft drinks to increase.
C) the demand for soft drinks to increase.
D) the supply curve for soft drinks to shift right.
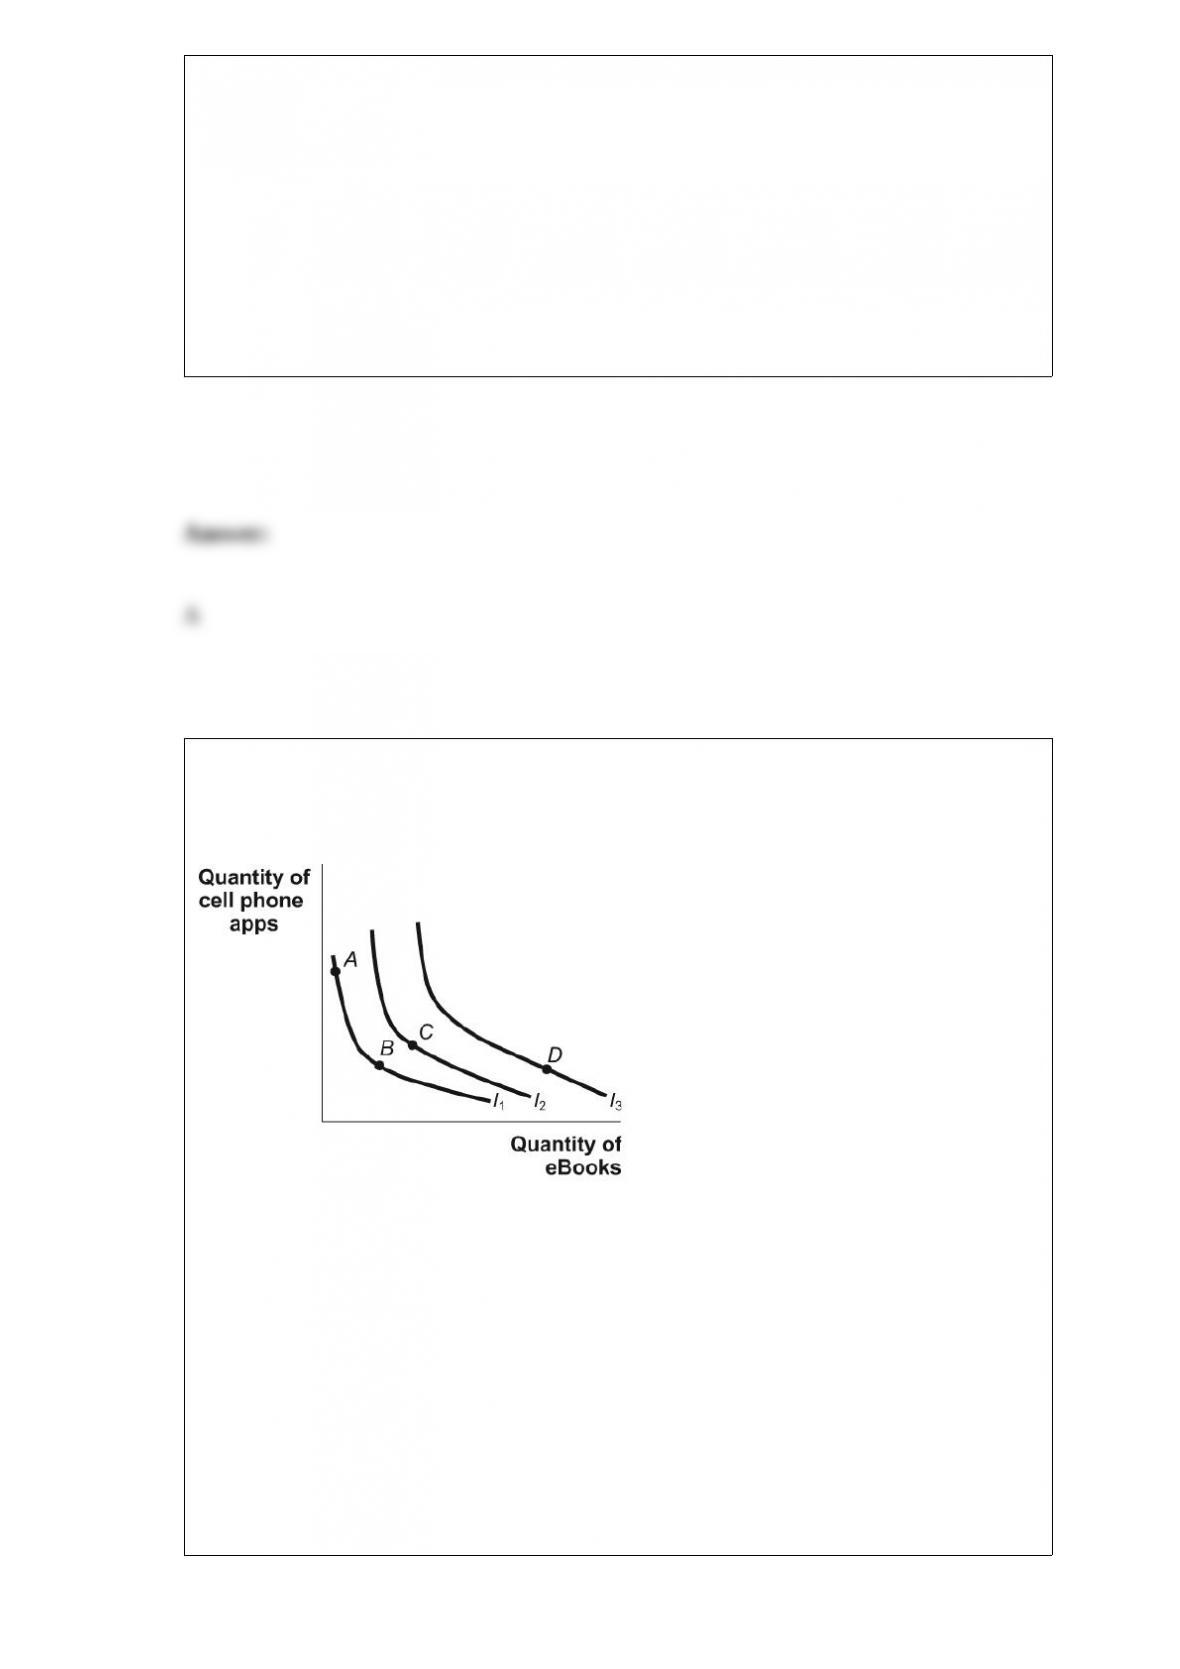
Figure: Indifference Curve Map I
(Figure: Indifference Curve Map I) Look at the figure Indifference Curve Map I. It
shows that:
A) at point A utility is higher than it is at point B.
B) utility is diminishing on I1, constant on I2, and increasing on I3.
C) utility is higher at point D than at point A.
D) the marginal utility of e-books is positive, while the marginal utility of cell phone
apps is negative.
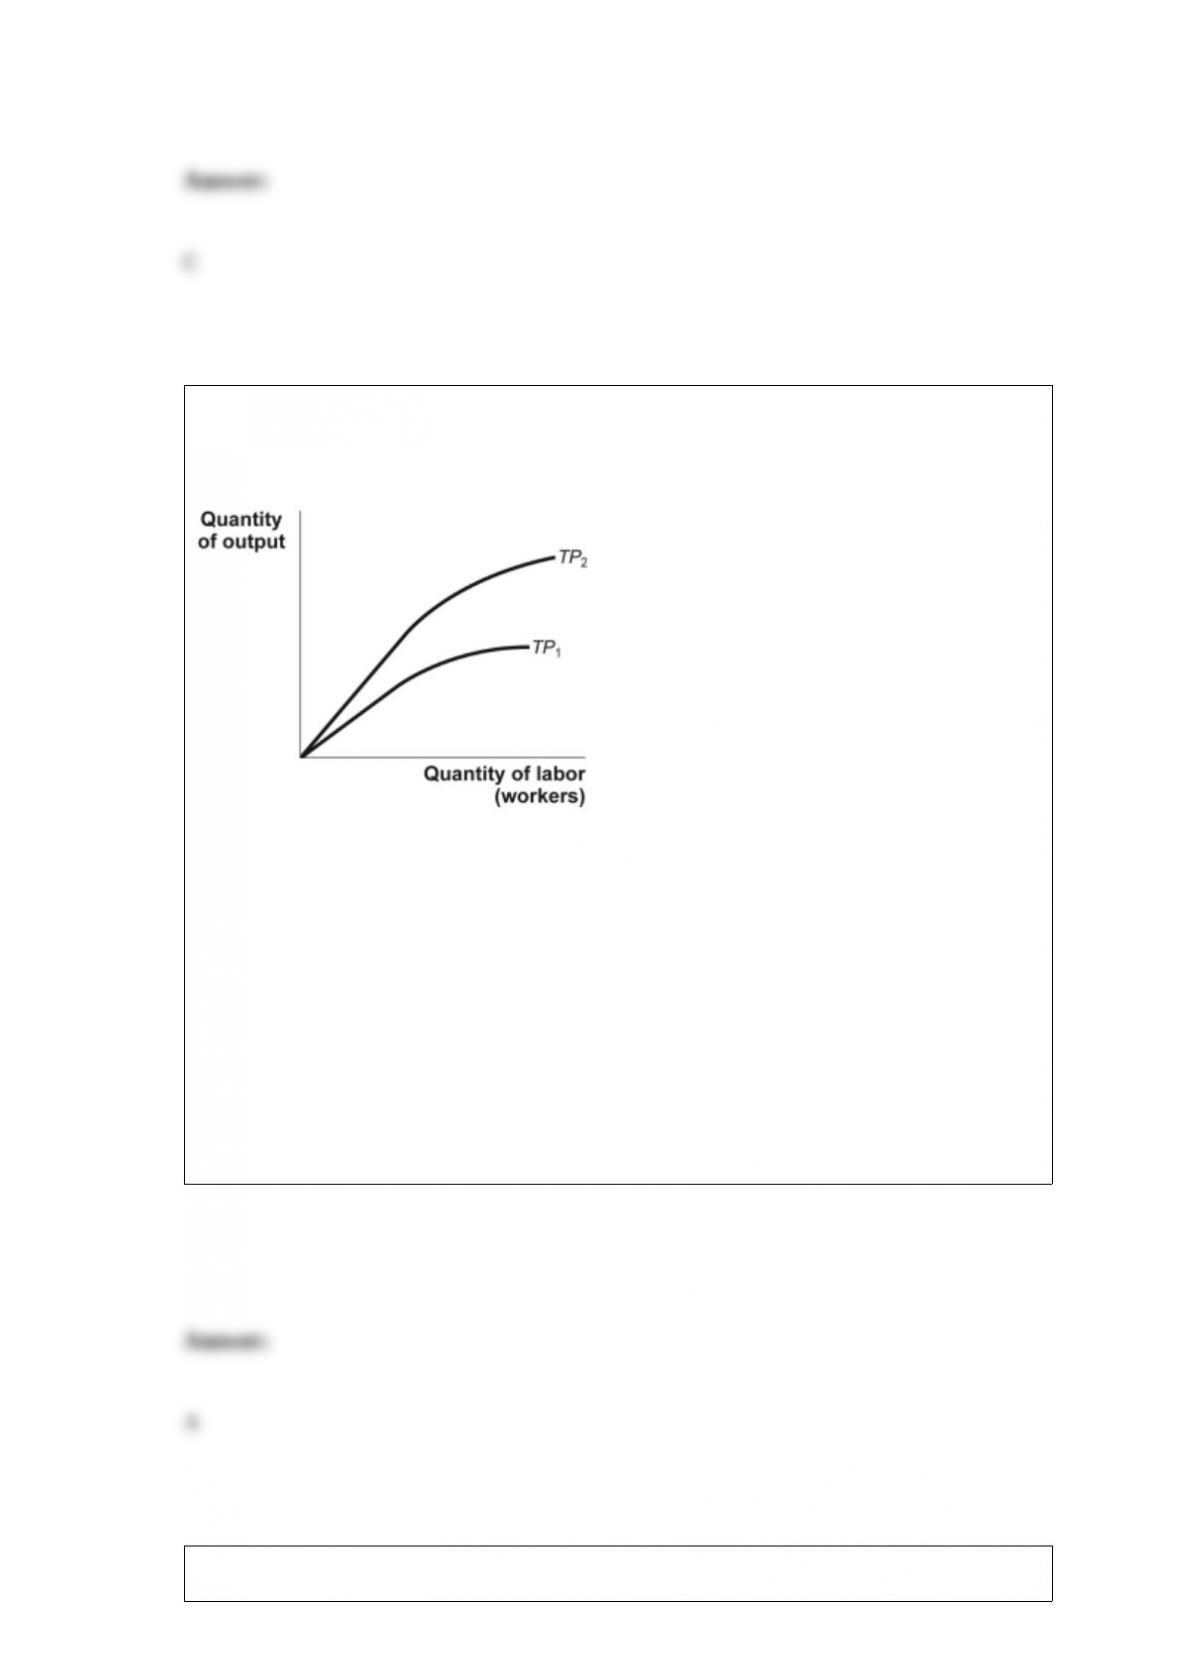
Figure: Change in the Total Product
(Figure: Change in the Total Product) Look at the figure Change in the Total Product.
As indicated by the change in a production function from TP1 to TP2, the marginal
product of labor curve has:
A) shifted upward.
B) shifted downward.
C) not moved.
D) become inverted.
Learning effects often result in _____ marginal costs.

A) decreasing
B) increasing
C) constant
D) random
The activities of consumers and firms:
A) have benefits but not costs.
B) have costs but not benefits.
C) have both costs and benefits.
D) are too complex to be analyzed with economic theory.