
1) Answer the next two questions on the basis of the below diagrams which show
identical marginal utility from income curves from person X and person Y.
(a)If $80,000 in income is distributed such that person X has only $20,000 to spend and
person Y has $60,000 to spend, what will be the effect on marginal utilities?
(b)If the $80,000 in income were redistributed from situation A where person X spends
$20,000 and person Y spends $60,000 to a situation B where they both spend $40,000,
what would the utility gain or loss be for persons X and Y? Answer by specifying the
areas in the graph.
2)
Refer to the above figure. Suppose that the economy is currently operating at the
intersection of AS and AD2, and that the full employment level of output is Y. If the
government wants to move the level of real GDP back to Y and reduce demand-pull
inflation, it should:
A.reduce taxes or increase government spending.
B.enact a contractionary fiscal policy that will shift aggregate demand left to AD1.

C.enact a contractionary fiscal policy that will shift aggregate demand to the left, but
not as far as AD1.
D.enact a contractionary fiscal policy that will shift aggregate demand to the left,
farther left than AD1.
3) The following consolidated balance sheet of the commercial banking system.
Assume that the reserve requirement is 20 percent. All figures are in billions and each
question should be answered independently of changes specified in all preceding ones.
Refer to the above data. If the Fed increased the reserve requirement from 20 percent to
25 percent, a deficiency of reserves in the commercial banking system of _____ would
occur and the monetary multiplier would fall to ____.
A.$50 billion; 5
B.$10 billion; 4
C.$50 billion; 4
D.$10 billion; 8
4) In economics, the expression “You can lead a horse to water, but you cannot make it
drink” illustrates the:
A.crowding-out effect.
B.cyclical asymmetry of monetary policy.
C.administrative lag that occurs in formulating monetary and fiscal policies.
D.operational lag in monetary policy.
5) the following marginal utility data for products x and y. assume that the prices of x
and y are $4 and $2 respectively and that the consumer’s income is $18.

refer to the above data. if the price of x decreases to $2, then the utility-maximizing
combination of the two products is:
a.2 of x and 5 of y
b.4 of x and 6 of y
c.6 of x and 3 of y
d.4 of x and 5 of y
6) the optimal allocation of resources is found:
a.where mb = mc.
b.at every point along a production possibilities curve.
c.where the marginal benefit is at its greatest.
d.where the marginal cost is at its lowest.
7) purely competitive firms and pure monopolists are similar in that:
a.the demand curves of both are perfectly elastic.
b.significant entry barriers are common to both.
c.both are price makers.
d.both maximize profit where mr = mc.
8) Assume a single firm in a purely competitive industry has variable costs as indicated
in the following table in column 2. Complete the table and answer the questions.
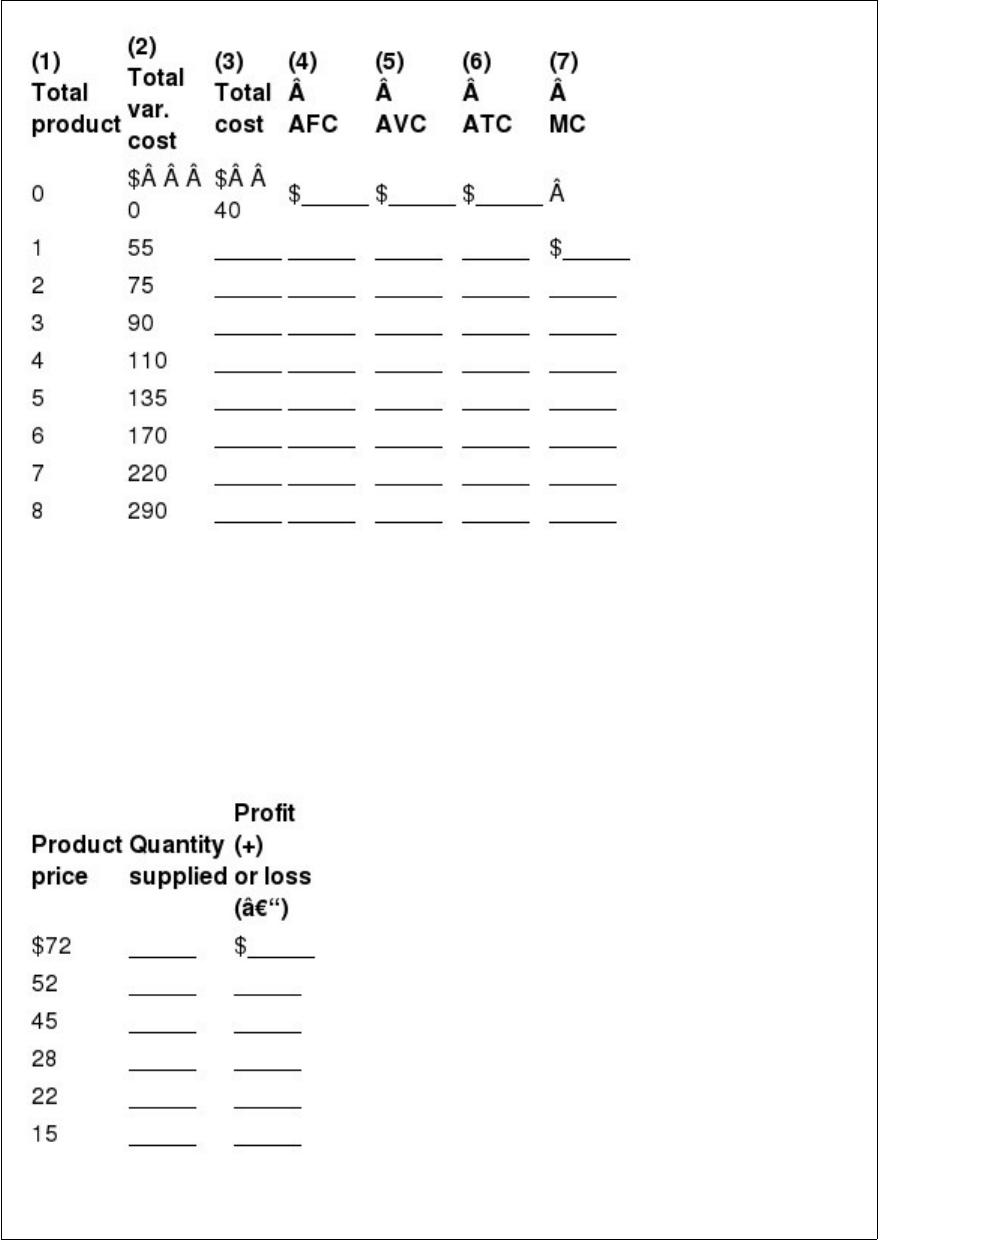
(a)At a product price of $52, will this firm produce in the short run? Explain. What will
its profit or loss be?
(b)At a product price of $28, will this firm produce in the short run? Explain. What will
its profit or loss be?
(c)At a product price of $22, will this firm produce in the short run? Explain. What will
its profit or loss be?
(d)Complete the following short-run supply schedule for this firm.
Assume there are 500 identical firms in this industry, that they have identical cost data
as the firm above, and that the industry demand schedule is as follows:
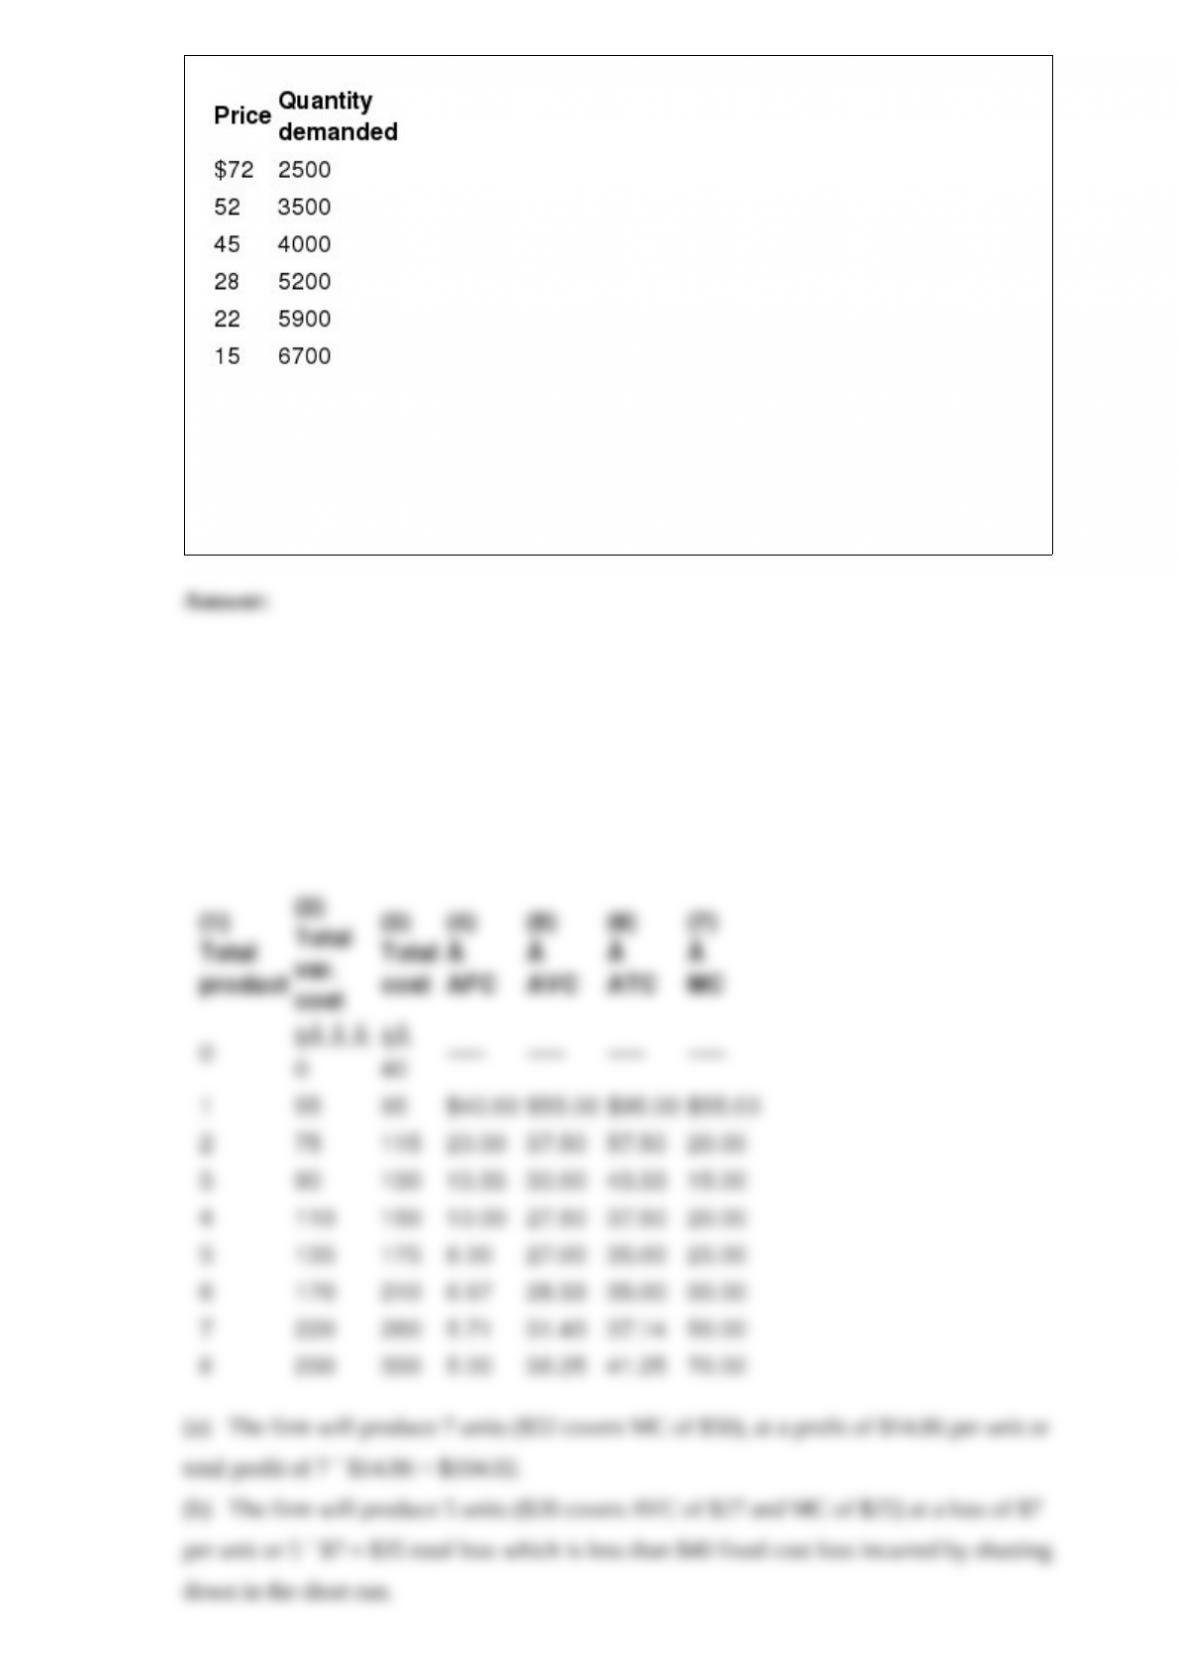
(e) What will the equilibrium price be?
(f) What will the equilibrium output for each firm be?
(g) What will profit or loss be per unit?
(h) What will profit or loss be per firm?
9) an indifference curve shows all:
a.possible equilibrium positions on an indifference map.
b.equilibrium combinations of two products that are obtainable with a given money
income.
c.combinations of two products yielding the same total utility to a consumer.
d.possible combinations of two products that a consumer can purchase, given her
income and the prices of the products.
10) These five schedules represent income tax schedules for an economy. All figures are
in billions of dollars.
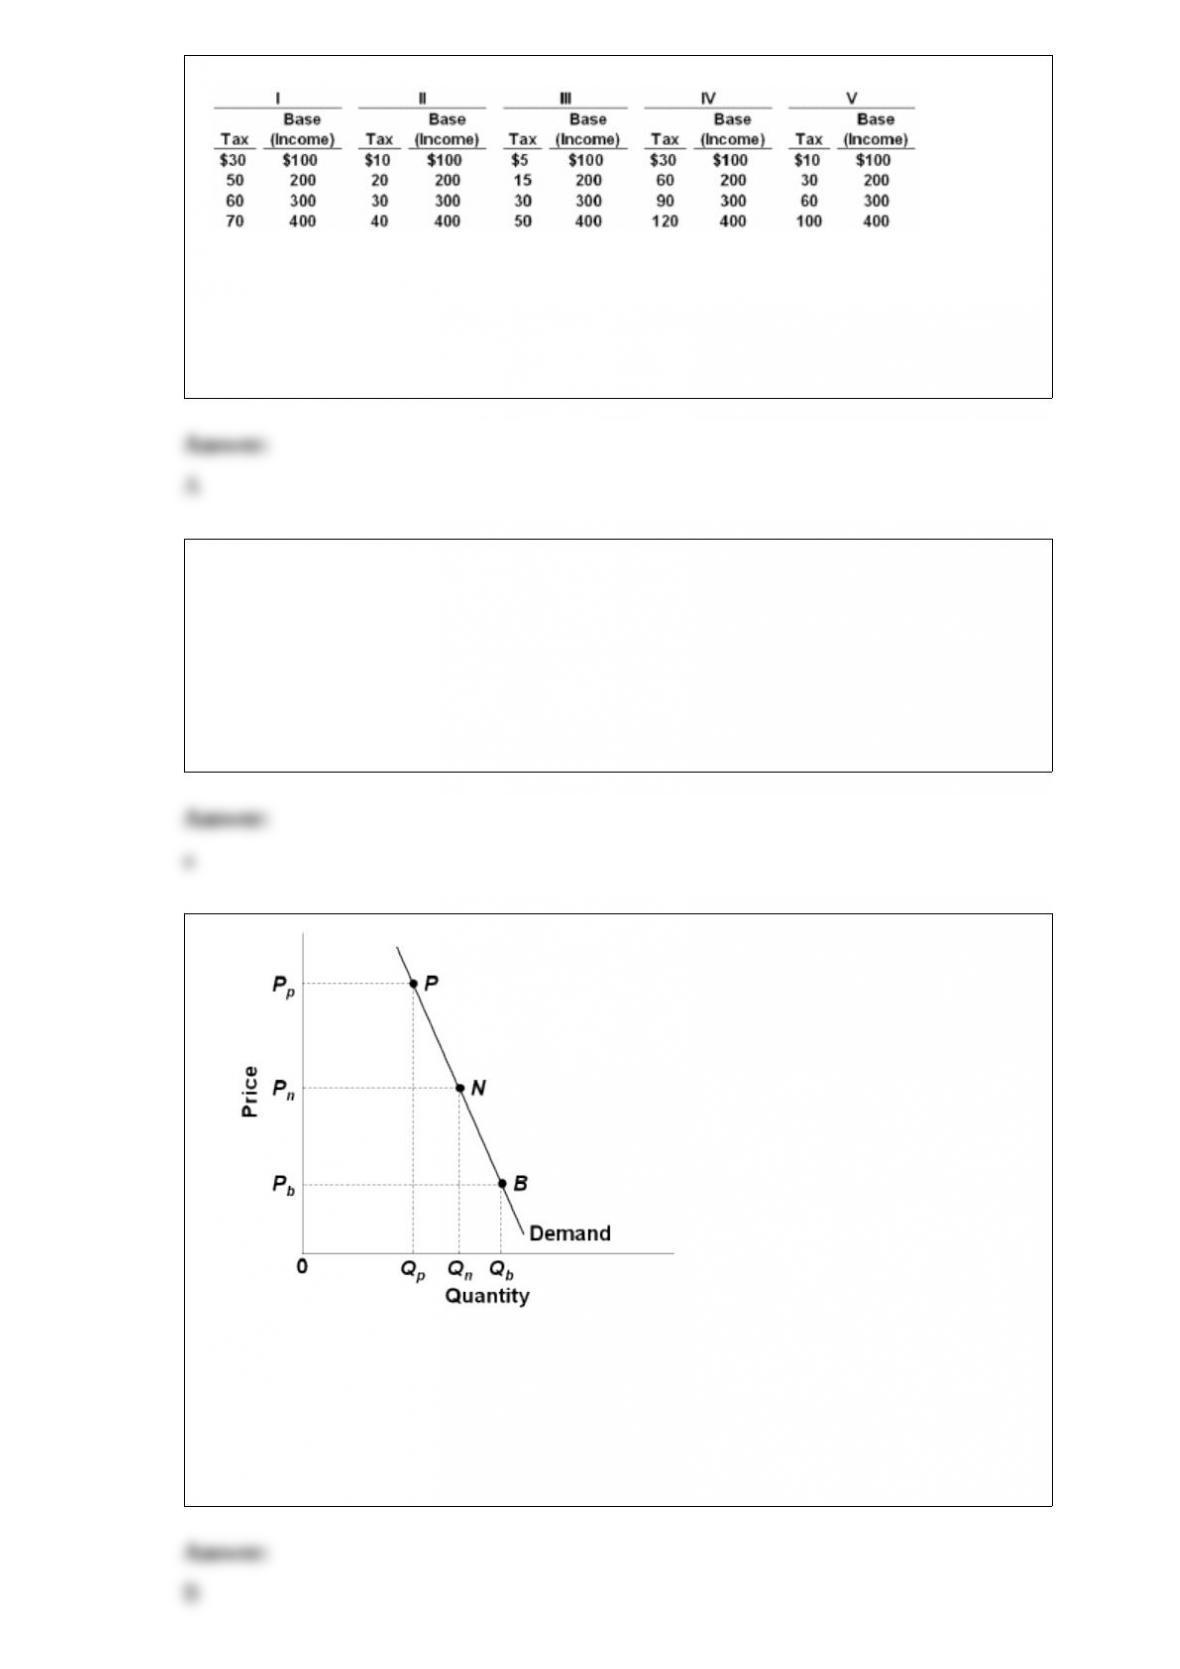
Which of the above schedules represent(s) a proportional tax?
A.II and IV
B.III and V
C.IV only
D.I only
11) suppose you have a limited money income and you are purchasing products a and b
whose prices happen to be the same. to maximize your utility you should purchase a
and b in such amounts that:
a.their marginal utilities are the same.
b.their total utilities are the same.
c.their marginal and total utilities are proportionate.
d.the income and substitution effects associated with each are equal.
12)
Refer to the above diagram. If farmers produce a normal crop of Qn, their gross
income:
A.will be 0PpPNQn.
B.will be 0PnNQn.
C.will be Pp Qn.
D.cannot be determined.

13) by summing the values added at each stage in the production of some good we
obtain:
a.the price of that good.
b.the total income generated by that good’s production.
c.the total cost (including profits) of that product.
d.all of these.