Full-employment output is:
A) the level of output that is produced when the labor market is in equilibrium.
B) the level of output that is produced when the unemployment rate is zero.
C) the level of output that is produced when there is no voluntary unemployment.
D) the level of output that is produced when there is no idle capital stock.
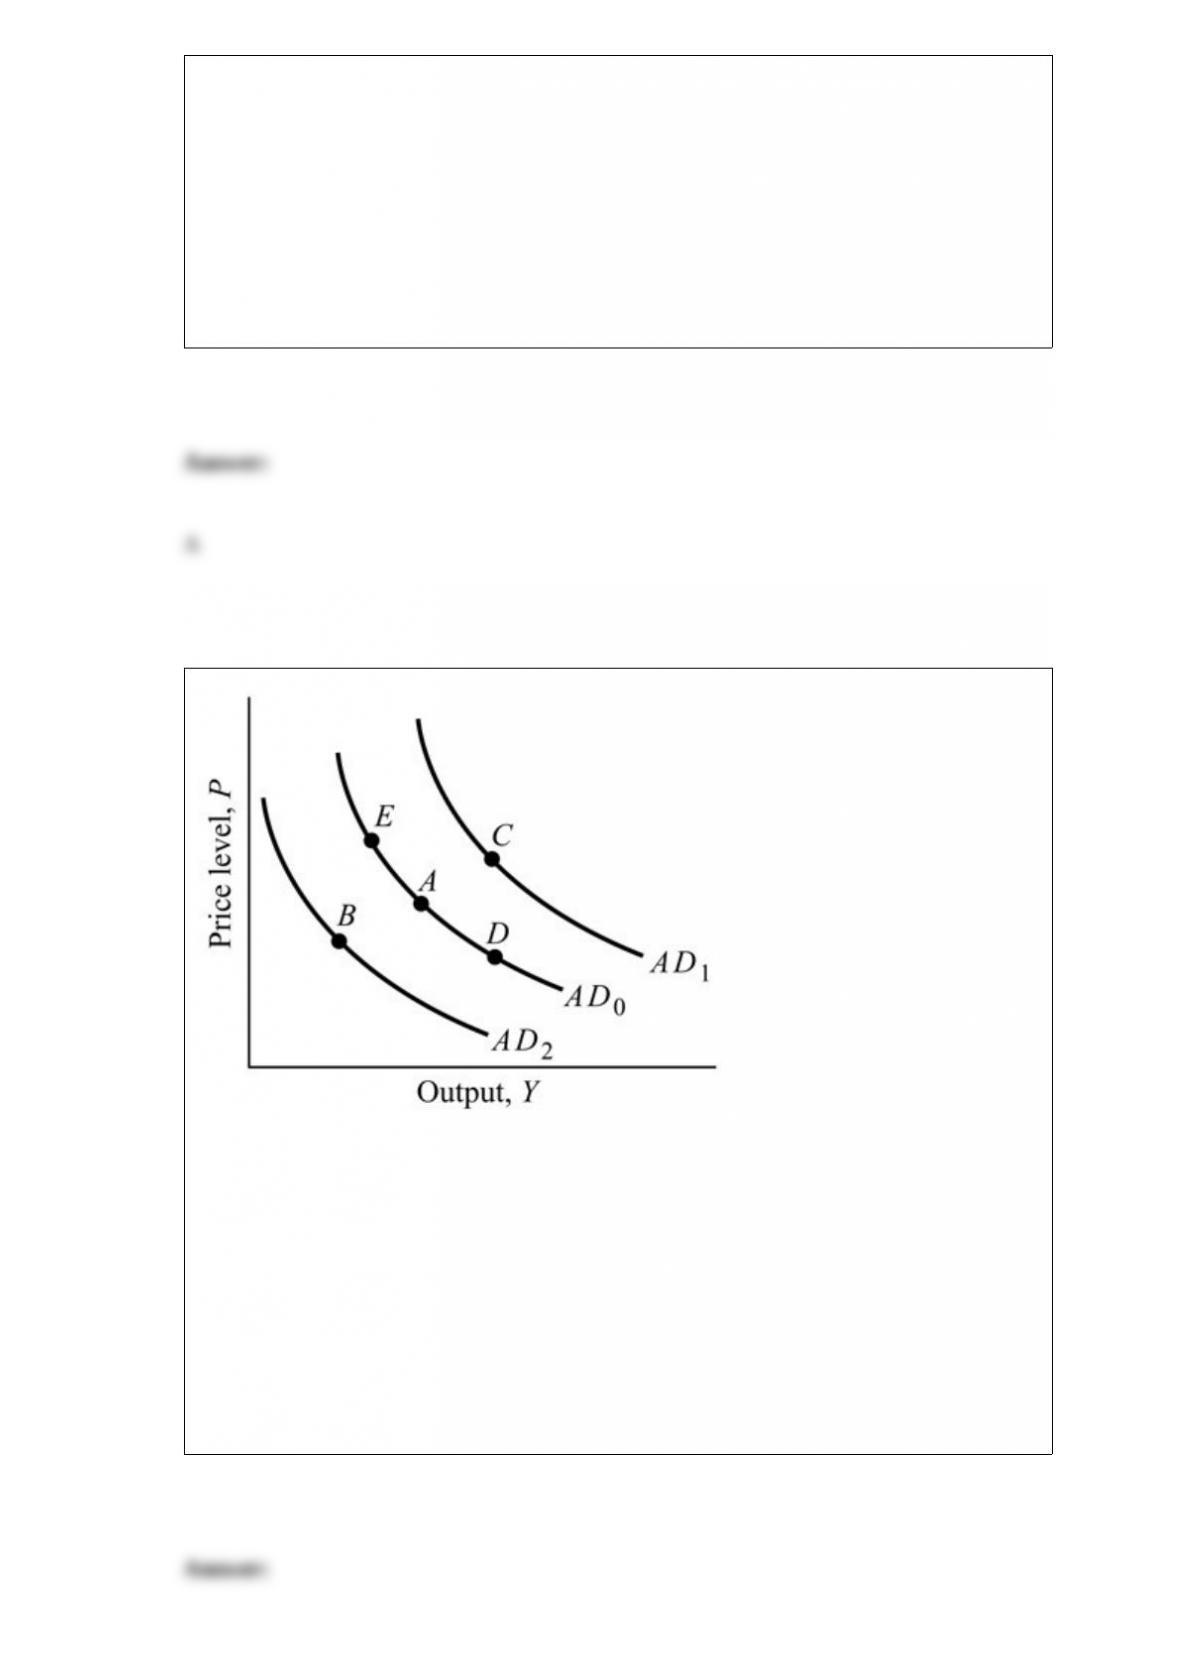
Figure 10.1 Refer to Figure 10.1 to answer this question. Suppose that the economy
were at point A, and the government increases government spending. In the short run,
the economy will move to point:
A) B.
B) C.
C) D.
D) E.

The production possibilities curve shows the combinations of goods that can be:
A) consumed by a nation before trade begins.
B) produced by a nation before trading begins.
C) produced by a nation after trade begins.
D) all of the above
When the Federal Reserve increases interest rates, investment spending ________ and
GDP ________.
A) increases; decreases
B) increases; increases
C) decreases; decreases
D) decreases; increases

Table 5.3
Refer to Table 5.3. Suppose this economy produces only the two goods X and Y. If year
2 is the base year, Real GDP in year 3 is:
A) $290.
B) $390.
C) $404.
D) $490.
An implication of the long-run aggregate supply curve is that continuous increases in
the money supply will result in continuous
A) increases in price level.
B) decreases in output and price level.
C) decreases in output.
D) increases in output and price level.
Federal discretionary spending:
A) requires the approval of Congress.

B) requires approval by the Federal Reserve.
C) requires approval by the U.S. treasury.
D) requires approval by the U.S. Treasury and the president.
If the economy is in equilibrium at full employment, an increase in aggregate demand
will:
A) decrease the price level and leave the level of output unchanged in the short run.
B) increase the price level and leave the level of output unchanged in the short run.
C) increase both the price level and the level of output in the short run.
D) decrease both the price level and the level of output in the short run.
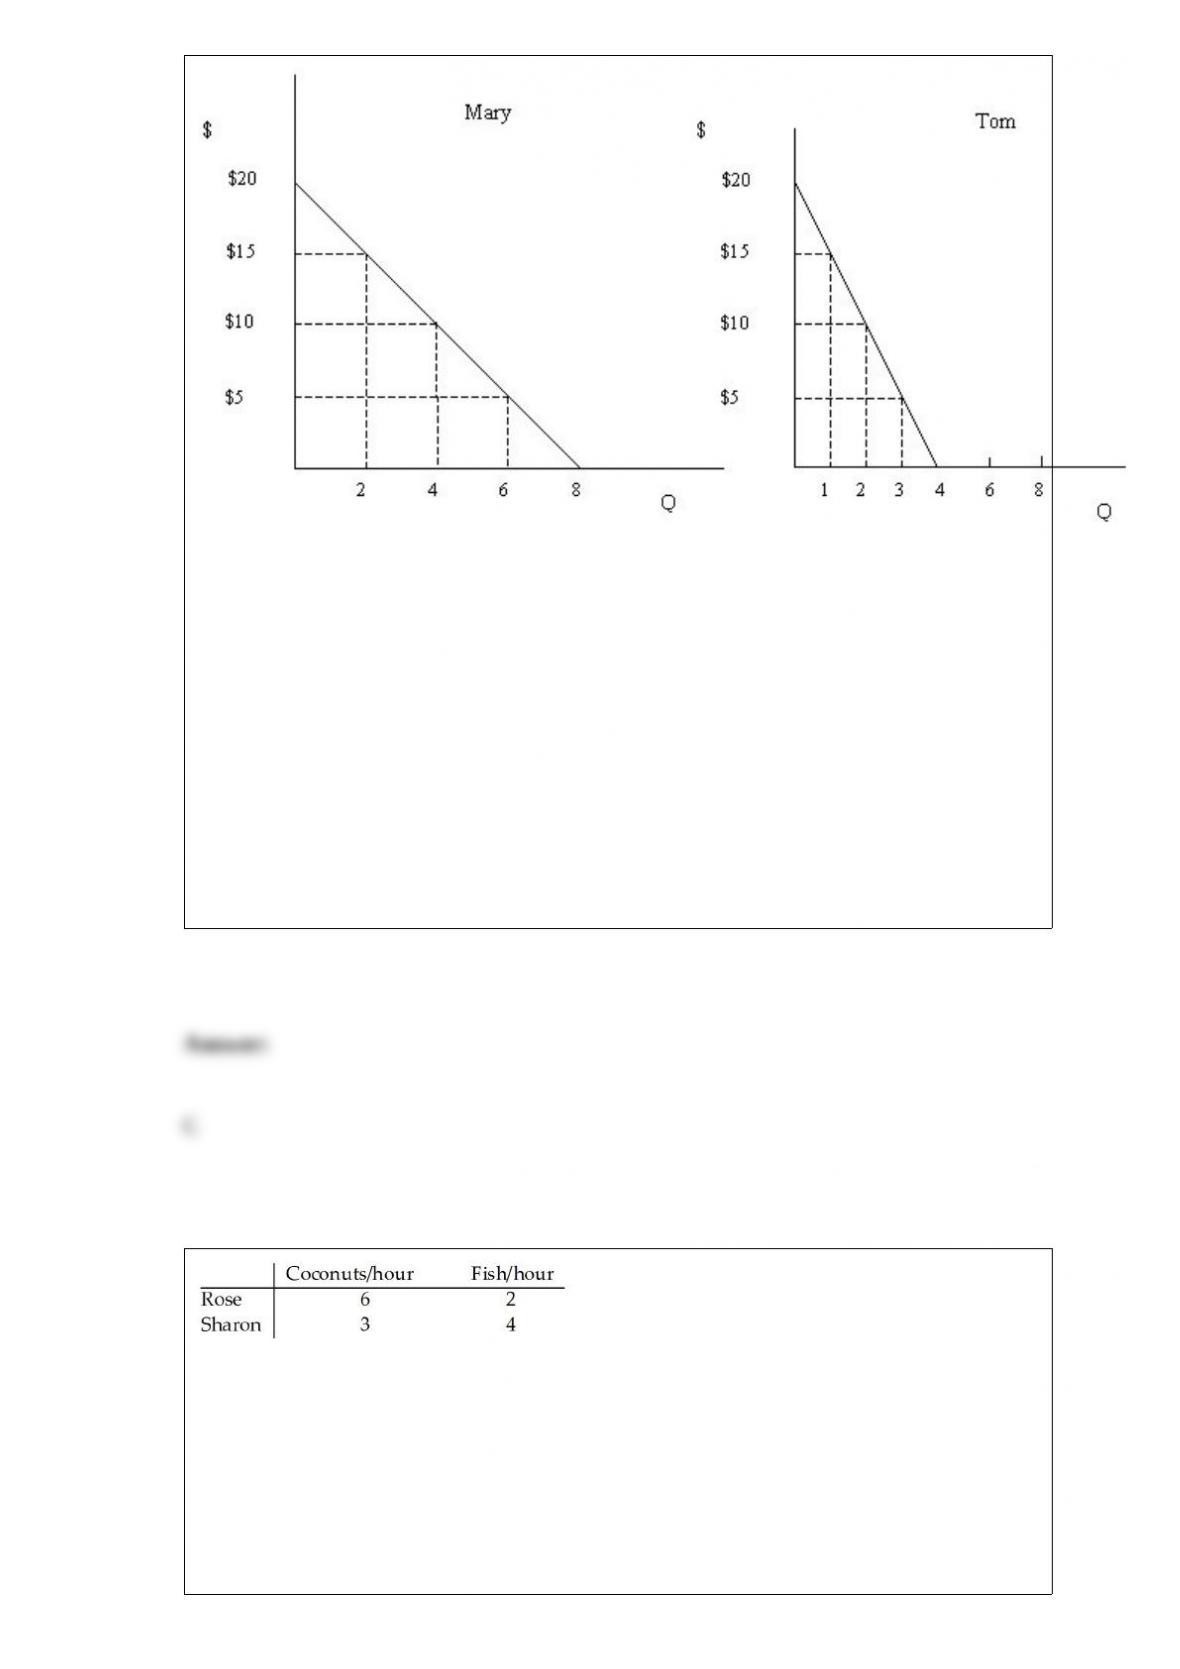
Figure 4.1
Refer to Figure 4.1 that shows Mary and Tom’s individual demand curves for meals per
week at Fratelli’s Italian Restaurant. Assuming Mary and Tom are the only consumers in
the market, what is the market quantity demanded at a price of $15?
A) 1
B) 2
C) 3
D) 9
Table 3.2
Consider two individuals, Rose and Sharon, who produce fish and coconuts. Rose and
Sharon’s hourly productivity are shown in Table 3.2. Rose’s opportunity cost of
producing 1 coconut is:
A) 1/3 fish.
B) 1 1/2 fish.
C) 3 fish.
D) 6 fish.
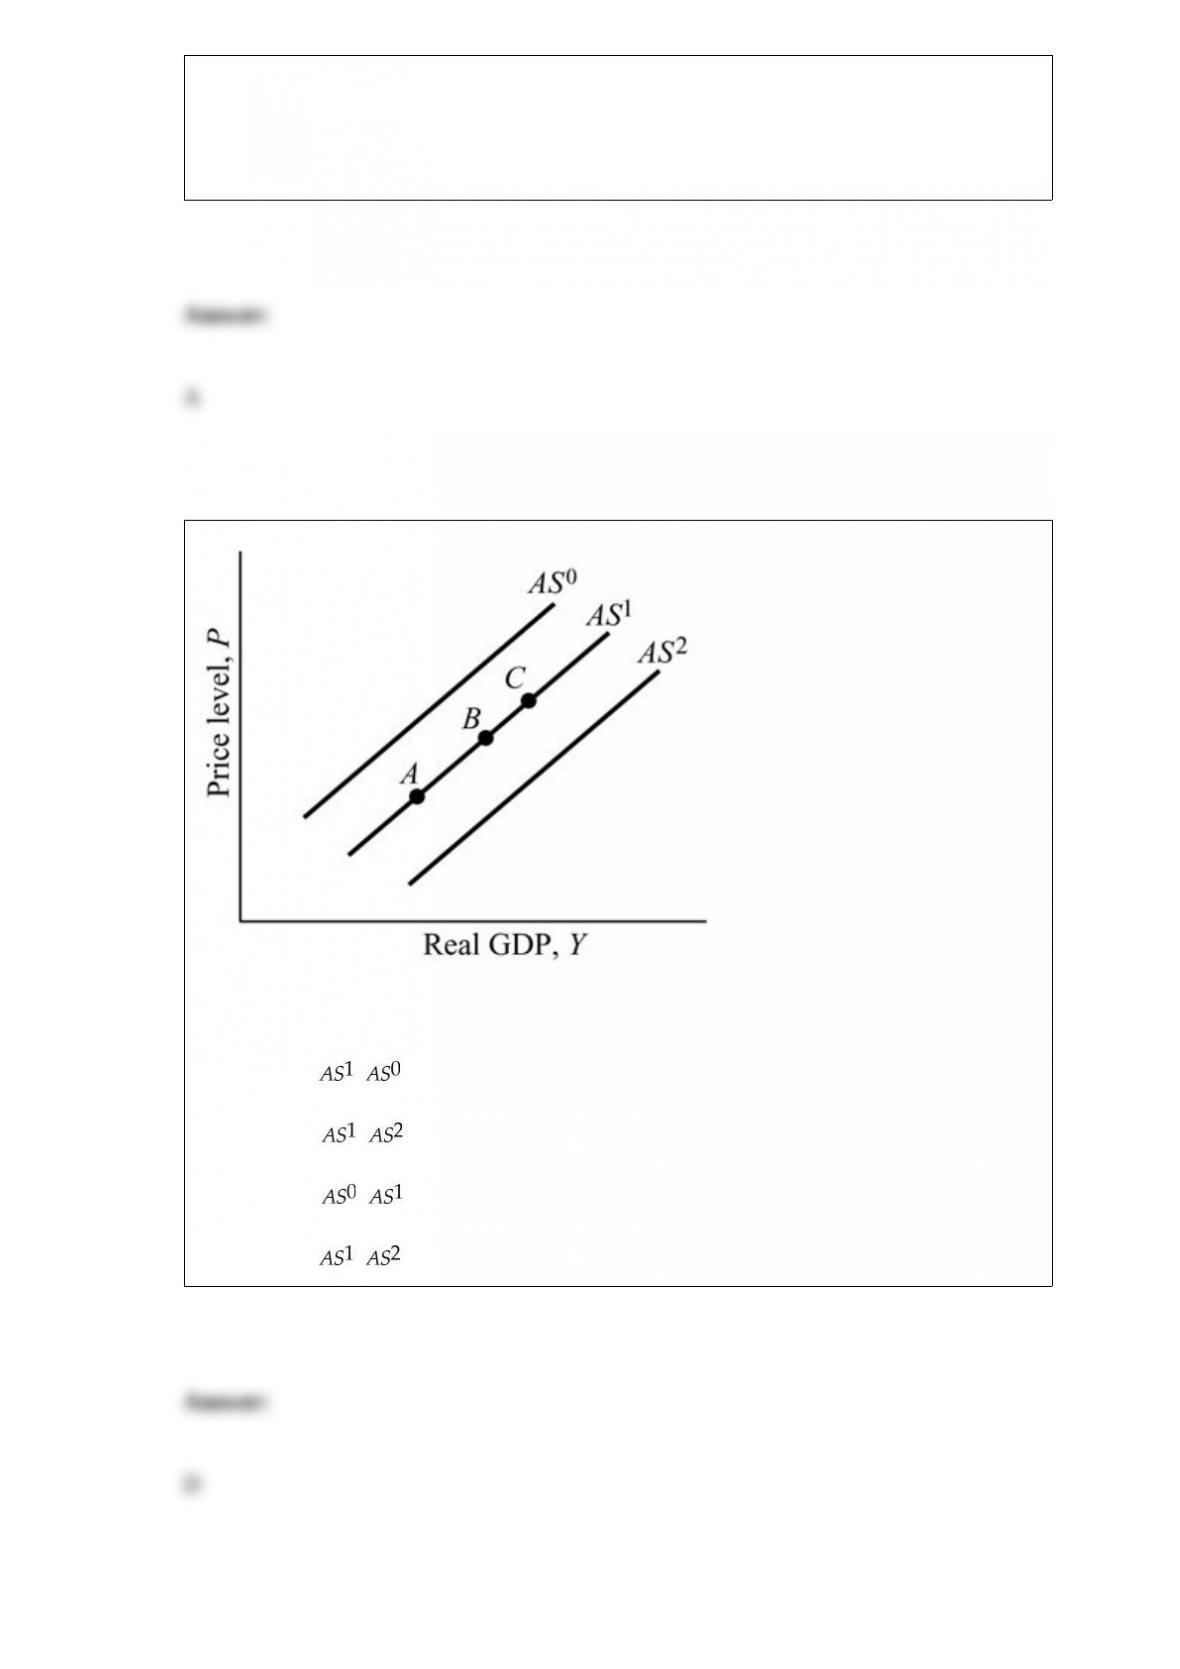
Figure 9.5 Refer to Figure 9.5. Suppose the economy is a point B. A large ________ in
the supply of labor leads to a shift from ________ to ________.
A) increase; ;
B) decrease; ;
C) decrease; ;
D) increase; ;

The marginal propensity to save (MPS) is the
A) amount of saving that is later consumed.
B) fraction of additional income that is saved.
C) part of consumption spending that does not depend on income.
D) total amount of income that is saved.