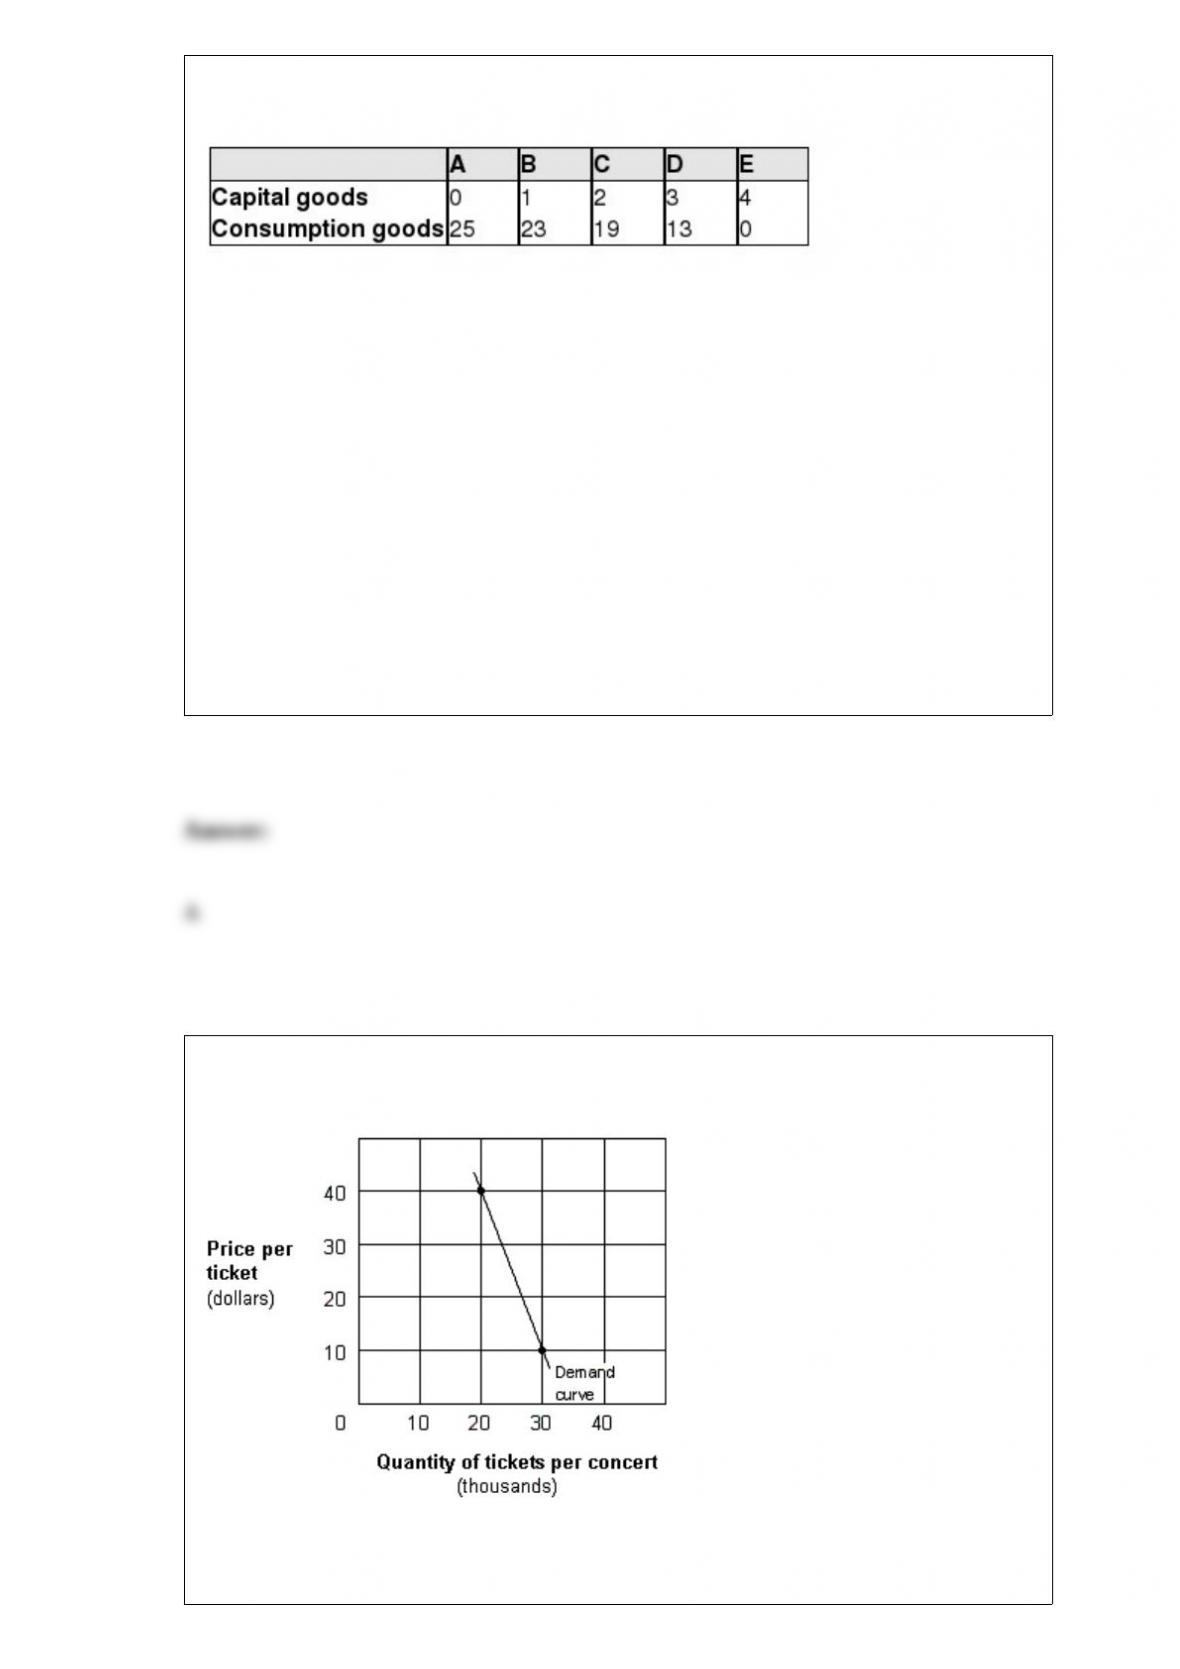
Exhibit 2-10 Production possibilities curve data
Suppose an economy is faced with the production possibilities table shown in Exhibit
2-10. The second unit of capital goods production will cost ____ units of consumption
goods, and the third unit of capital goods production will cost ____ units of
consumption goods.
a. 4; 6
b. 25; 23
c. 23; 19
d. 1; 23
e. 2; 19
Exhibit 5-7 Demand curve for concert tickets
In Exhibit 5-7, if promoters charge a price of $10 per ticket, then their total revenue is:
a. $240,000. c. $333,333.
b. $300,000. d. $800,000.

Consumer surplus is the:
a. number of consumers who are excluded from a market because of scarcity.
b. amount of a good that consumers will buy at a price below the equilibrium price.
c. amount consumers are willing to pay for a good minus the amount the consumers
actually pay for it.
d. amount consumers are willing to pay for a good minus the cost of producing the
good.
Perfect competition and monopolistic competition are similar because under both
market structures,
a. there are zero economic profits in the long run.
b. production takes place at the least-cost combination.
c. there are few firms.
d. entry is difficult.
e. differentiated products are produced.

Which of the following best describes the law of diminishing returns?
a. The principle that beyond some point the marginal product decreases as additional
units of a variable factor (ex: labor) are added to a fixed factor (ex: a restaurant
kitchen).
b. The concept that as a person consumes more and more of a good, such as pizza
slices, that the marginal utility from each additional slice will decline.
c. The empirical fact that the profitability of firms declines in the long run due to
increasing competition.
d. None of the above.
If Bill is willing to pay $10 for one good X, $8 for a second, and $6 for a third, and the
market price is $5, then Max’s consumer surplus is:
a. $24. c. $9.
b. $18. d. $6.
“The government should provide health care for all citizens.” This statement is an
illustration of:
a. positive economic analysis. c. fallacy of association analysis.
b. correlation analysis. d. normative economic analysis.

Consider the market for grapes. An increase in the wage paid to grape pickers will
cause the:
a. demand curve for grapes to shift to the right, resulting in a higher equilibrium price
for grapes and a reduction in the quantity consumed.
b. demand curve for grapes to shift to the left, resulting in a lower equilibrium price for
grapes and an increase in the quantity consumed.
c. supply curve for grapes to shift to the left, resulting in a lower equilibrium price for
grapes and a decrease in the quantity consumed.
d. supply curve for grapes to shift to the left, resulting in a higher equilibrium price for
grapes and a decrease in the quantity consumed.
Which of the following is not a type of merger?
a. b and e.
b. Diversified merger.
c. Horizontal merger.
d. Vertical merger.
e. Conglomerate merger.
Which of the following best describes social costs?
a. The external costs borne by other members of society, ignoring the private costs to
market participants.
b. The sum of external costs and private costs.
c. External costs minus private costs.
d. Private costs minus external costs.
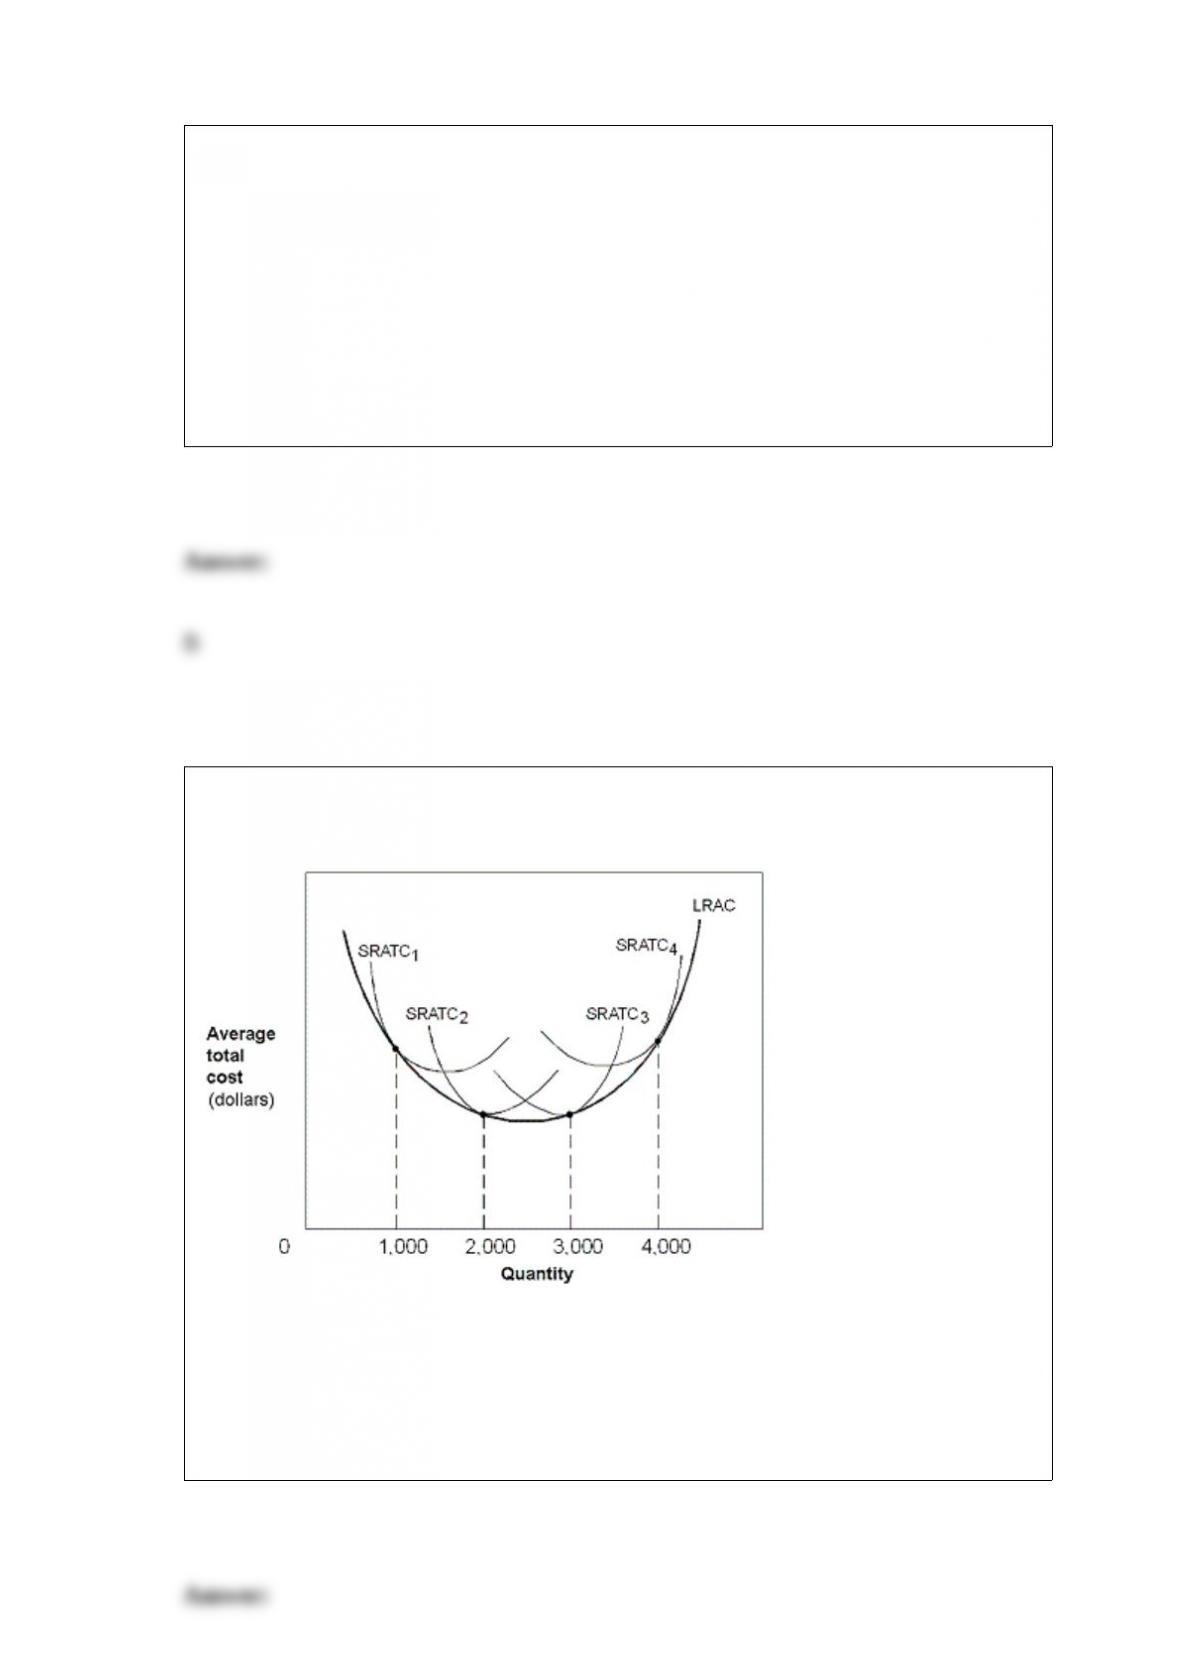
Exhibit 7-14 Cost curves
In Exhibit 7-14, constant returns to scale only exist for output levels between:
a. 0 and 1,000.
b. 1,000 and 2,000.
c. 2,000 and 3,000.
d. 3,000 and 4,000.
e. 4,000 and infinity.

In the United States, regulation increased steadily in the areas of health, safety, and the
environment during:
a. the Great Depression. c. the 1970s.
b. World War II. d. the 1980s.
The theory of monopolistic competition predicts that in long-run equilibrium a
monopolistically competitive firm will:
a. produce the output level at which price equals long-run marginal cost.
b. operate at minimum long-run average cost.
c. overutilize its insufficient capacity.
d. produce the output level at which price equals long-run average cost.
A demand curve:
a. has a positive slope.
b. illustrates the negative relationship between price and quantity demanded.
c. illustrates the positive relationship between price and quantity demanded.
d. is based on the assumption of a stable supply curve.
e. shifts about in a random fashion.
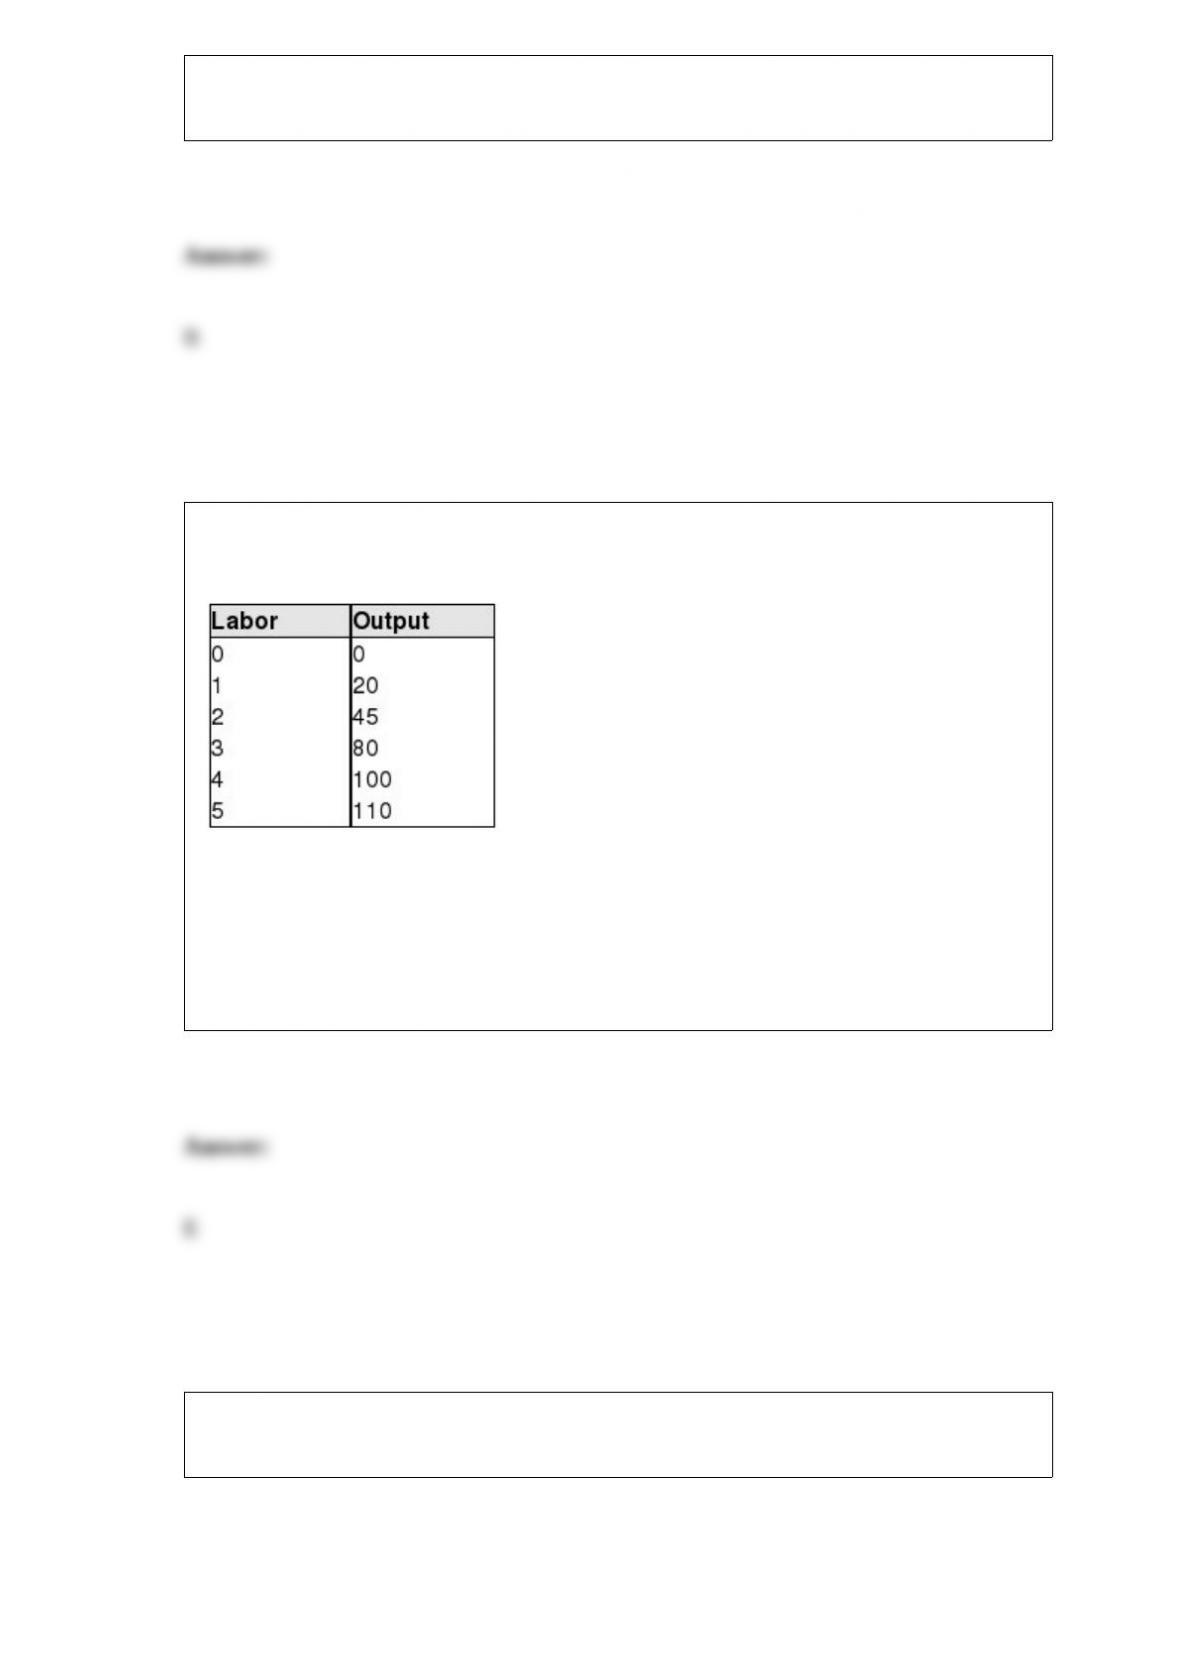
Exhibit 11-2 Labor and output data
In Exhibit 11-2, the marginal product of the 4th unit of labor is equal to:
a. 80.
b. 45.
c. 35.
d. 100.
e. 20.
Exhibit 9-7 Monopolist
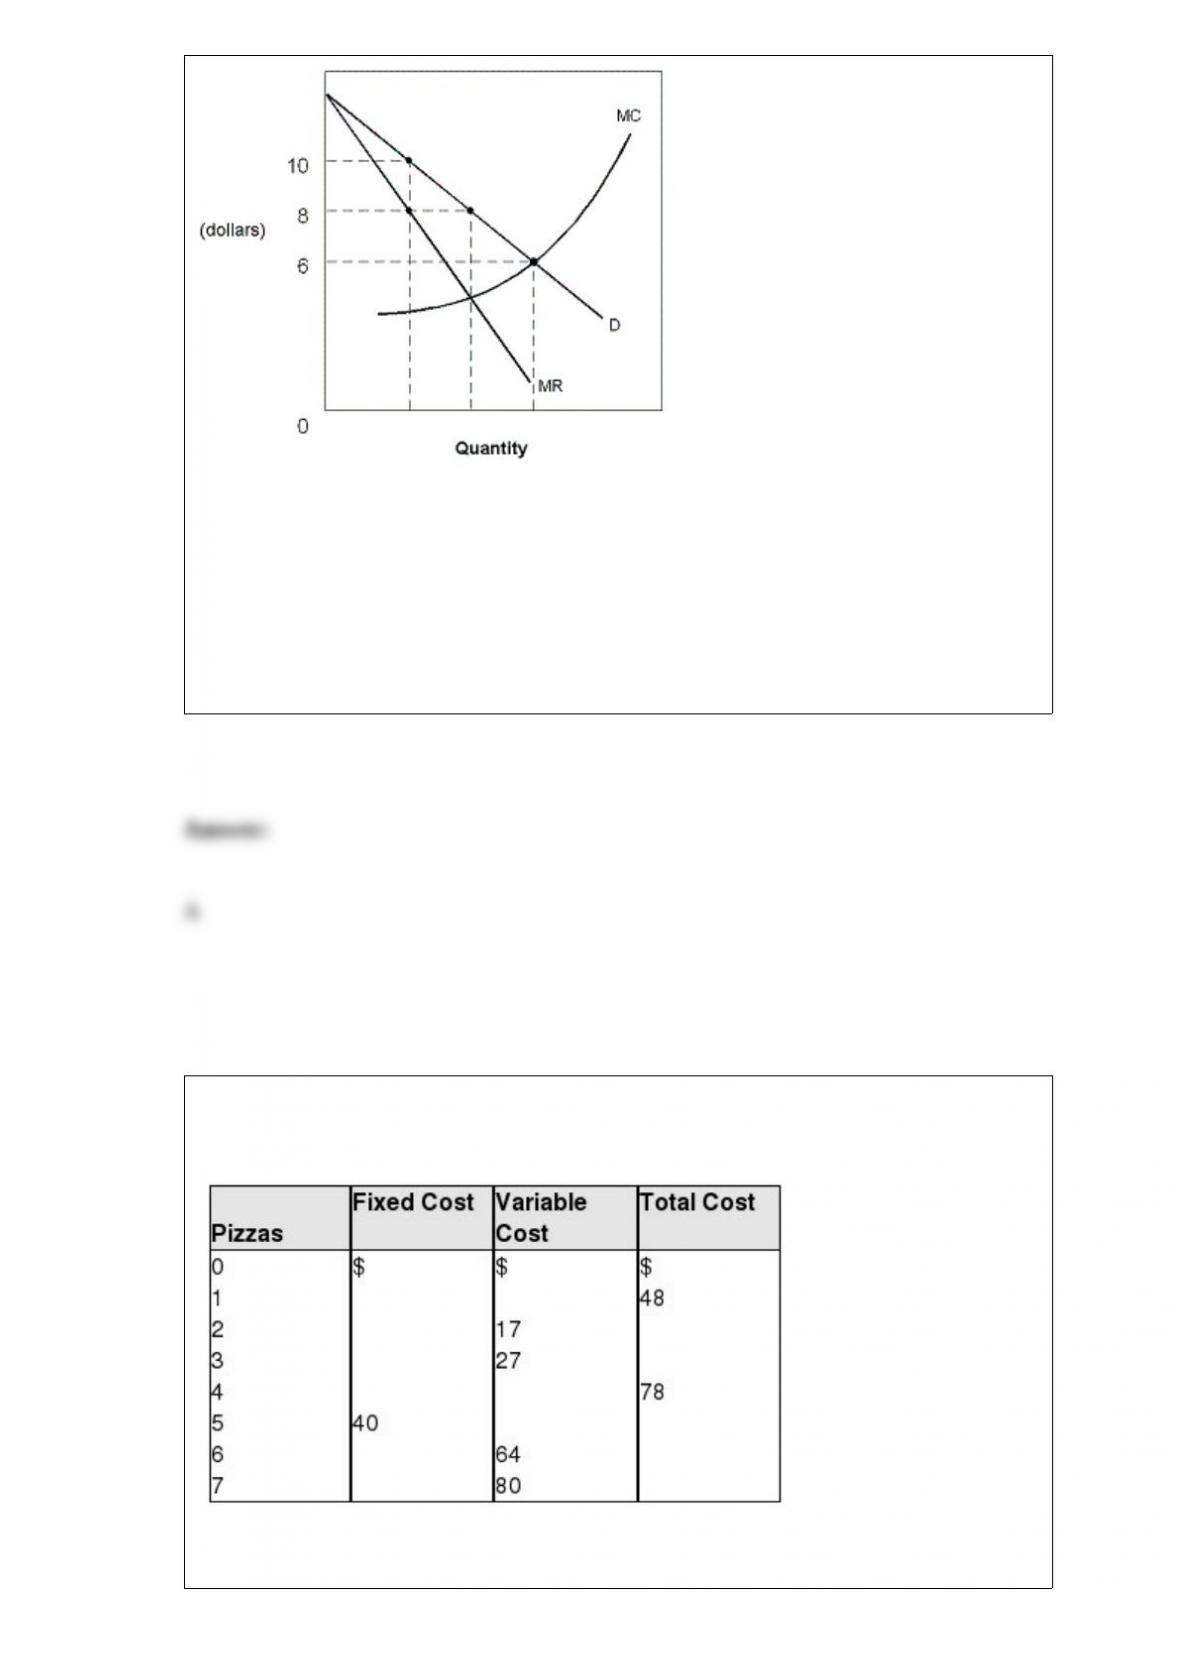
According to the information provided in Exhibit 9-7, if the Rudd Ice Company was a
monopoly and is currently charging a price of $8, what would you advise Rudd to do?
a. Stay where he is currently operating because he is charging the profit maximizing
price.
b. Increase price and increase output.
c. Decrease price and increase output.
d. Increase output and hold price constant.
e. Increase price and hold output constant.
Exhibit 7-12 Cost schedule for producing pizza
By filling in the blanks in Exhibit 7-12, the marginal cost of the fourth pizza is shown to
be equal to:
a. $10.
b. $11.
c. $12.
d. $13.
e. $14.
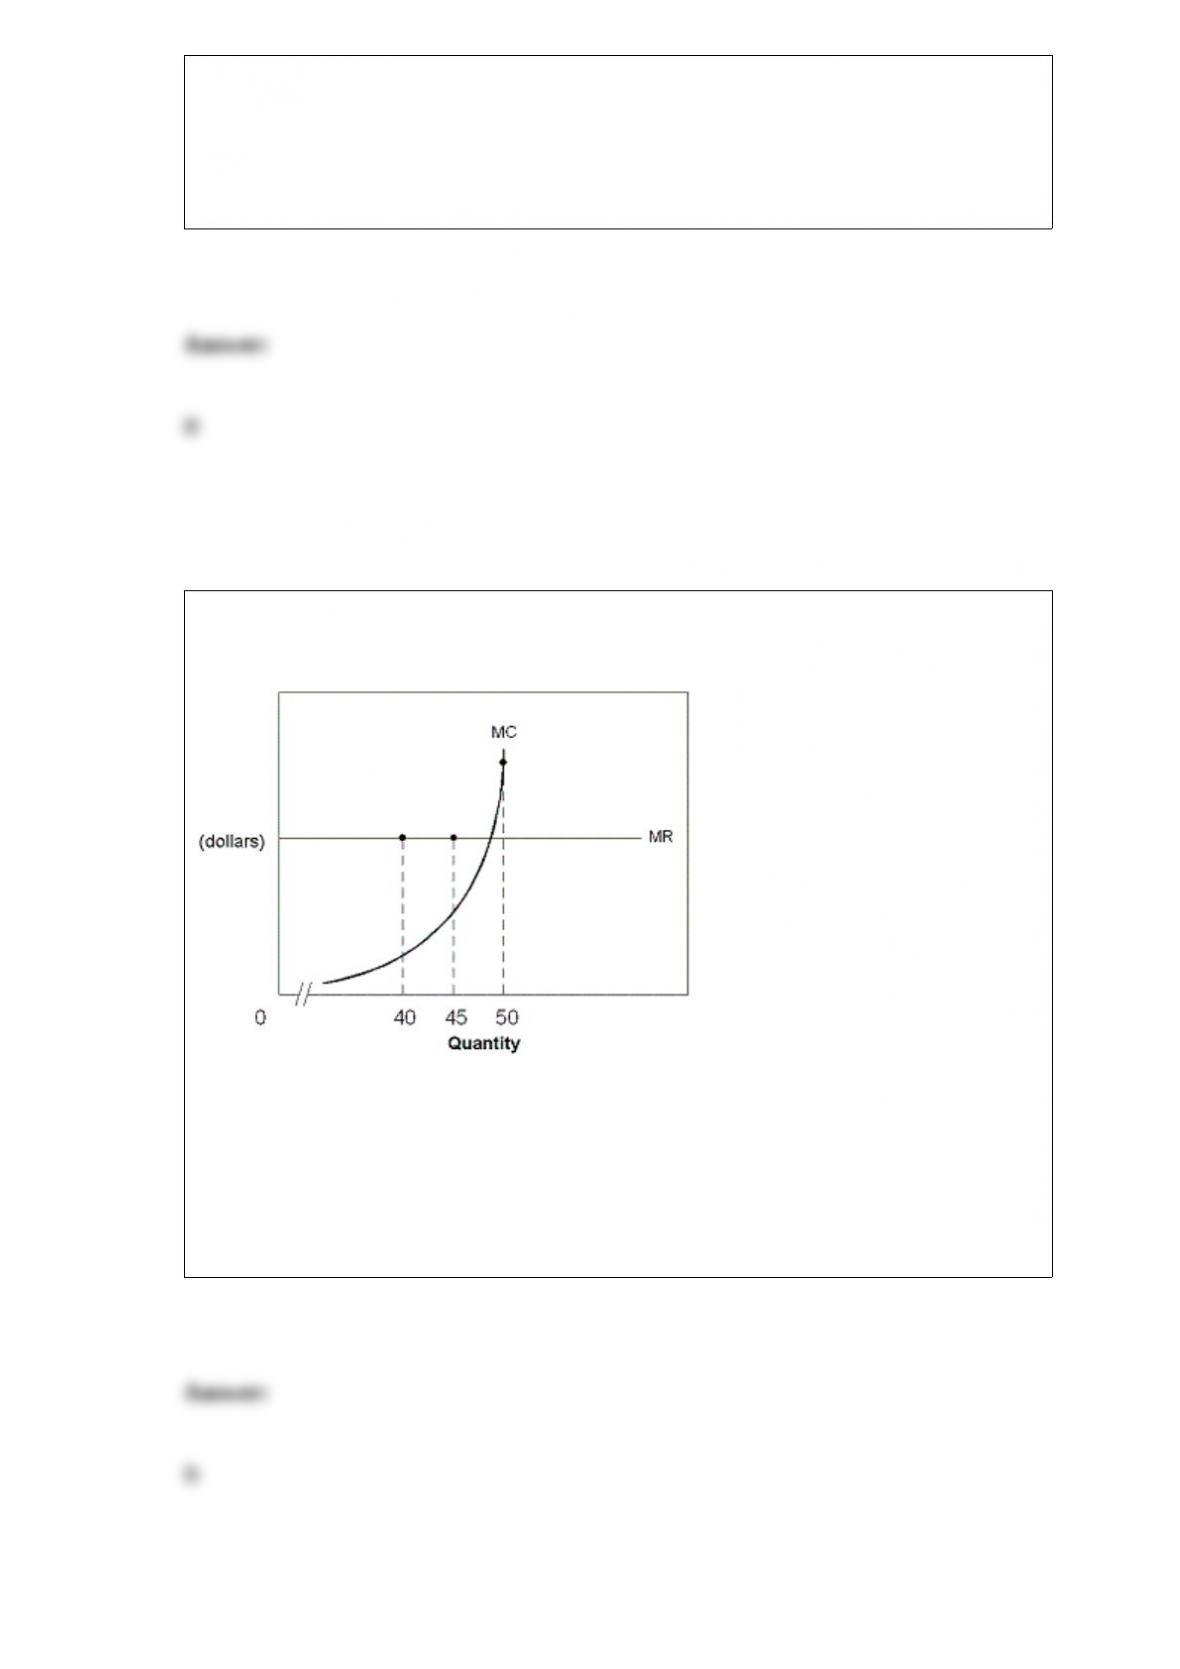
Exhibit 8-5 A firm’s MR and MC curves
In Exhibit 8-5, a firm is currently producing 40 units of output. What would you advise
this firm to do?
a. Shut down.
b. Increase output.
c. Stay at its current output.
d. Decrease output.
e. Decrease price.