The ________ is a measure of the price level and is calculated by dividing ________ by
________ and multiplying by 100.
A) CPI; real GDP; nominal GDP
B) GDP deflator; real GDP; nominal GDP
C) GDP deflator; nominal GDP; real GDP
D) PPI; nominal GDP; real GDP
E) PPI; real GDP; nominal GDP
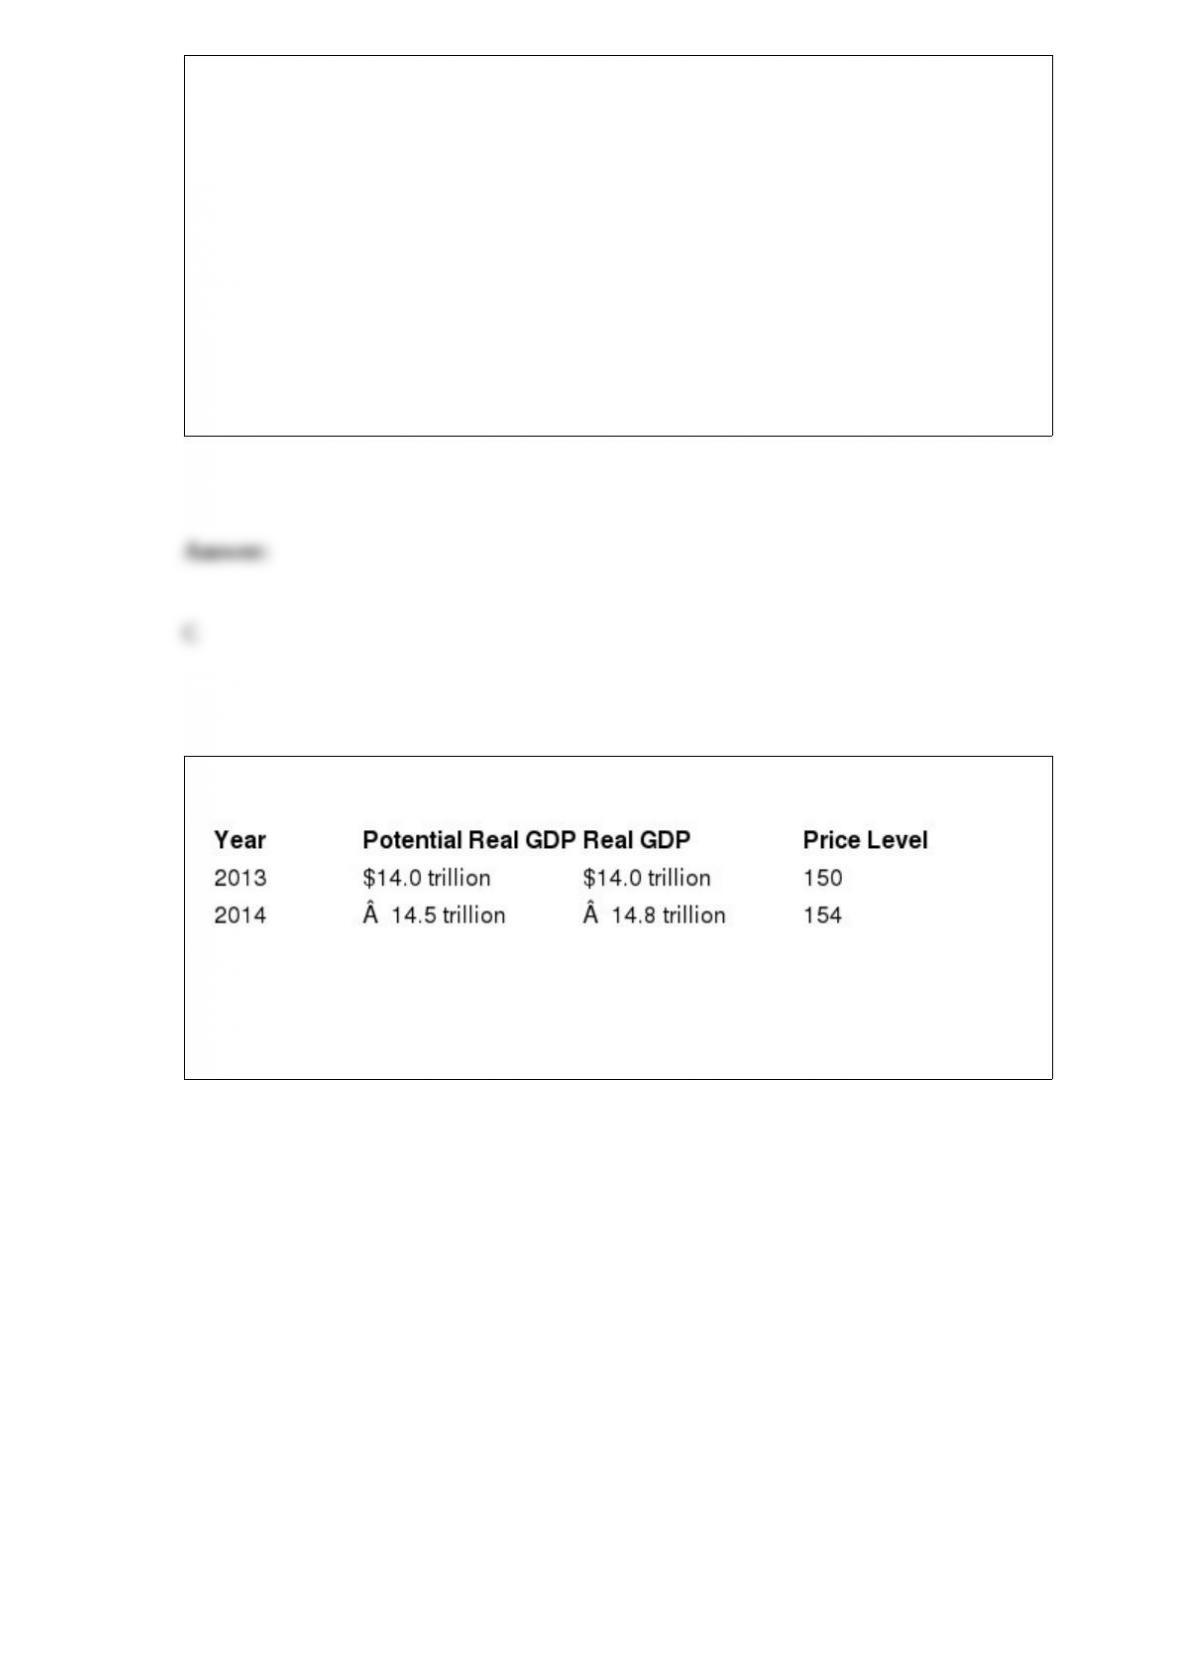
Table 16-2
Refer to Table 16-2. Consider the hypothetical information in the table above for
potential real GDP, real GDP and the price level in 2013 and in 2014 if the Congress
and the president do not use fiscal policy. If the Congress and the president want to
keep real GDP at its potential level in 2014, they should
1. A) buy Treasury securities.
2. B) conduct expansionary fiscal policy.
3. C) decrease government purchases.
4. D) decrease the discount rate.
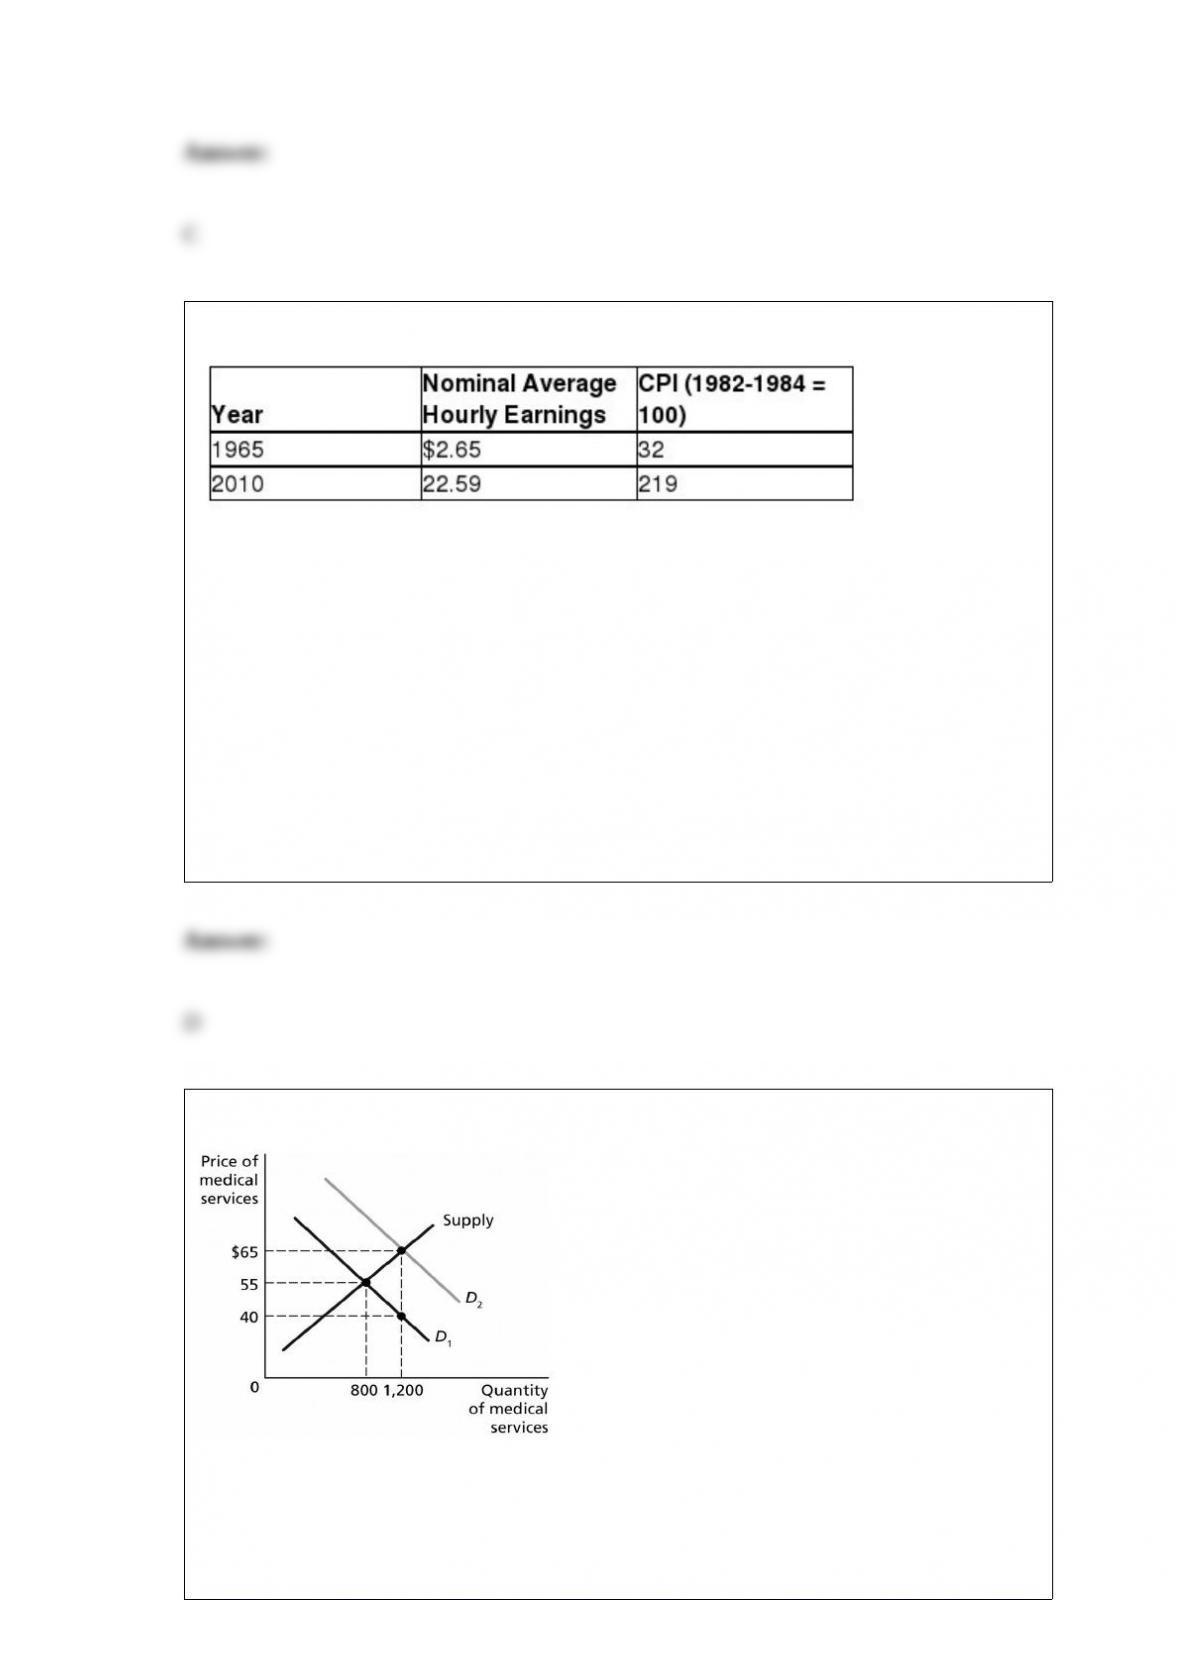
Table 9-14
The table above reports the nominal average hourly earnings in private industry and the
consumer price index for 1965 and 2010.
Refer to Table 9-14. The real average hourly earnings for 1965 in 2010 dollars equal
A) $3.87.
B) $5.80.
C) $12.10.
D) $18.14.
Figure 5-3
Figure 5-3 represents the market for medical services with and without insurance, and
the effect of a third-party payer system on the demand for medical services.
Refer to Figure 5-3. If consumers paid the full price of medical services, the price they
would pay is

A) $40.
B) $55.
C) $65.
D) >$65.
Of the $840 billion American Recovery and Reinvestment Act stimulus package which
was enacted in 2009, the largest tax cuts occurred in which category?
A) business tax cuts
B) energy tax cuts
C) individual tax cuts
D) infrastructure tax cuts
Destabilizing speculation refers to
A) actions taken by the International Monetary Fund that increase lending to countries
who have pegged their currencies against the dollar.
B) actions taken by currency traders to sell a currency that is undervalued.
C) actions taken by investors who sell a country’s currency in anticipation of buying it
back later at a lower price.
D) any depreciation of a country’s currency as a result of long-run adjustments to
purchasing power parity.

Assume that Australia has a comparative advantage in producing surfboards and New
Zealand imports surfboards from Australia. We can conclude that
A) Australia also has an absolute advantage in producing surfboards relative to New
Zealand.
B) Australia has a lower opportunity cost of producing surfboards relative to New
Zealand.
C) New Zealand has an absolute disadvantage in producing surfboards relative to
Australia.
D) Labor costs are higher for surfboard producers in New Zealand than in Australia.
If changes in inflation are higher than expected,
A) the short-run Phillips curve will be positively sloped, but not vertical.
B) the short-run Phillips curve will be negatively sloped.
C) the short-run Phillips curve will be vertical.
D) the long-run Phillips curve will be negatively sloped.
Some factors currently exist that inhibit the growth rate of the Chinese economy. One
reason that General Motors has been unwilling to bring its latest technology for
building electric and hybrid cars to China is
A) the introduction of free-market reforms.
B) the introduction of the relatively new resource of entrepreneurship.
C) the lack of laws that predictably enforce property rights.
D) the total lack of governmental intervention in the market place.
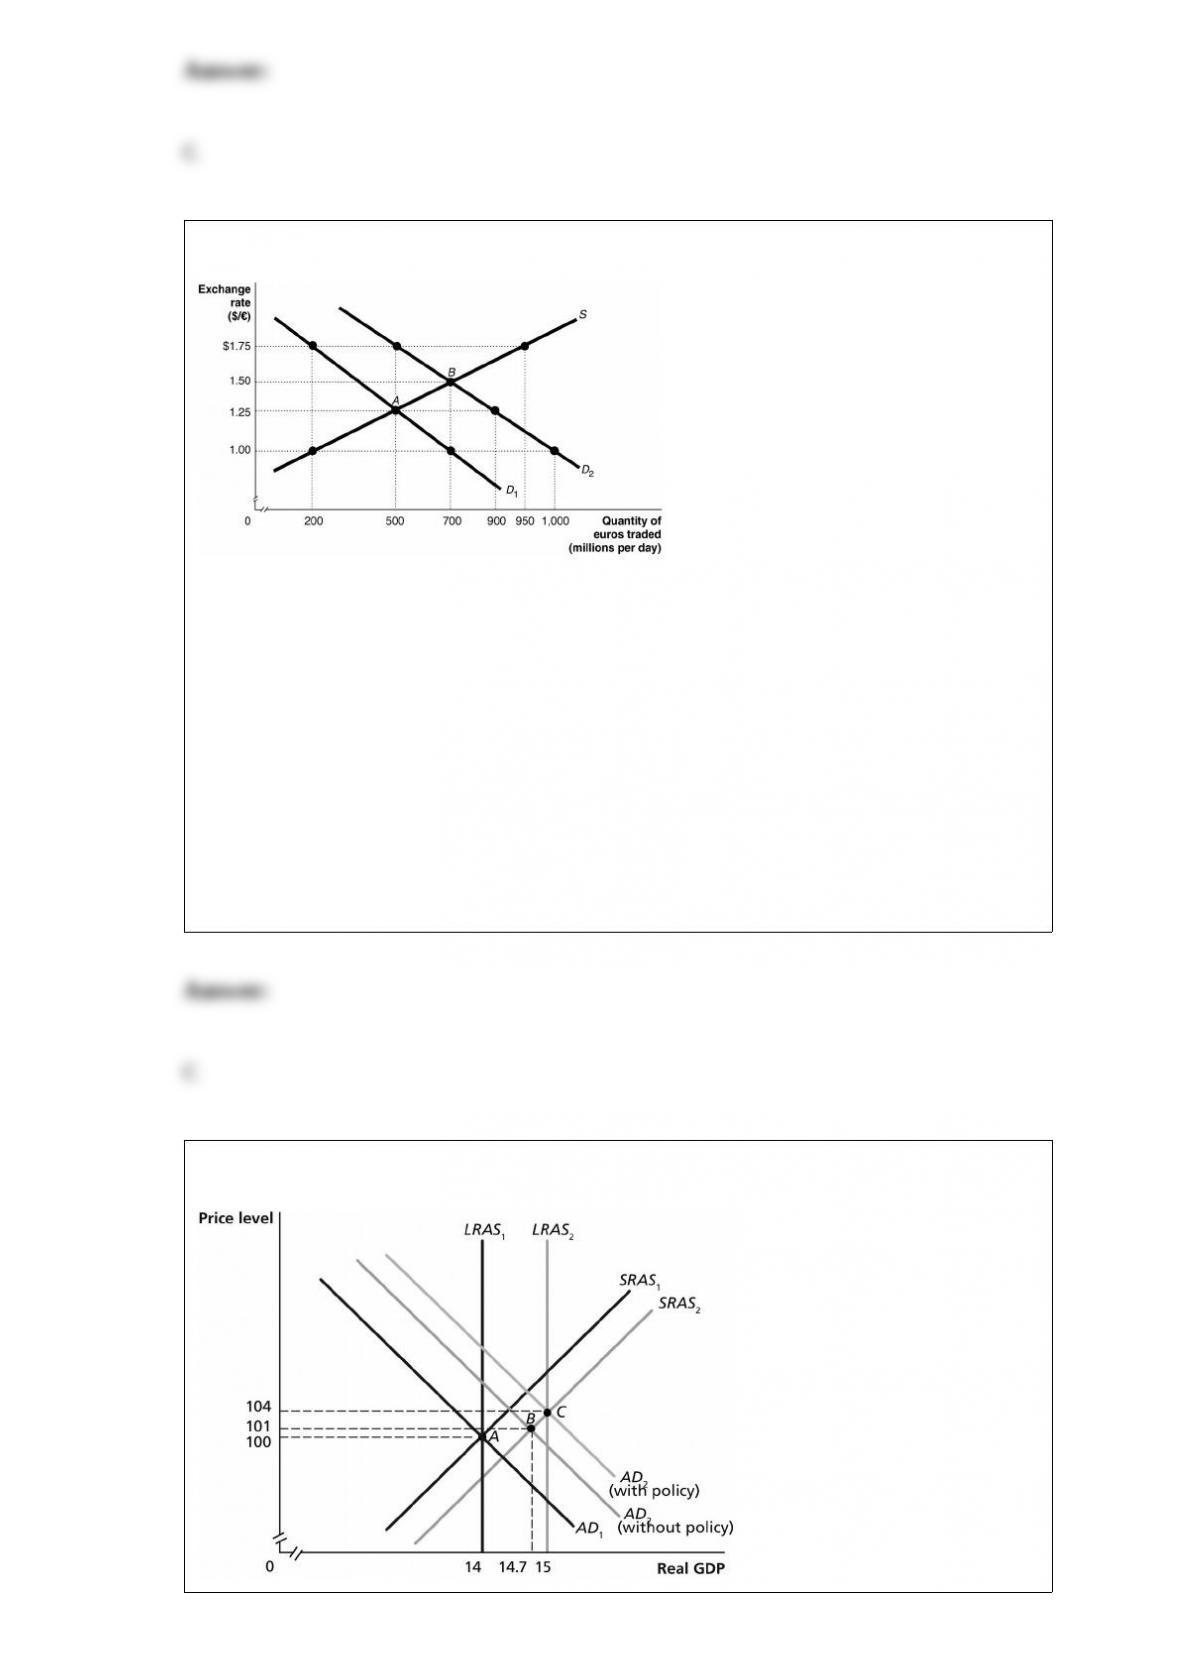
Figure 19-8
Refer to Figure 19-8. The equilibrium exchange rate is at A, $1.25/euro. Suppose the
European Central Bank pegs its currency at $1.00/euro. Speculators expect that the
value of the euro will rise and this shifts the demand curve for euro to D2. After the
shift,
A) there is a shortage of euro equal to 1,000 million.
B) there is a surplus of euro equal to 400 million.
C) there is a shortage of euro equal to 800 million.
D) there is a surplus of euro equal to 500 million.
Figure 16-8

Refer to Figure 16-8. In the graph above, suppose the economy in Year 1 is at point A
and expected in Year 2 to be at point B. Which of the following policies could the
Congress and the president use to move the economy to point C?
A) increase government purchases
B) decrease government purchases
C) increase income taxes
D) sell Treasury bills
The core personal consumption expenditures price index excludes
A) food and energy prices.
B) food and housing prices.
C) energy and housing prices.
D) housing and health care prices.
Some economists argue that the productivity slowdown of the mid-1970s to the
mid-1990s was due to changes in oil prices that
A) increased production costs, causing firms to reorganize production to conserve
energy, which reduced output per worker.
B) decreased production costs, causing firms to reorganize production to conserve
energy, which reduced output per worker.
C) increased production costs, causing firms to reorganize production to conserve
energy, which increased output per worker.
D) decreased production costs, causing firms to increase production, which reduced
output per worker.

Suppose President Obama is successful in passing a $5 billion tax increase. Assume that
taxes are fixed, the economy is closed, and the marginal propensity to consume is 0.75.
What happens to equilibrium GDP?
A) There is a $20 billion increase in equilibrium GDP.
B) There is a $20 billion decrease in equilibrium GDP.
C) There is a $15 billion increase in equilibrium GDP.
D) There is a $15 billion decrease in equilibrium GDP.
Which of the following could cause nominal GDP to decrease, but real GDP to
increase?
A) The price level rises and the quantity of final goods and services produced rises.
B) The price level falls and the quantity of final goods and services produced rises.
C) The price level rises and the quantity of final goods and services produced falls.
D) The price level falls and the quantity of final goods and services produced falls.
When ________ in a market, the total net benefit to society is maximized.
A) deadweight loss is maximized
B) a competitive equilibrium is achieved
C) consumer surplus is minimized
D) producer surplus is minimized

In Singapore the government places a $5,000 tax on the buyers of new automobiles.
After the purchase of a new car, a buyer must pay the government $5,000. How would
the imposition of the tax on buyers be illustrated in a graph?
A) The tax will shift the demand curve to the right by $5,000.
B) The tax will shift the demand curve to the left by $5,000.
C) The tax will shift both the demand and supply curve to the right by $5,000.
D) The tax will shift the supply curve to the left by $5,000.
The nominal interest rate will be less than the real interest rate when
A) the rate of inflation is positive but decreasing.
B) the rate of inflation is positive and increasing.
C) the rate of inflation is negative.
D) the real interest rate is negative.
The tax increases necessary to fund future Social Security and Medicare benefit
payments would be
A) small, and have little effect on economic growth.
B) small, but could discourage work effort, entrepreneurship and investment, thereby
slowing economic growth.
C) large, but would have little effect on economic growth.

D) large, and could discourage work effort, entrepreneurship and investment, thereby
slowing economic growth.