1) Graphs such as bar graphs and pie charts are limited in that they
a.can only show variables that are positively related.
b.can only show variables that have a negative correlation.
c.provide information on only one variable.
d.provide information on no more than two variables.
2)
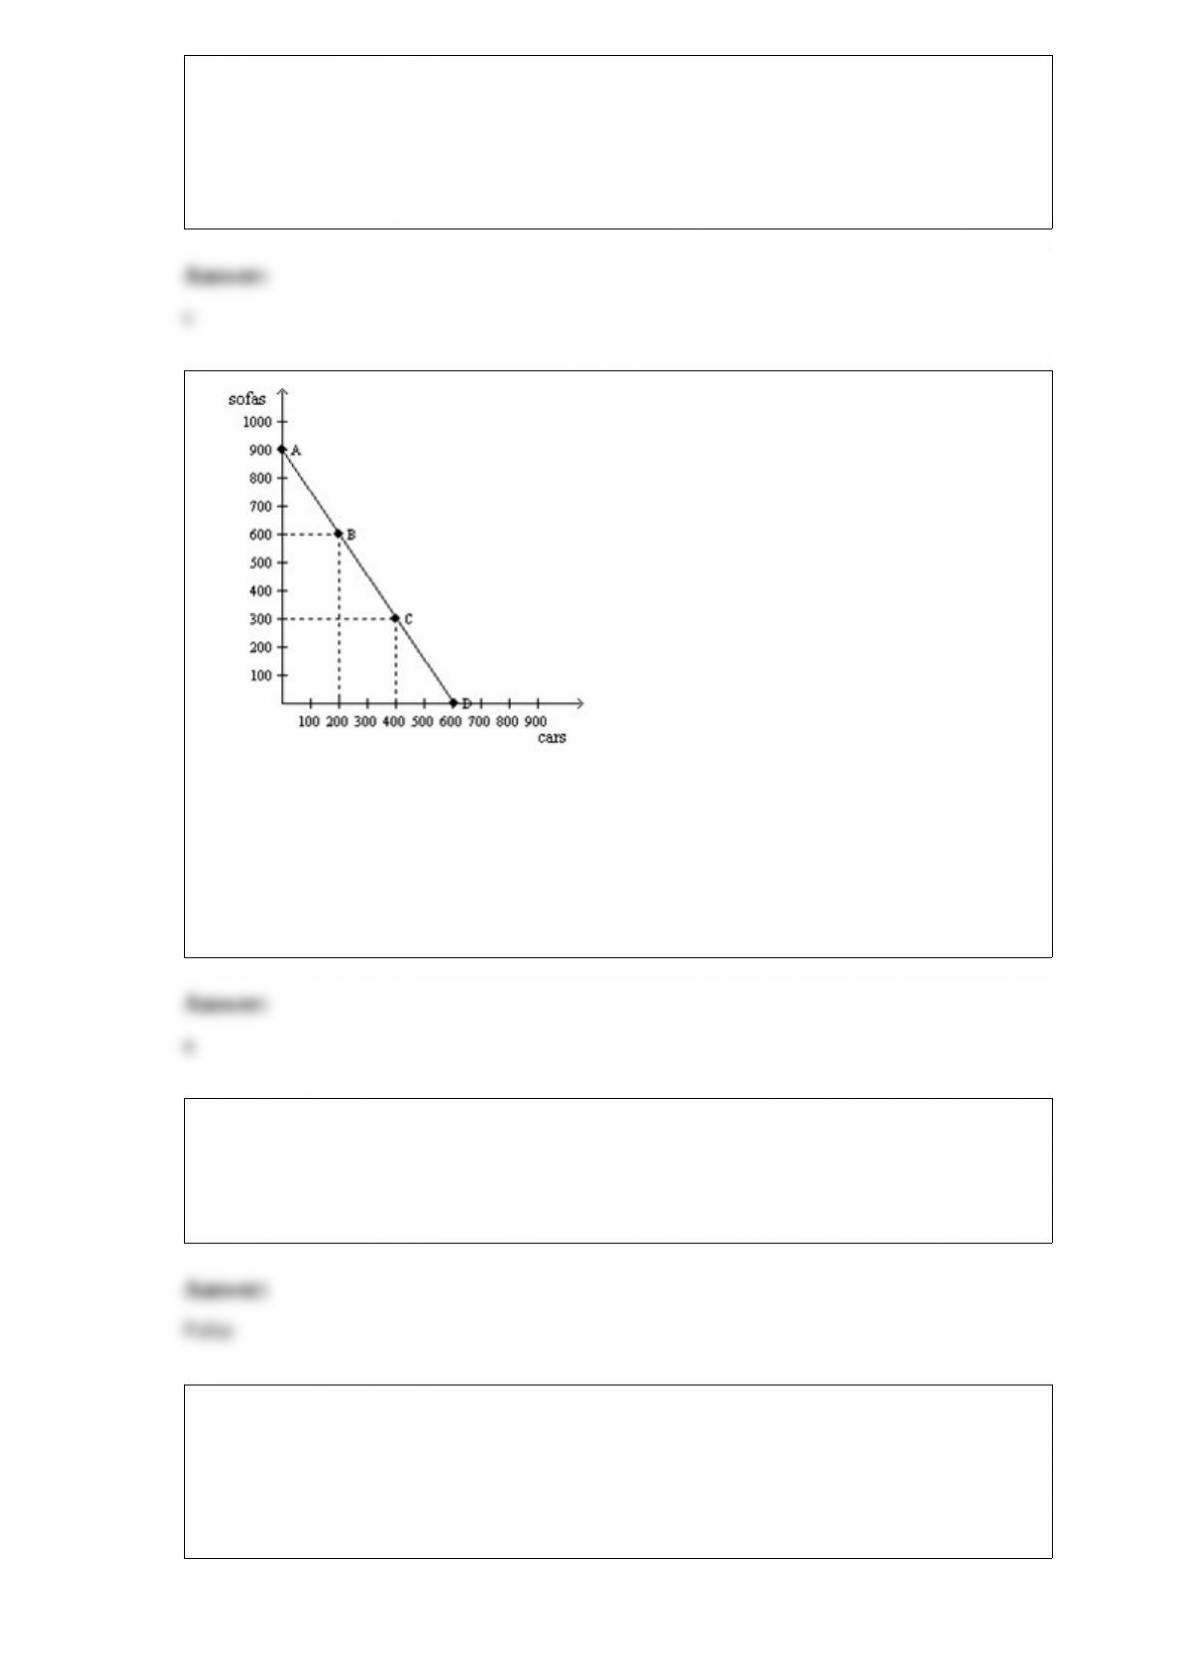
Consider the production possibilities frontier for an economy that produces only sofas
and cars. When society moves from point A to point B,
a.the opportunity cost is the same as when society moves from point B to point C.
b.it is giving up cars to get sofas.
c.the opportunity cost is increasing.
d.it moves from an inefficient point to an efficient point.
3) Political leaders are always aiming for an optimal combination of efficiency and
equality.
a.True
b.False
4) One reason that private solutions to externalities do not always work is that
a.government intervention negates the benefits of positive externalities.
b.some people benefit from externalities.
c.interested parties incur costs in the bargaining process.
d.charities are not well organized.

5) Figure 21-6
Refer to Figure 21-6. Suppose a consumer has $100 in income, the price of popcorn is
$2, and the value of B is 100. What is the price of Mt. Dew?
a.$1
b.$2
c.$5
d.$100
6) Which of the following can defeat the profit-maximizing strategy of price
discrimination?
a.consumer surplus
b.deadweight loss
c.market power
d.arbitrage
7) Uzbekistan’s Production Possibilities FrontierAzerbaijan’s Production
Possibilities Frontier

Azerbaijan’s opportunity cost of one bolt is
a.1/4 nail and Uzbekistan’s opportunity cost of one bolt is 1/2 nail.
b.1/4 nail and Uzbekistan’s opportunity cost of one bolt is 2 nails.
c.4 nails and Uzbekistan’s opportunity cost of one bolt is 1/2 nail.
d.4 nails and Uzbekistan’s opportunity cost of one bolt is 2 nails.
8) If we were to observe above-equilibrium wages in a particular labor market, then a
possible explanation might be that
a.the theory of efficiency wages holds true for that market.
b.there is a powerful labor union representing workers in that market.
c.workers are largely unskilled and/or inexperienced and minimum-wage laws are
effectively holding wages up in that market.
d.All of the above are correct.
9) As the number of firms in an oligopoly becomes very large, the price effect
disappears.
a.True
b.False
10) University financial aid can be viewed as a type of price discrimination.
a.True
b.False
11) Which of the following is a way to address an externality problem?
a.command and control solution
b.corrective tax
c.corrective subsidy
d.all of the above.
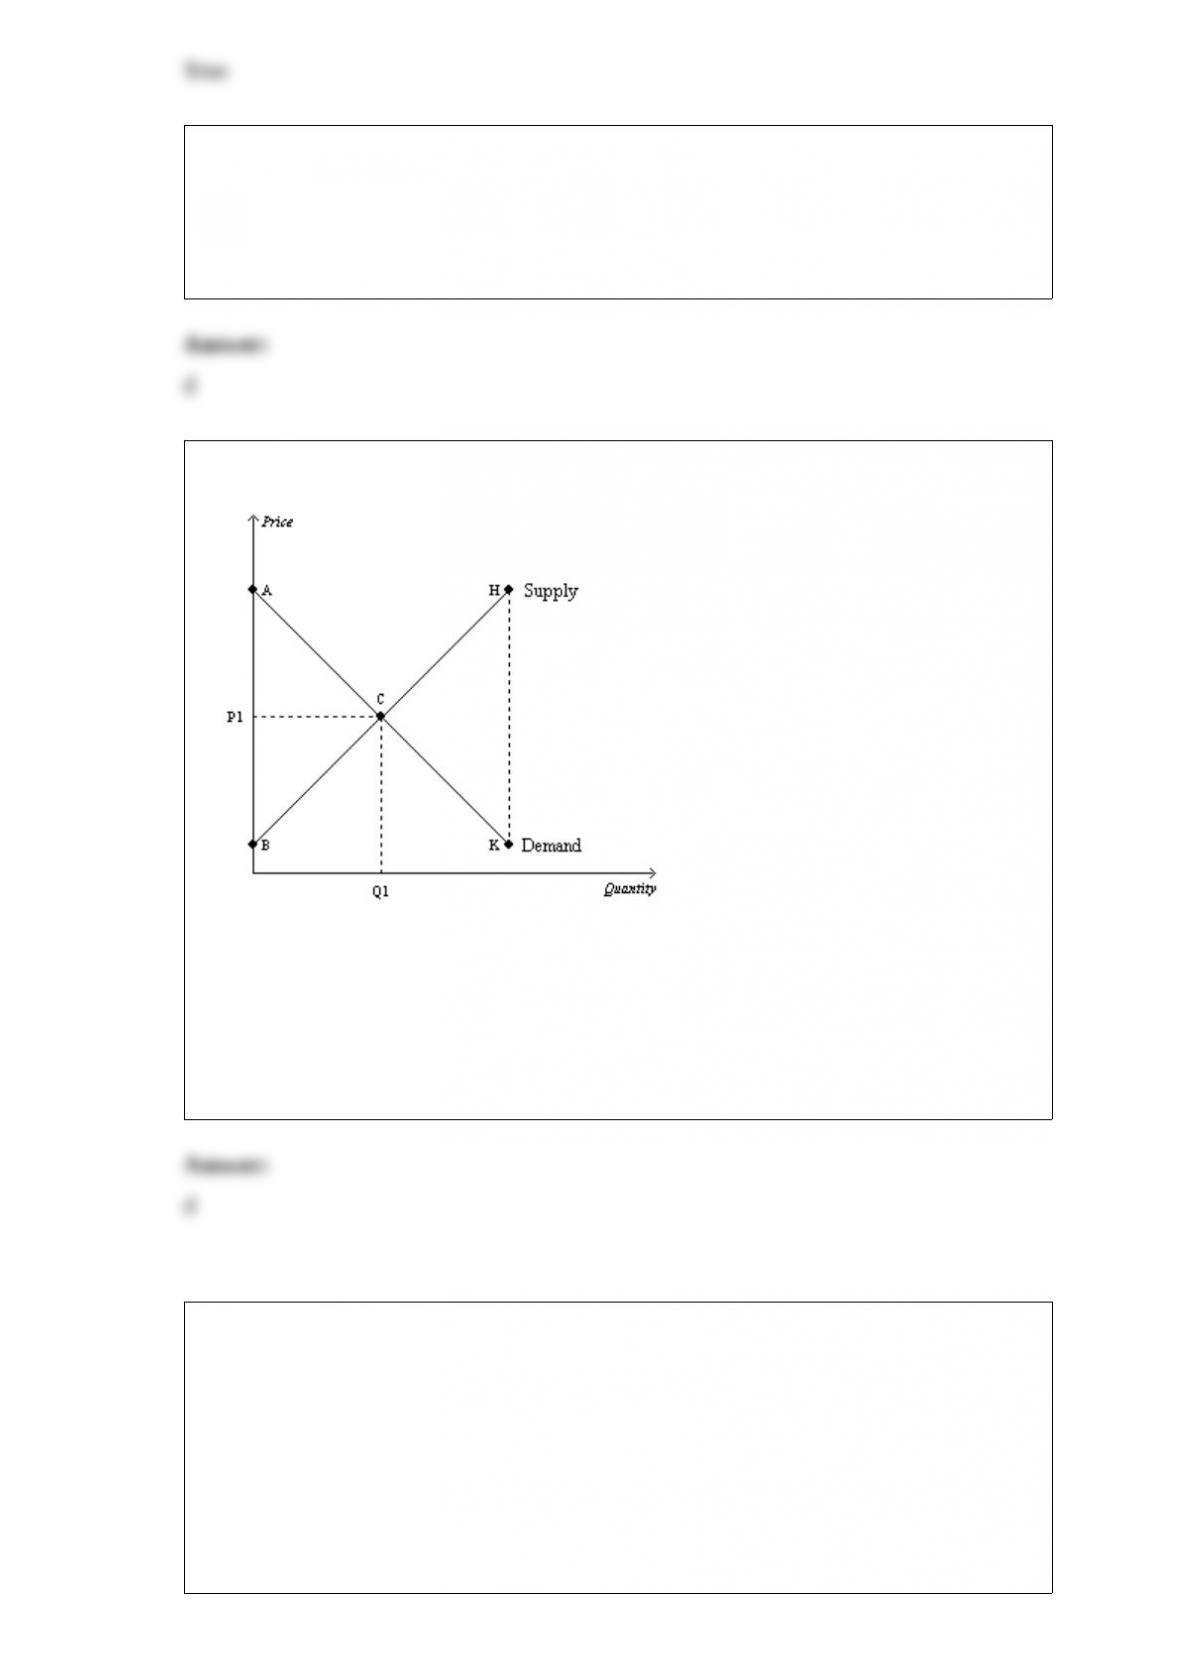
12) Figure 7-27
Refer to Figure 7-27. Sellers whose costs are greater than the equilibrium price are
represented by segment
a.AC.
b.CK.
c.BC.
d.CH.
13) Scenario 13-12
Ariana withdrew $400,000 out of her personal savings account and used it to start her
new Internet cafe. The savings account pays 3 percent interest per year. During the first
year of her business, Ariana sold 2,000 cups of coffee for $2.50 per cup and 4,000 hours
of Internet time, also at $2.50 per hour. During the first year, the business made
monetary outlays of $9,000. You may assume that there is no opportunity cost to
Ariana’s time.
Ariana’s economic profit for the year was
a. $-394,000.
b. $-6,000.
c. $3,000.
d. $6,000.
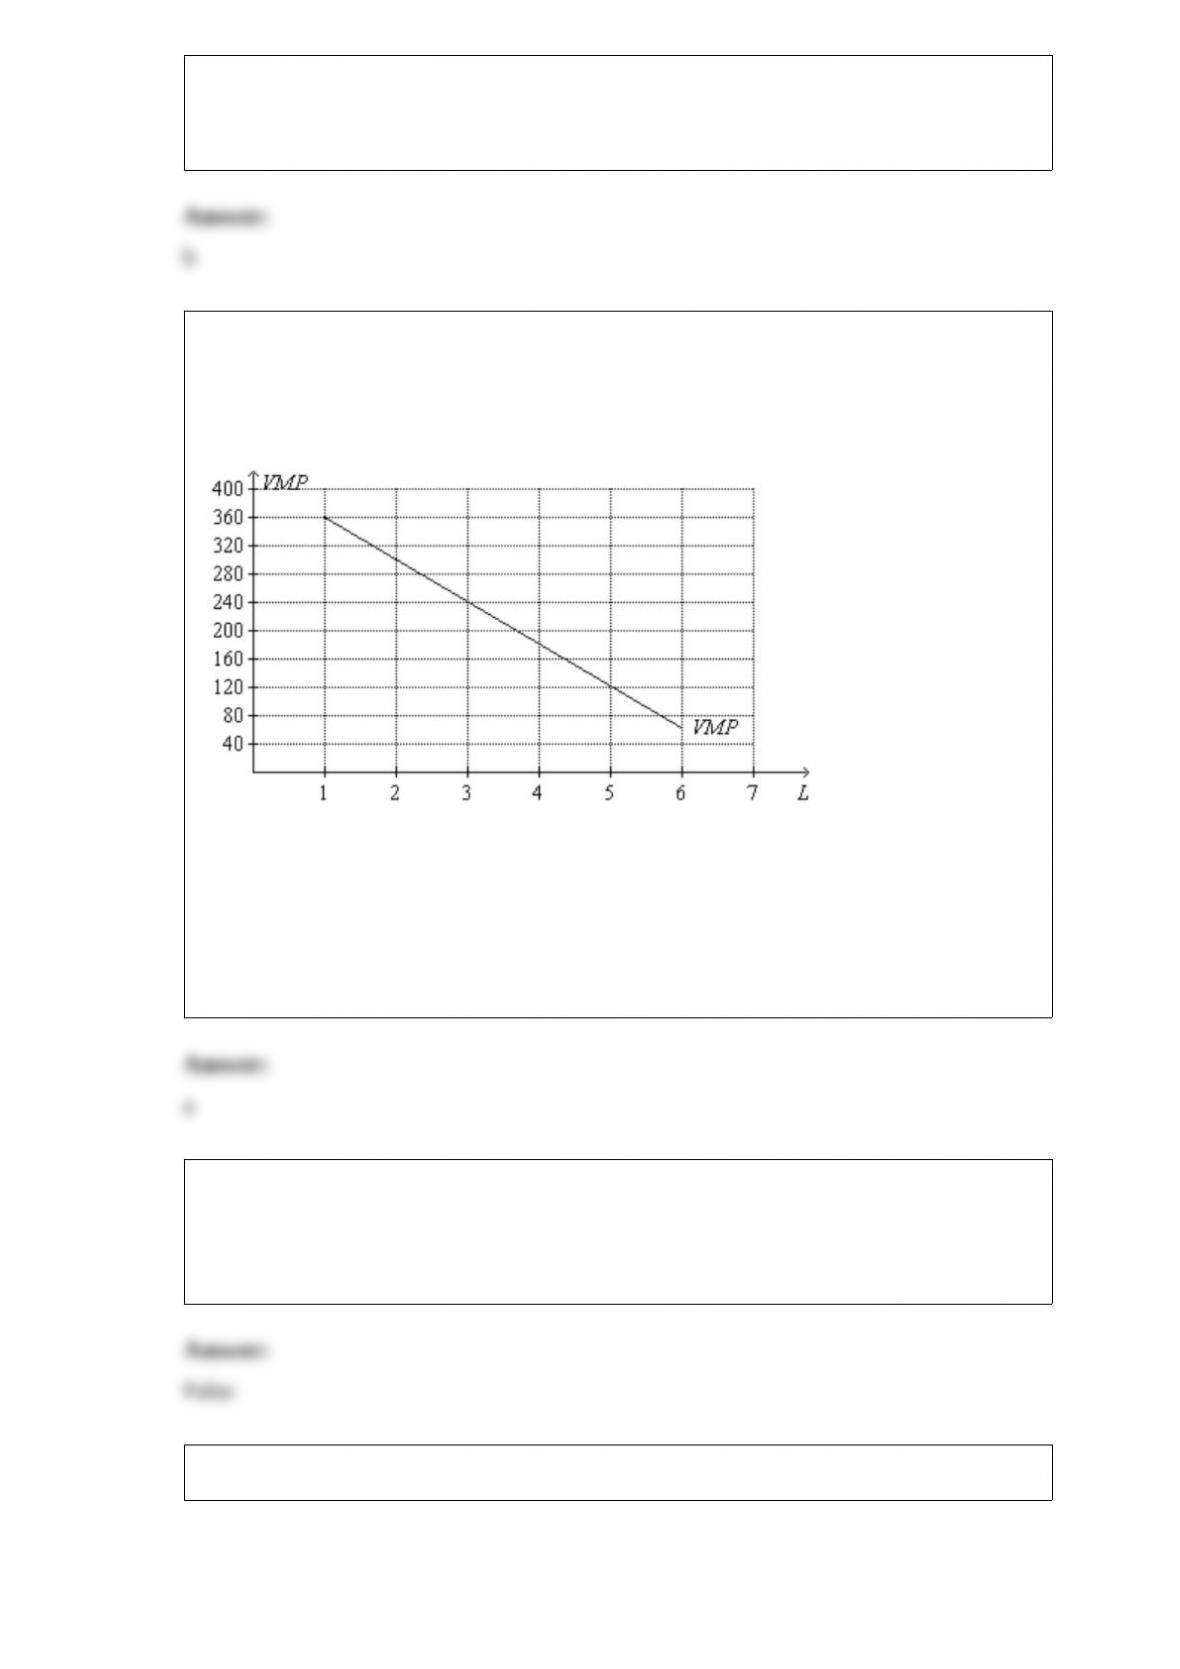
14) Figure 18-5
The figure shows a particular profitmaximizing, competitive firm’s valueofmarginal-
product (VMP) curve. On the horizontal axis, L represents the number of workers. The
time frame is daily.
Refer to Figure 18-5. Suppose the marginal product of the fifth unit of labor is 30 units
of output per day. The figure implies that the
a.price of output is $4.
b.price of output is $6.
c.price of output is $8.
d.daily wage is $120.
15) When the market price is above the equilibrium price, the quantity of the good
demanded exceeds the quantity supplied.
a.True
b.False
16)

Wh
ich of the following statements is correct?
a.Supply curve A is perfectly elastic.
b.Supply curve B is perfectly inelastic.
c.Supply curve C is more inelastic than supply curve D.
d.Supply curve D is unit elastic.