
Figure 5-3
The efficient output level is
A) Qm.
B) Q.
C) Qo.
D) Qo– Qm.
High-income countries have ________ and ________ as compared to developing
countries.
A) low rates of savings; high rates of growth
B) low rates of savings; low rates of growth
C) high rates of savings; high rates of growth
D) high rates of savings; low rates of growth
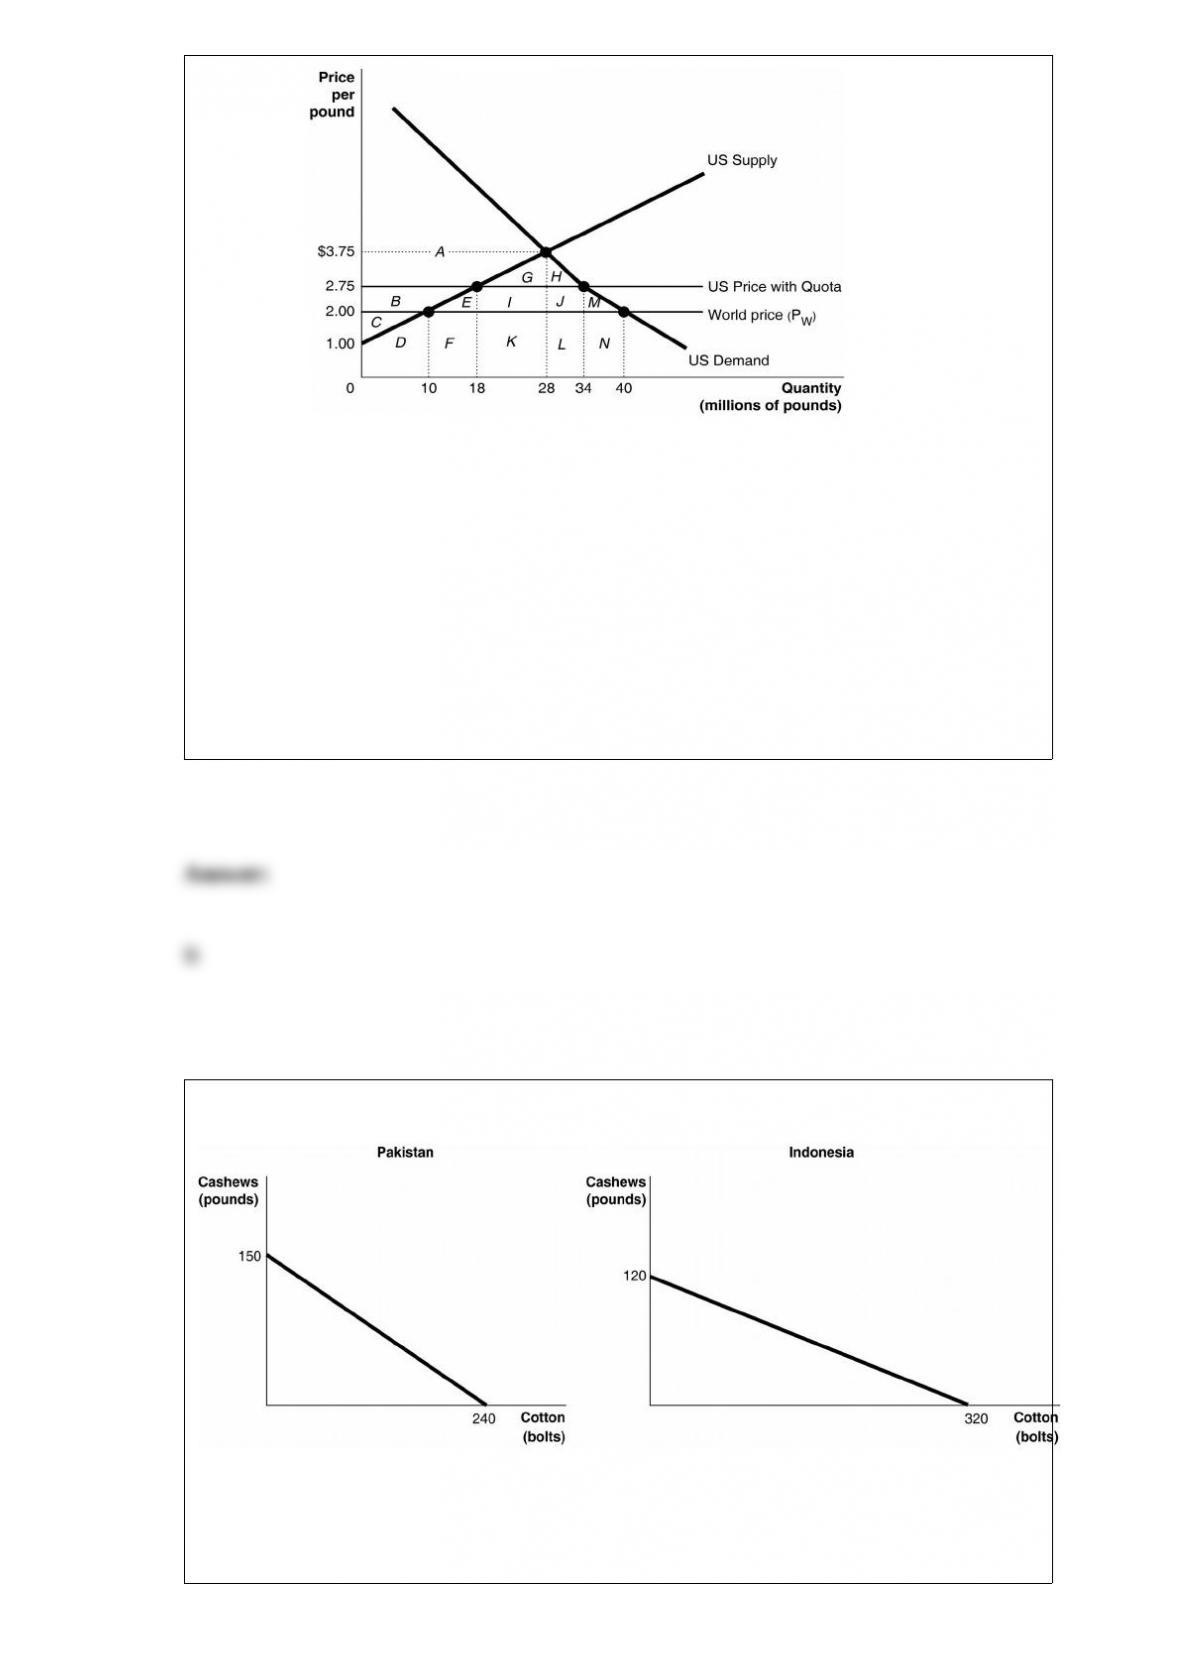
Figure 7-3 Since 1953 the
United States has imposed a quota to limit the imports of peanuts. Figure 7-3 illustrates
the impact of the quota. With a quota in place, what is the quantity supplied by
domestic producers?
A) 16 million pounds
B) 18 million pounds
C) 28 million pounds
D) 34 million pounds
Figure 2-9
Figure 2-9 shows the production possibilities frontiers for Pakistan and Indonesia. Each
country produces two goods, cotton and cashews. Which country has a comparative
advantage in the production of cotton?

A) Indonesia
B) They have equal productive abilities.
C) Pakistan
D) neither country
Suppose the Fed increases the money supply. Which of the following is true?
A) At the original interest rate, the quantity of money demanded is equal to the quantity
of money supplied.
B) At the original interest rate, the quantity of money demanded is less than the quantity
of money supplied.
C) At the original interest rate, the quantity of money demanded is greater than the
quantity of money supplied.
D) The interest rate must rise for the money market to clear.
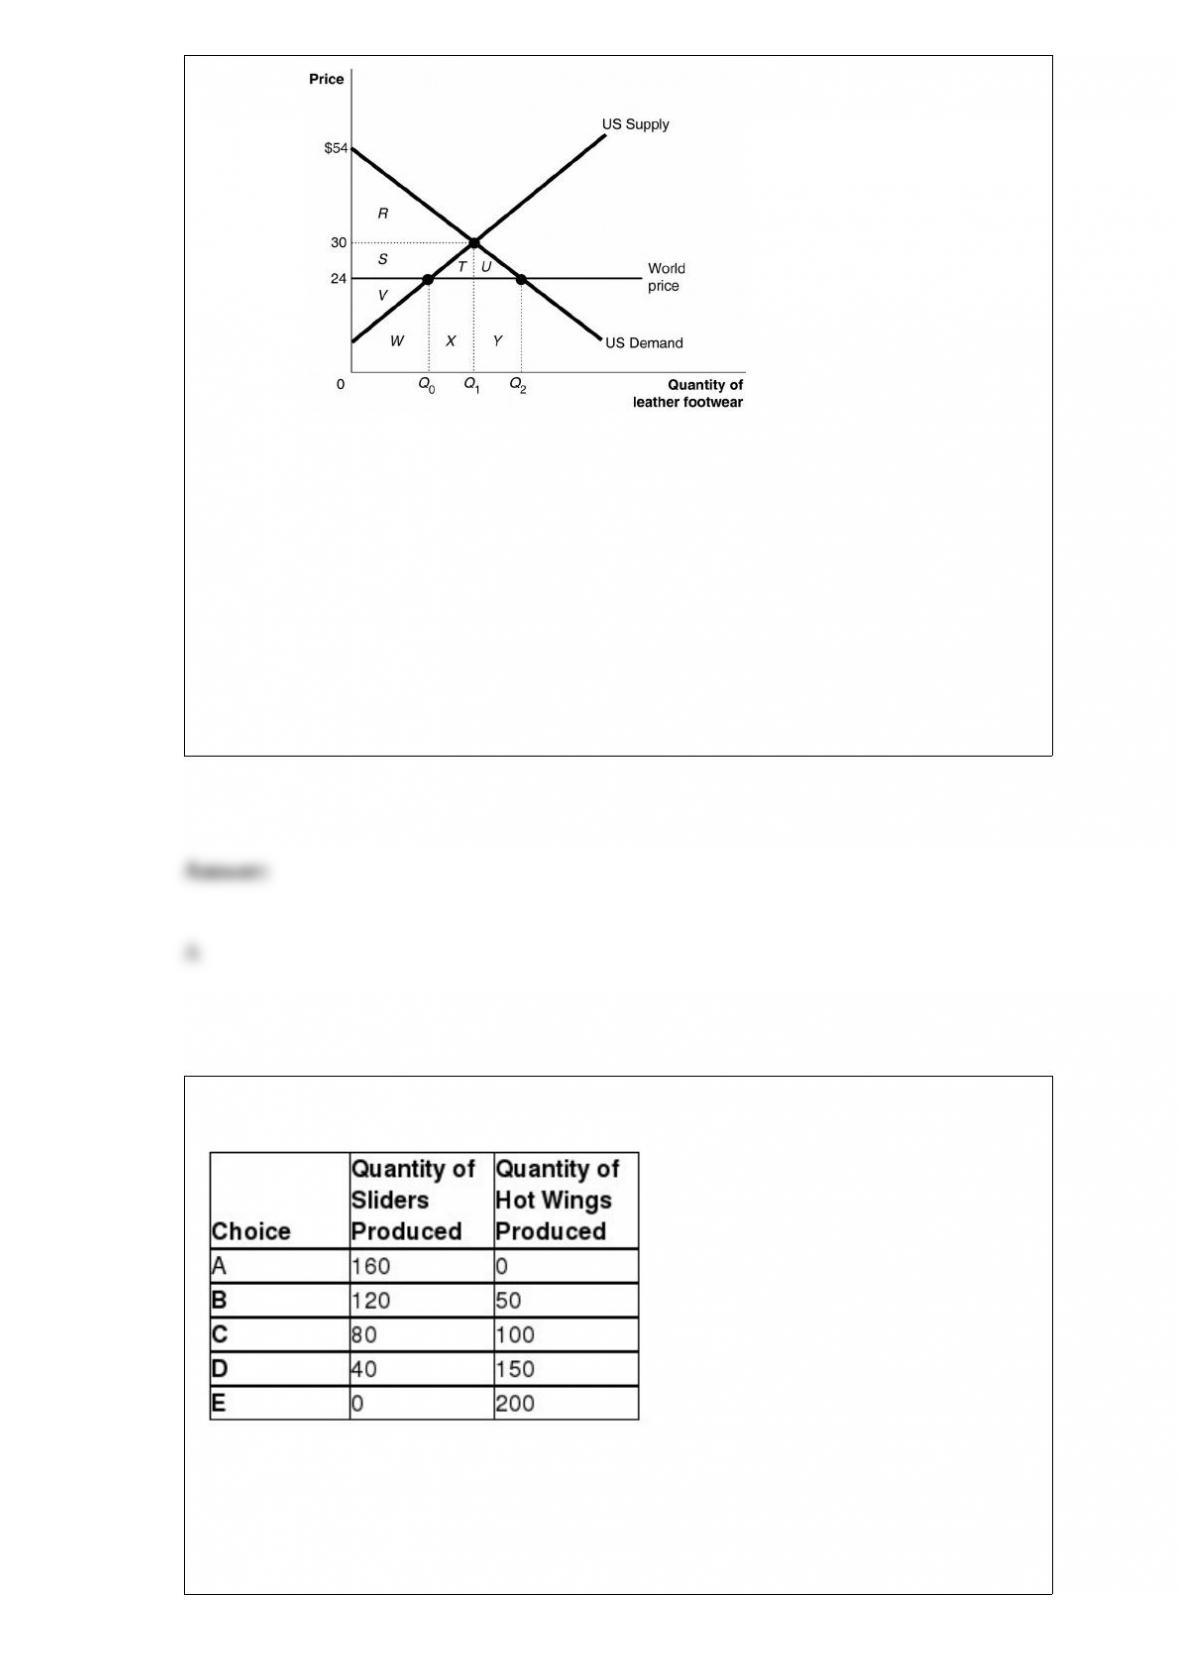
Figure 9-4 Figure 9-4 shows the U.S.
demand and supply for leather footwear.
Under autarky, the consumer surplus is area
A) R.
B) S.
C) R + S + V.
D) S + V.
Table 2-3 Production Choices for Dina’s Diner
Dina faces ________ opportunity costs in the production of sliders and hot wings.
A) increasing

B) decreasing
C) constant
D) negative
In the long run, a country will experience an increasing standard of living only if it
experiences
A) a high rate of consumption.
B) continuous technological change.
C) a high rate of labor force growth.
D) a slow rate of population growth.
Which of the following statements is true?
A) In general, if a product has few substitutes it will have an elastic demand.
B) The more time that passes, the more inelastic the demand for a product becomes.
C) The demand curve for a necessity is more elastic than the demand curve for a luxury.
D) The more narrowly we define a market, the more elastic the demand for a product
will be.

What is allocative efficiency?
A) It refers to a situation in which resources are allocated to their highest profit use.
B) It refers to a situation in which resources are allocated such that goods can be
produced at their lowest possible average cost.
C) It refers to a situation in which resources are allocated such that the last unit of
output produced provides a marginal benefit to consumers equal to the marginal cost of
producing it.
D) It refers to a situation in which resources are allocated fairly to all consumers in a
society.
Comparative advantage means the ability to produce a good or service
A) at a lower selling price than any other producer.
B) at a lower opportunity cost than any other producer.
C) of a higher quality than any other producer.
D) at a higher profit level than any other producer.

Table 16-3
Julie plans to start a pet-sitting service. She surveyed her neighborhood to determine the
demand for this service. Assume that each person surveyed demands only one hour of
pet sitting services per period. Table 16-3 above shows a portion of her survey results.
Suppose Julie’s marginal cost of providing this service is constant at $7 and she charges
each customer according to his or her willingness to pay instead of a uniform price of
$7. Which of the following statements is true?
A) Julie is worse off because the demand for her services is reduced.
B) Julie has converted the consumer surplus (from a uniform price) into economic
profit.
C) Julie’s customers are better off because their consumer surplus has increased.
D) Julie’s has converted the producer surplus (from a uniform price) into consumer
surplus.
Economists have long debated whether there is a significant loss of well-being to
society in markets that are monopolistically competitive rather than perfectly
competitive. Which of the following offers the best reason why some economists
believe that monopolistically competitive markets are less efficient than perfectly
competitive markets?
A) In contrast to perfectly competitive markets, neither allocative efficiency nor
productive efficiency are achieved in monopolistically competitive markets.
B) In contrast to perfectly competitive markets, firms in monopolistically competitive
markets earn economic profits in long-run equilibrium.
C) In contrast to perfectly competitive markets, firms in monopolistically competitive
markets do not produce where price equals average total cost in long-run equilibrium.
D) In contrast to perfectly competitive markets, firms in monopolistically competitive
markets can charge a price greater than average total cost in the short run.
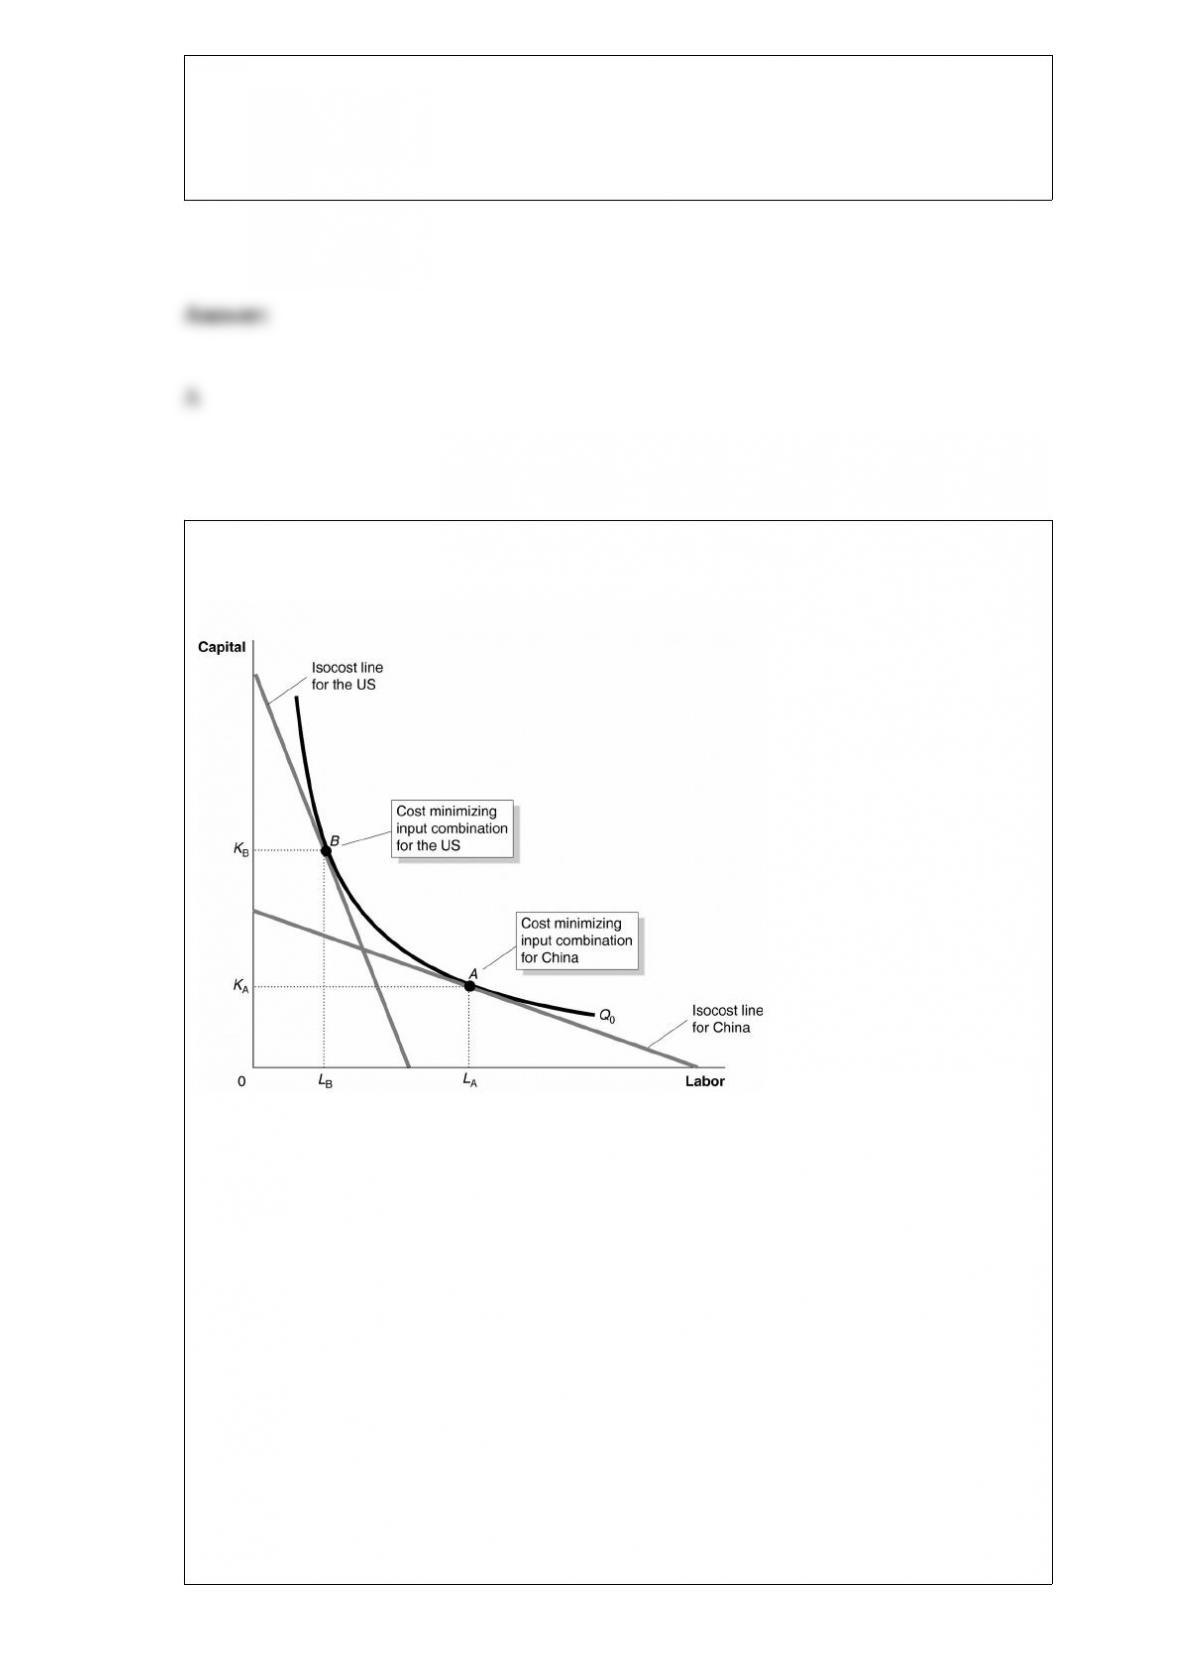
Figure 11-14
Figure 11-14 shows the
optimal input combinations for the production of a given quantity of cotton in the
United States and in China.
Consider the following statements:
a. For each country, the marginal product per dollar spent on labor equals to the
marginal product per dollar spent on capital.
b. The price of labor is relatively higher in the United States than in China and the price
of capital is relatively lower in the United States than in China.
c. The price of labor and the price of capital are relatively higher in the United States
than in China. Based on the figure, which of the statements above is true?
A) All of the statements are true.

B) statements a and c only
C) statements a and b only
D) statements b and c only
In a market economy, the high salaries of some star baseball players such as Zach
Greinke, are determined by
A) team owners, based on the total number of star athletes they plan to hire.
B) advertising companies, based on what they are willing to pay to advertise their
products at baseball games.
C) the interaction of the demand for star athletes and the supply of star athletes.
D) consumers, based on their willingness to watch baseball games.
Figure 22-3
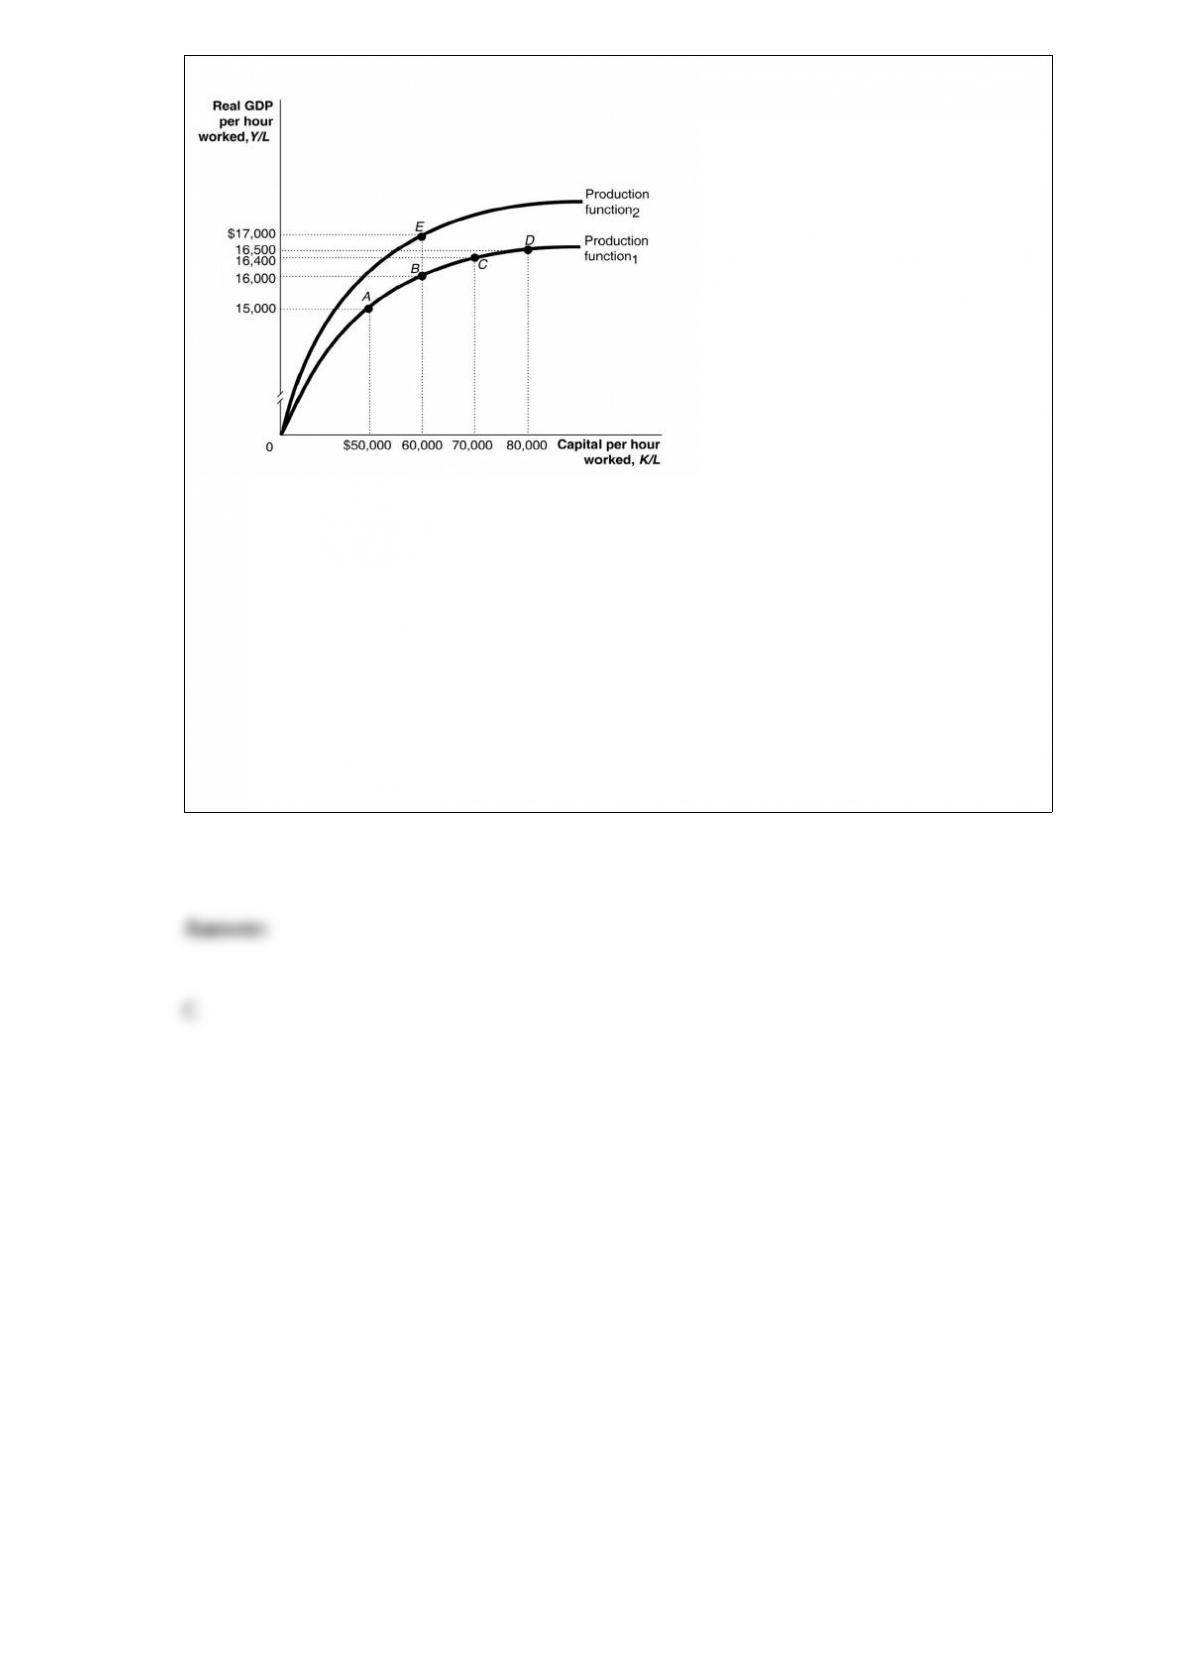
Which of the following would cause an economy to move from a point like A in the
figure above to a point like B?
A) an improvement in technology
B) a decrease in capital per hour worked
C) an increase in capital per hour worked
D) a technological regression