1) Let L represent the number of workers hired by a firm, and let Q represent that firm’s
quantity of output. Assume two points on the firm’s production function are (L = 12, Q
= 122) and (L = 13, Q = 130). Then the marginal product of the 13th worker is
a.8 units of output.
b.10 units of output.
c.122 units of output.
d.132 units of output.
2) An increase in the price of a product and an increase in the number of sellers in the
market affect the supply curve in the same general way.
a.True
b.False
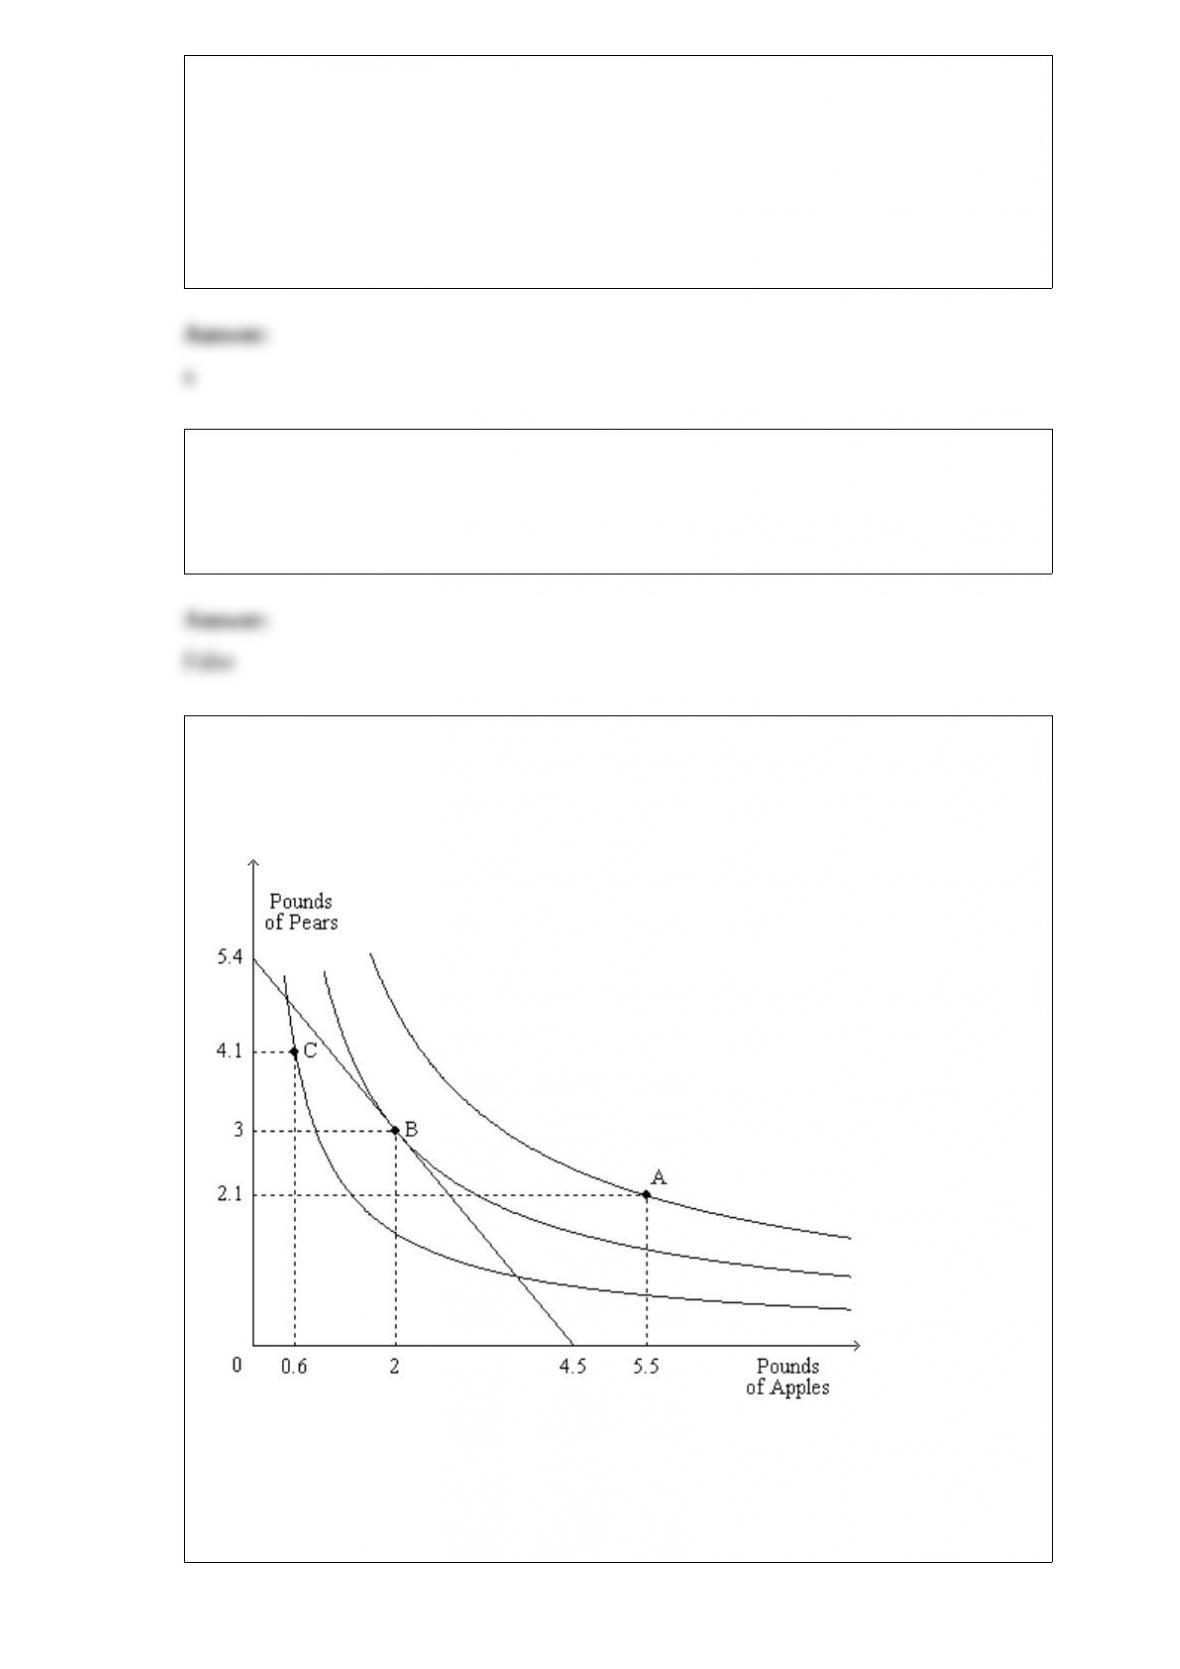
3) Figure 21-24
The figure shows three indifference curves and a budget constraint for a certain
consumer named Steve.
Refer to Figure 21-24. At his optimum, Steve is willing to give up about
a.0.75 pounds of pears for 1 pound of apples.
b.0.75 pounds of apples for 1 pound of pears.
c.1.20 pounds of pears for 1 pound of apples.
d.1.20 pounds of apples for 1 pound of pears.
4) Which of the following is not an example of capital used in production?
a.a teacher’s chalkboard
b.a manufacturer’s factory
c.a landscaper’s time
d.an accountant’s education
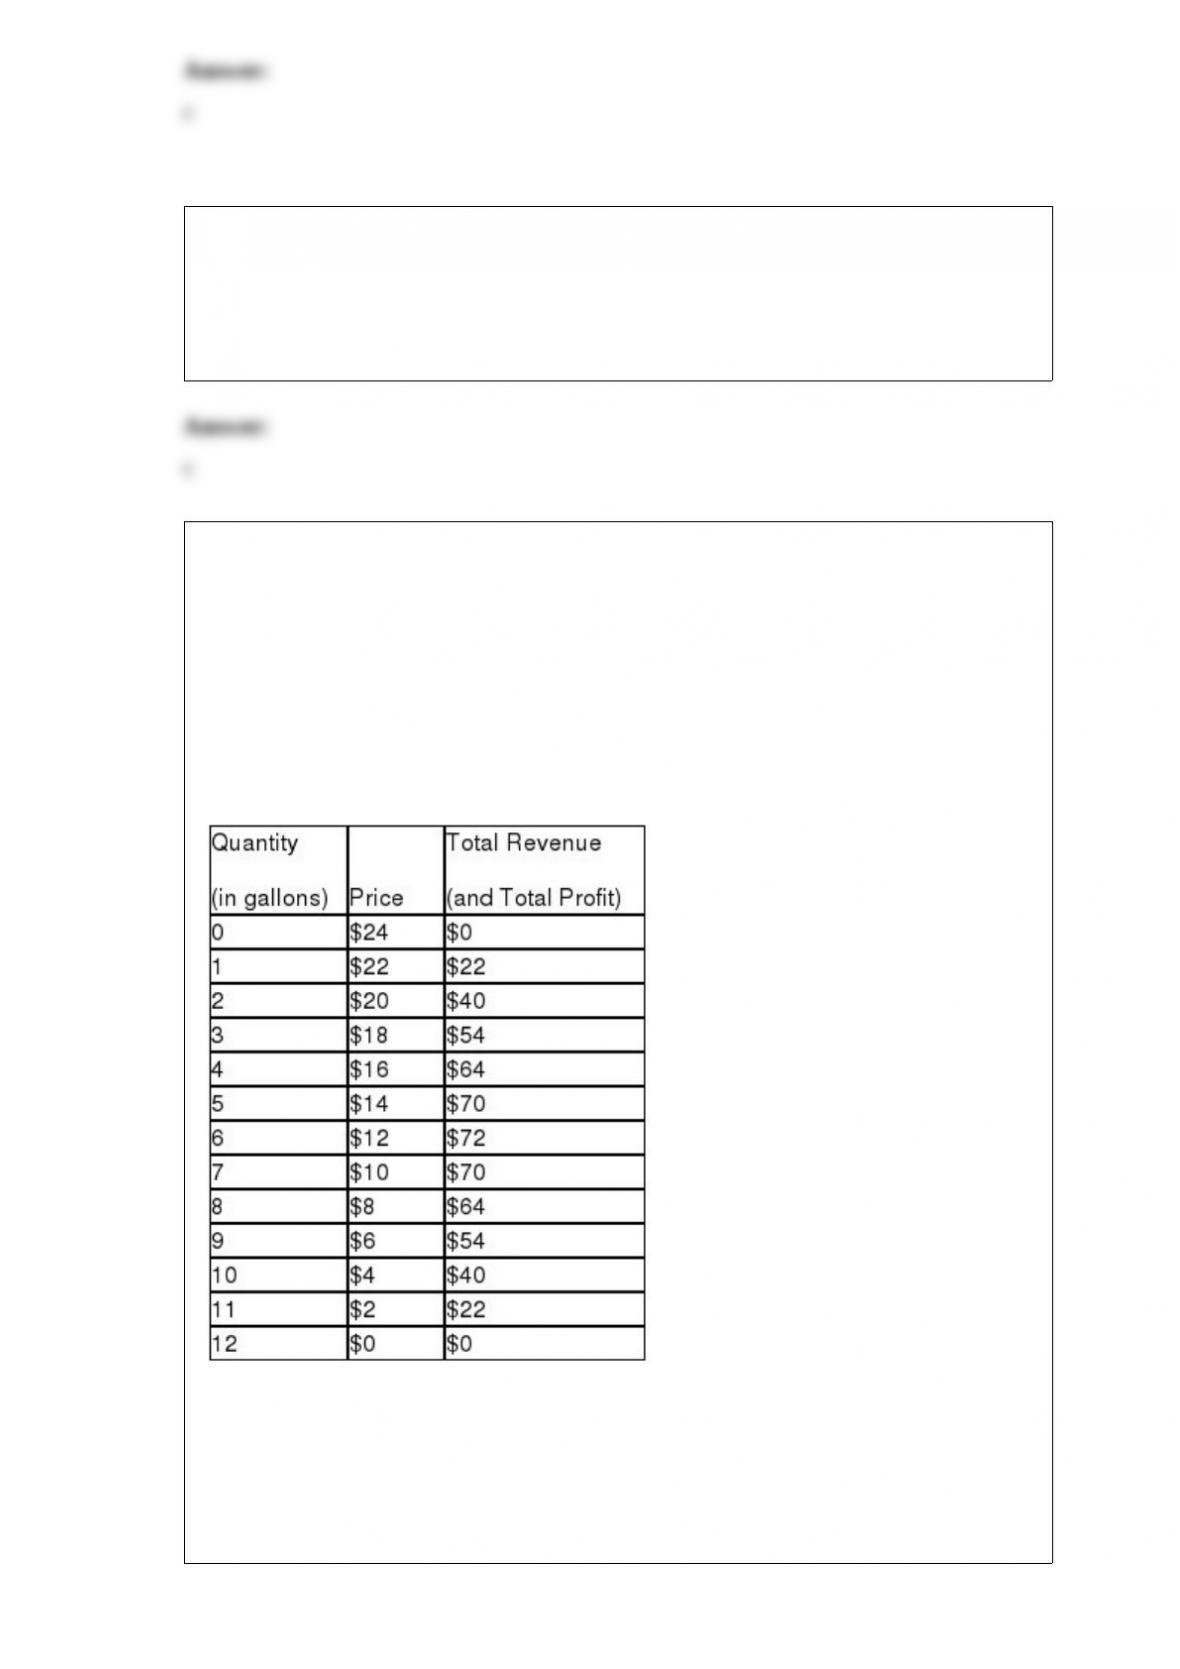
5) Table 17-3
Imagine a small town in a remote area where only two residents, Maria and Miguel,
own dairies that produce milk that is safe to drink. Each week Maria and Miguel work
together to decide how many gallons of milk to produce. They bring milk to town and
sell it at whatever price the market will bear. To keep things simple, suppose that Maria
and Miguel can produce as much milk as they want without cost so that the marginal
cost is zero. The weekly town demand schedule and total revenue schedule for milk is
shown in the table below:
Refer to Table 17-3. Suppose that Maria and Miguel work together in order to operate
as a profit-maximizing monopolist. What price will they charge for milk?
a.$14
b.$12
c.$10
d. $8
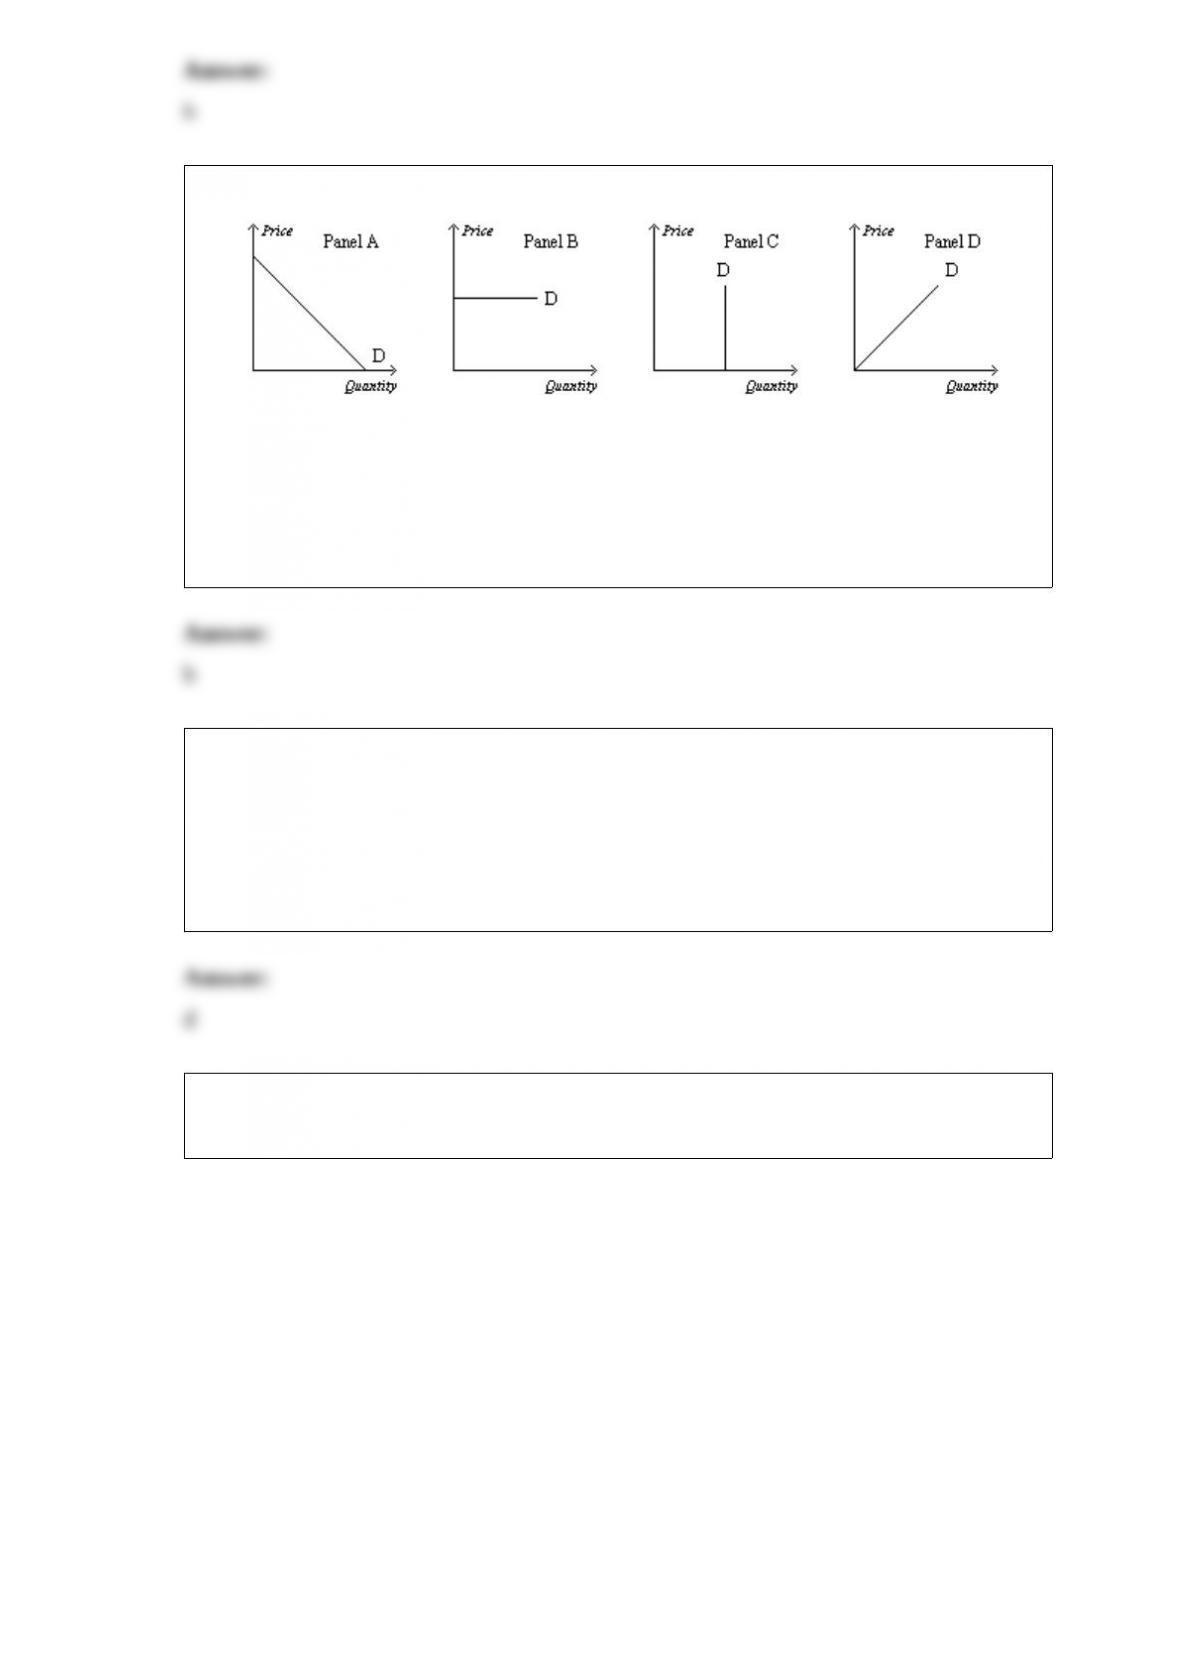
6) Figure 15-3
Which of the following statements is correct?
a.Panel B represents the typical demand curve for a perfectly competitive industry.
b.Panel A represents the typical demand curve for a monopoly.
c.Panel C represents the typical demand curve for a perfectly competitive firm.
d.All of the above are correct.
7) Which of the following could be the for a good for which an increase in price would
decrease revenue?
a.0.6
b.0.9
c.1
d.2.6
8) Figure 16-10
The figure is drawn for a monopolistically-competitive firm.
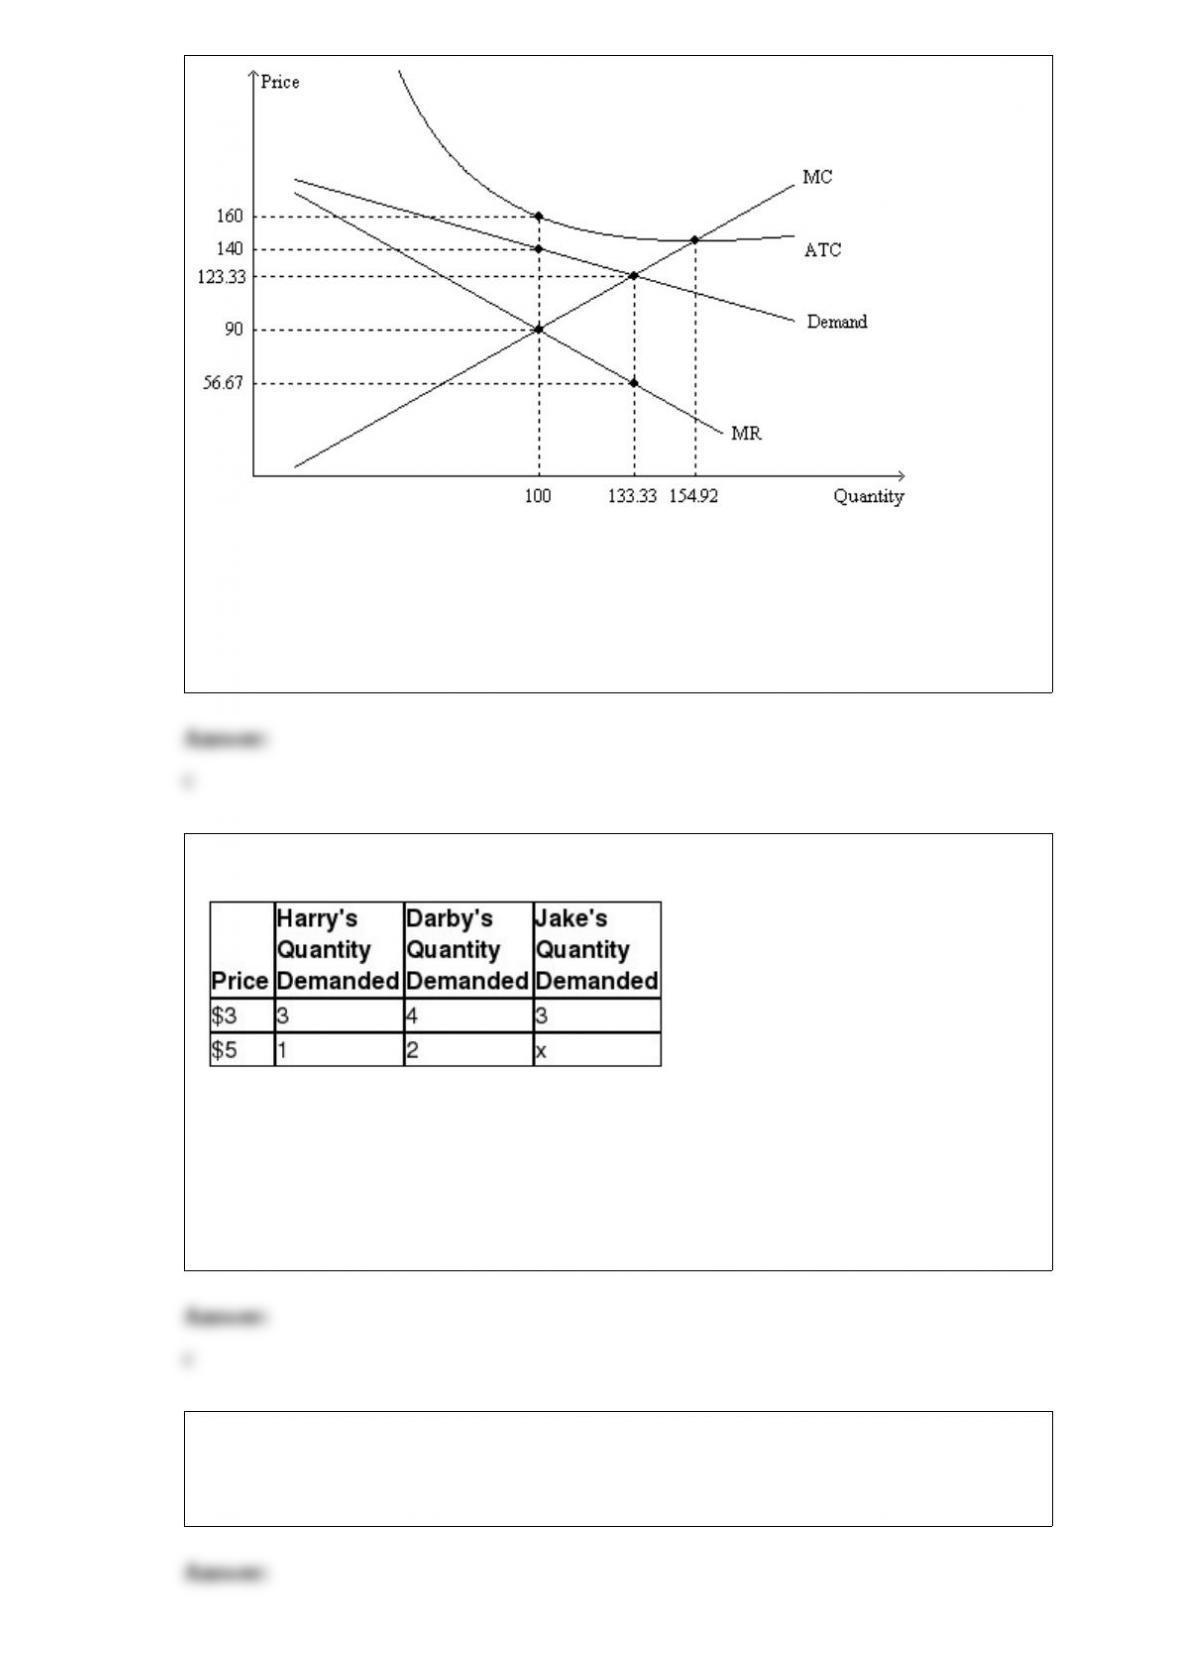
At what quantity of output does average revenue exceed marginal revenue by $66.66?
a.at 100 units of output
b.somewhere between 100 and 133.33 units of output
c.at 133.33 units of output
d.at 154.92 units of output
9) The demand schedule below pertains to sandwiches demanded per week.
Regarding Harry and Darby, whose demand for sandwiches conforms to the law of
demand?
a.only Harry’s
b.only Darby’s
c.both Harry’s and Darby’s
d.neither Harry’s nor Darby’s
10) Variable costs usually change as the firm alters the quantity of output produced.
a.True
b.False