
Which of the following questions is more likely to be studied by a microeconomist than
a macroeconomist?
a. Why do prices in general rise by more in some countries than in others?
b. Why do wages differ across industries?
c. Why do national production and income increase in some periods and not in others?
d. How rapidly is GDP currently increasing?
The income elasticity of demand for caviar tends to be
a. high because caviar is relatively expensive.
b. low because caviar is packaged in small containers.
c. high because buyers generally feel that they can do without it.
d. low because it is almost always in short supply.
Figure 82
The vertical distance between points A and B represents a tax in the market.
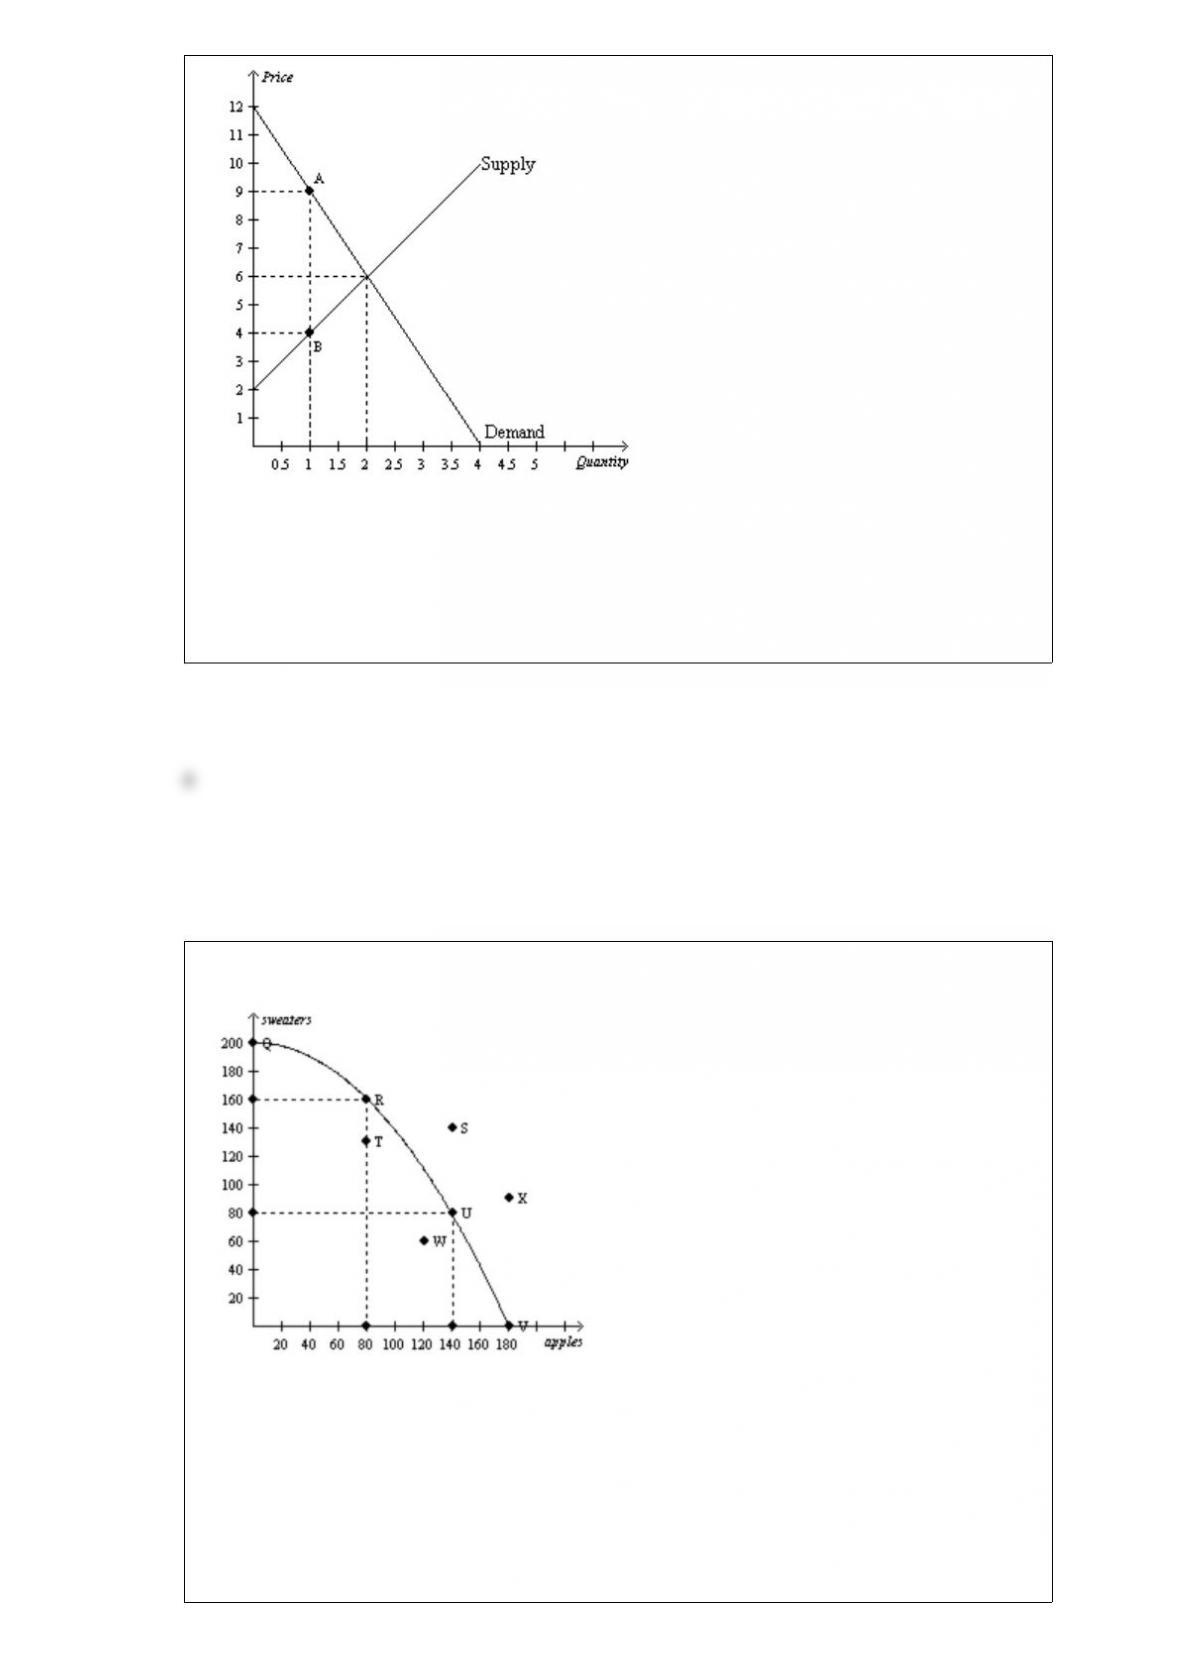
Refer to Figure 82. The amount of deadweight loss as a result of the tax is
a. $2.50.
b. $5.
c. $7.50.
d. $10.
Figure 214
Consider the production possibilities curve for a country that can produce sweaters,
apples (in bushels), or a combination of the two
Refer to Figure 214. Which combination of points show production possibilities only
achievable with improvements in technology or increases in resources?
a. Q, R, U, and V
b. S and X
c. T and W
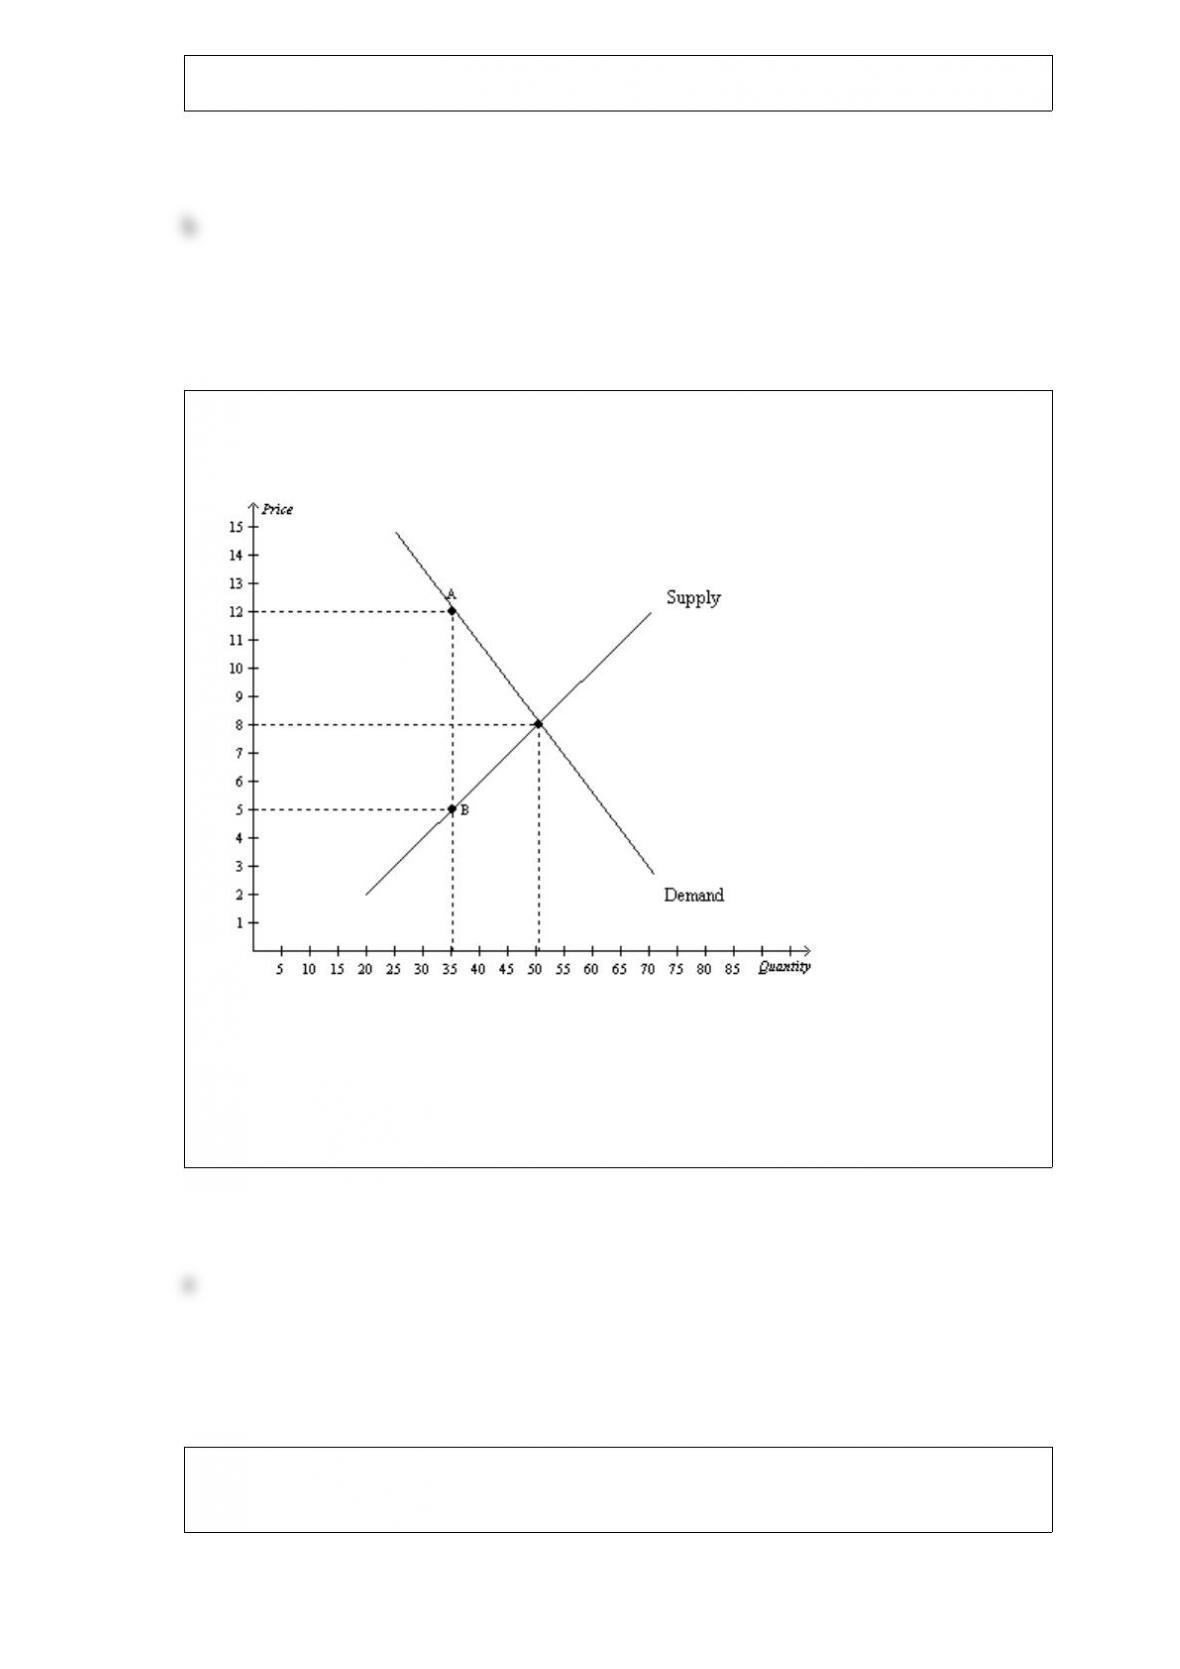
d. None of the above is correct.
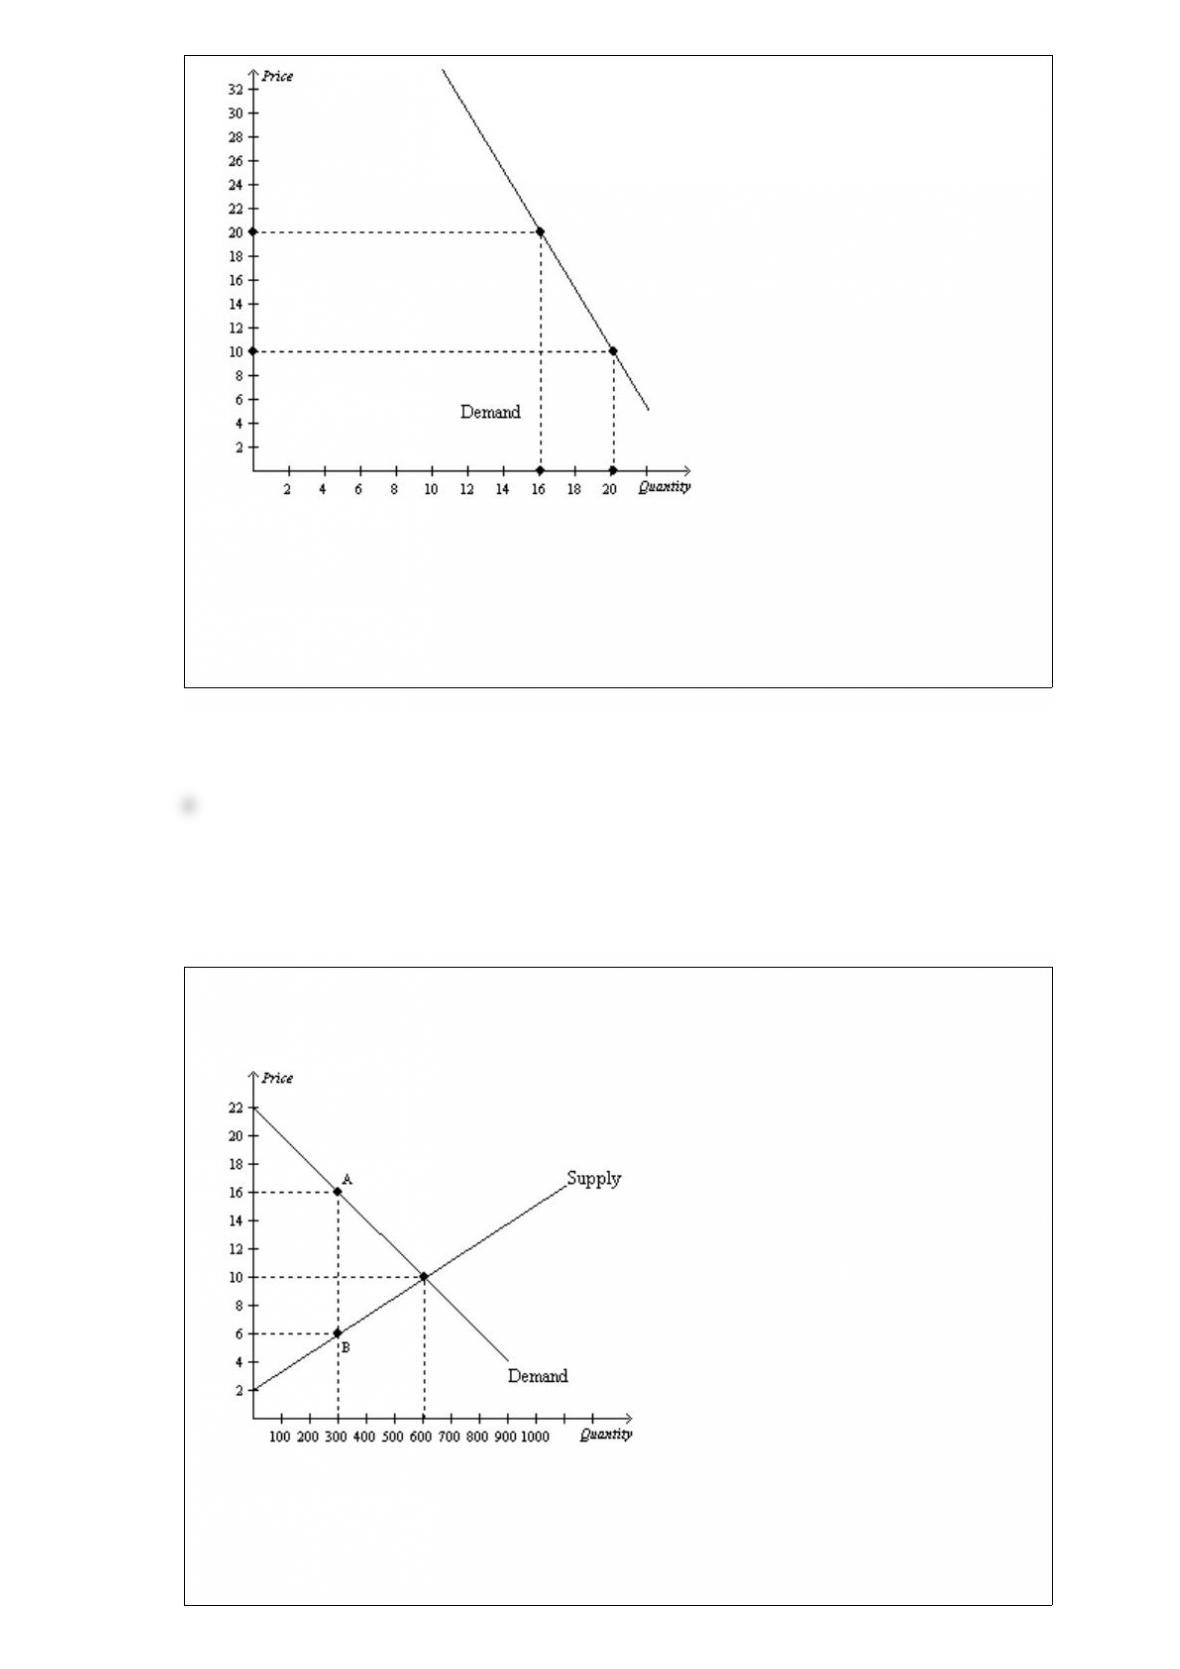
Figure 84
The vertical distance between points A and B represents a tax in the market.
Refer to Figure 84. The price that buyers effectively pay after the tax is imposed is
a. $12.
b. between $8 and $12.
c. between $5 and $8.
d. $5.
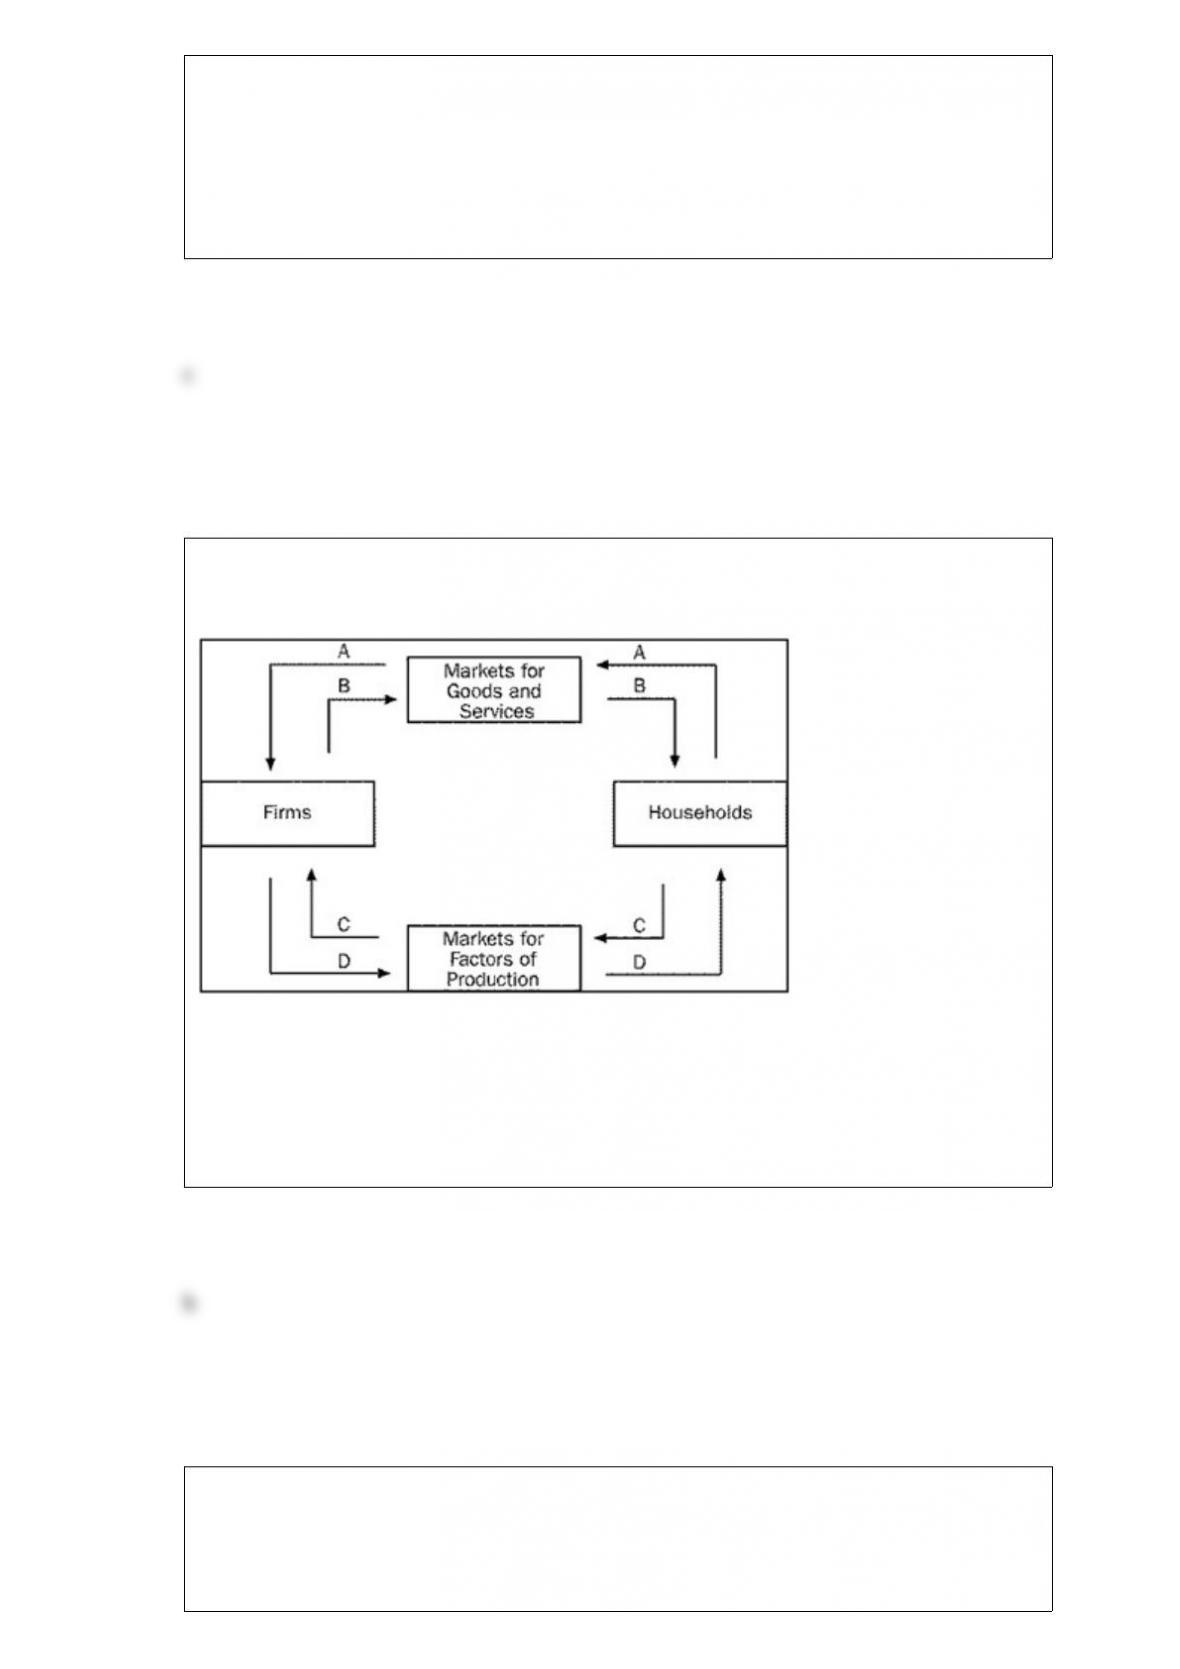
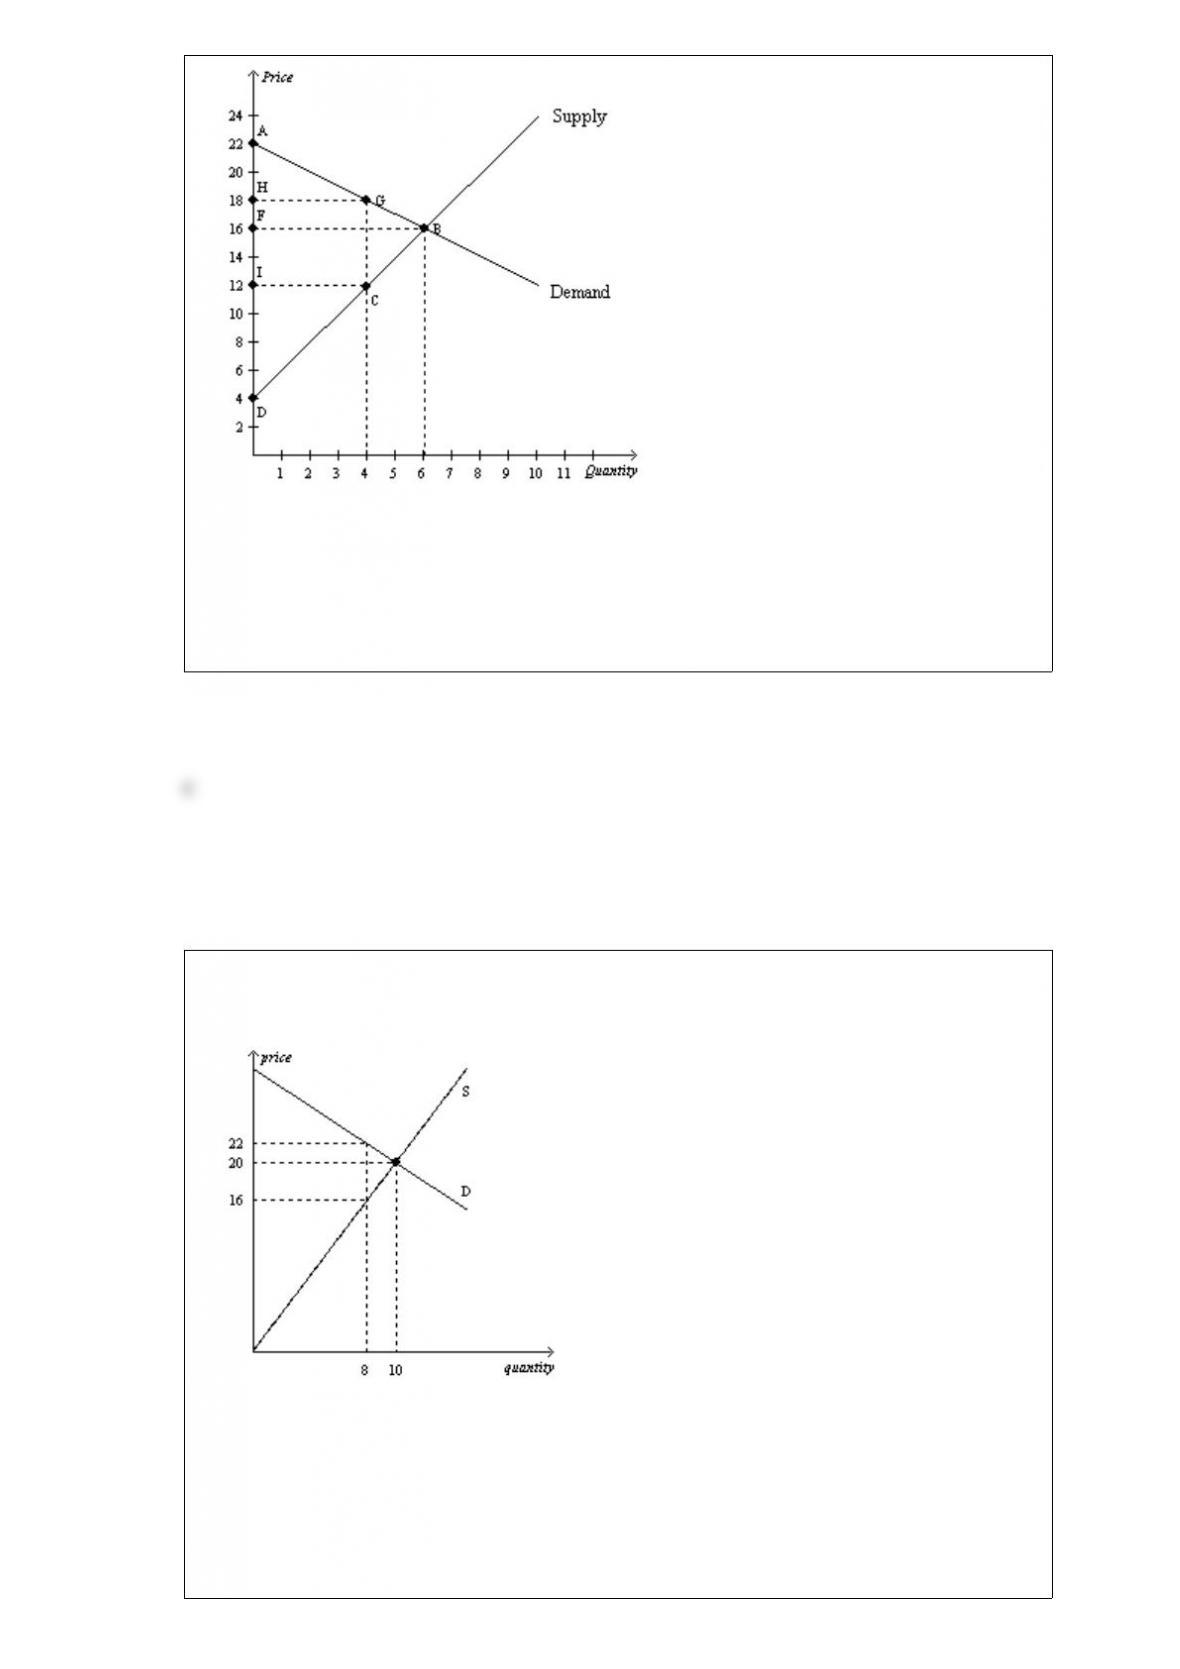
Figure 511
Refer to Figure 511. If price increases from $10 to $20, total revenue will
a. increase by $120, so demand must be inelastic in this price range.
b. increase by $320, so demand must be inelastic in this price range.
c. decrease by $120, so demand must be elastic in this price range.
d. decrease by $320, so demand must be elastic in this price range.
Figure 86
The vertical distance between points A and B represents a tax in the market.
Refer to Figure 86. The amount of the tax on each unit of the good is
a. $6.
b. $8.
c. $10.

d. $12.
Rent control
a. is an example of a price ceiling.
b. leads to a larger shortage of apartments in the long run than in the short run.
c. leads to lower rents and, in the long run, to lowerquality housing.
d. All of the above are correct.
If the government levies a $500 tax per car on sellers of cars, then the price received by
sellers of cars would
a. decrease by less than $500.
b. decrease by exactly $500.
c. decrease by more than $500.
d. increase by an indeterminate amount.
Table 334
Assume that Indonesia and India can switch between producing rice and bananas at a
constant rate.
Labor Hours Needed to Make 1 Unit ofNumber of Units Produced in 40 Hours
RiceBananasRiceBananas
Indonesia25208
India421020
Refer to Table 334. At which of the following prices, if any, can India and Indonesia
both gain from trade?
a. 1/5 units of bananas per unit of rice.
b. 1/3 units of bananas per unit of rice.
c. 3/5 units of bananas per unit of rice.
d. None of the above.
Figure 21
Refer to Figure 21. Raymond buys a refrigerator for his new home. To which of the
arrows does this transaction directly contribute?
a. A only
b. A and B
c. C only
d. C and D
Rational people make decisions “at the margin” by comparing
a. average costs and benefits.
b. total costs and benefits.
c. additional costs and benefits.
d. opportunity costs and benefits.
Table 323
Assume that the farmer and the rancher can switch between producing pork and
producing tomatoes at a constant rate.
Labor Hours Needed to Make 1 Pound of Pounds Produced in 24 Hours
PorkTomatoesPorkTomatoes
Farmer6348
Rancher4466
Refer to Table 323. The rancher has a comparative advantage in the production of
a. pork.
b. tomatoes.
c. both goods.
d. neither good.
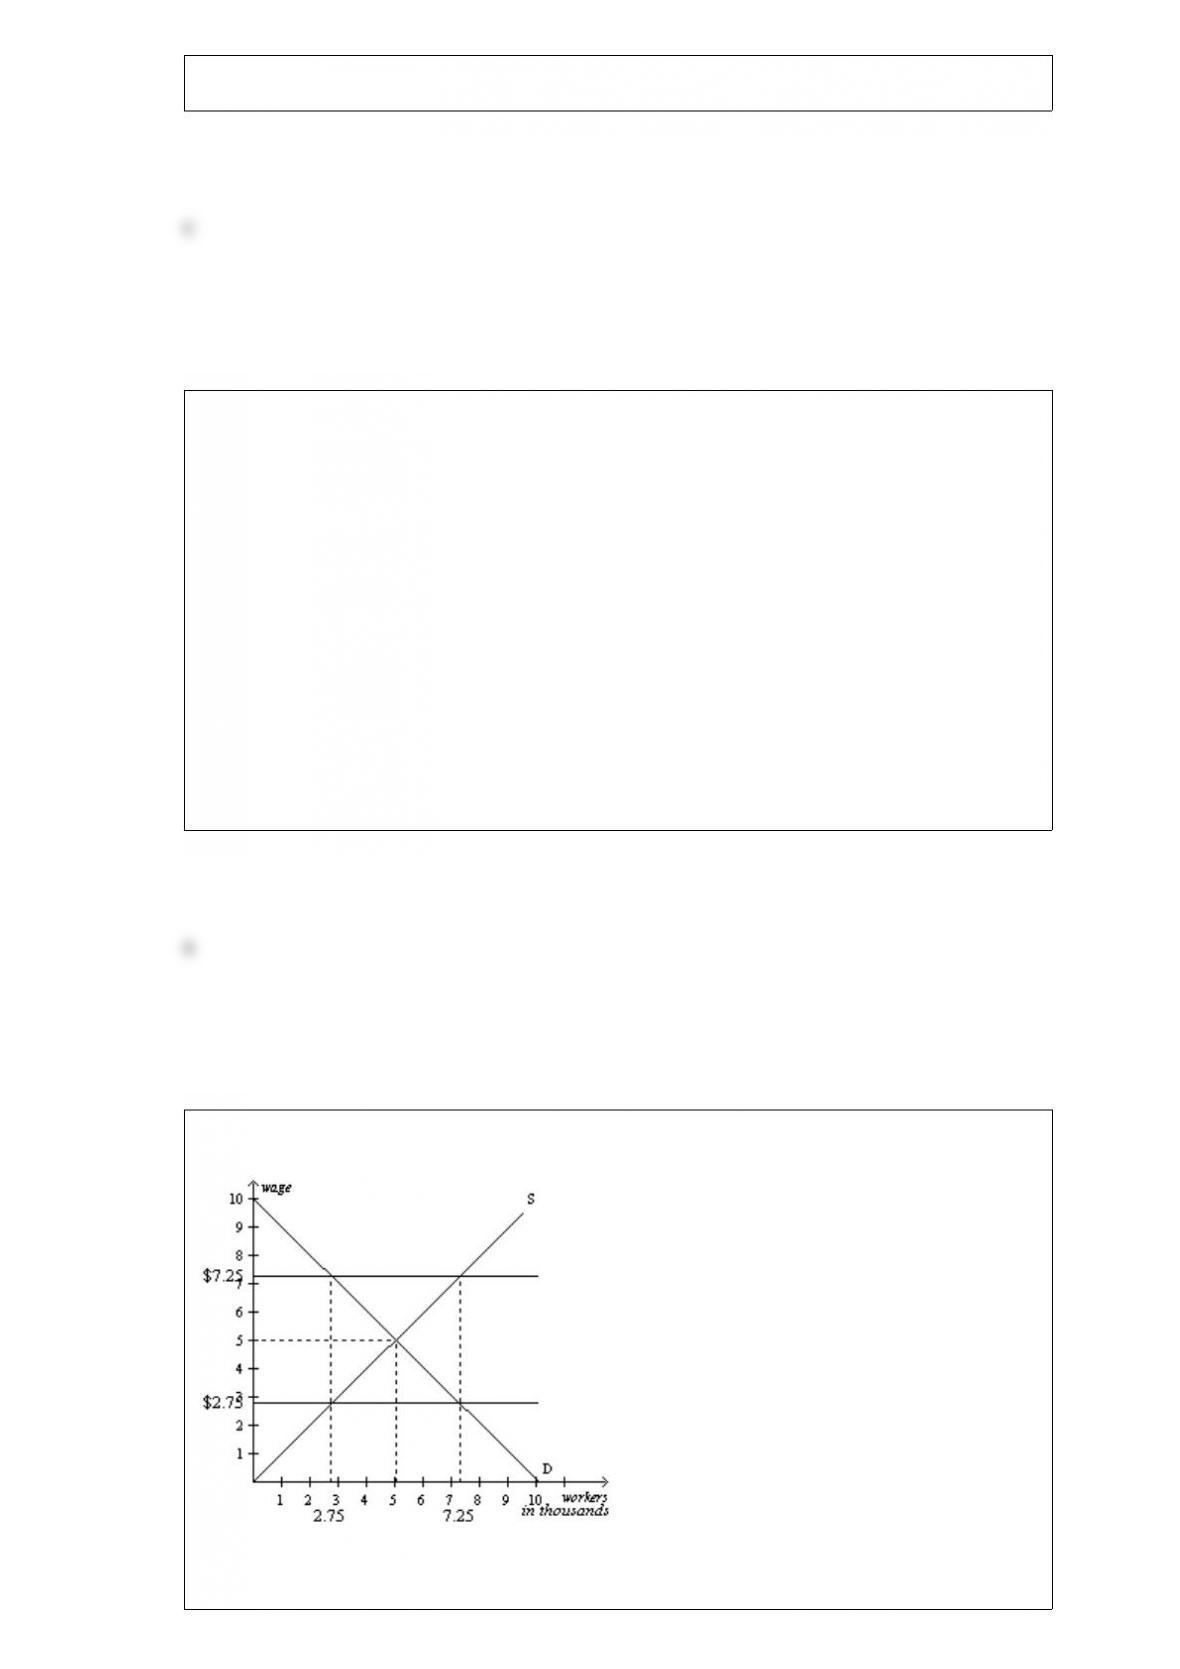
Figure 616
Refer to Figure 616. In this market, a minimum wage of $7.25 creates a labor
a. shortage of 2,250 workers.
b. shortage of 4,500 workers.
c. surplus of 2,250 workers.
d. surplus of 4,500 workers.
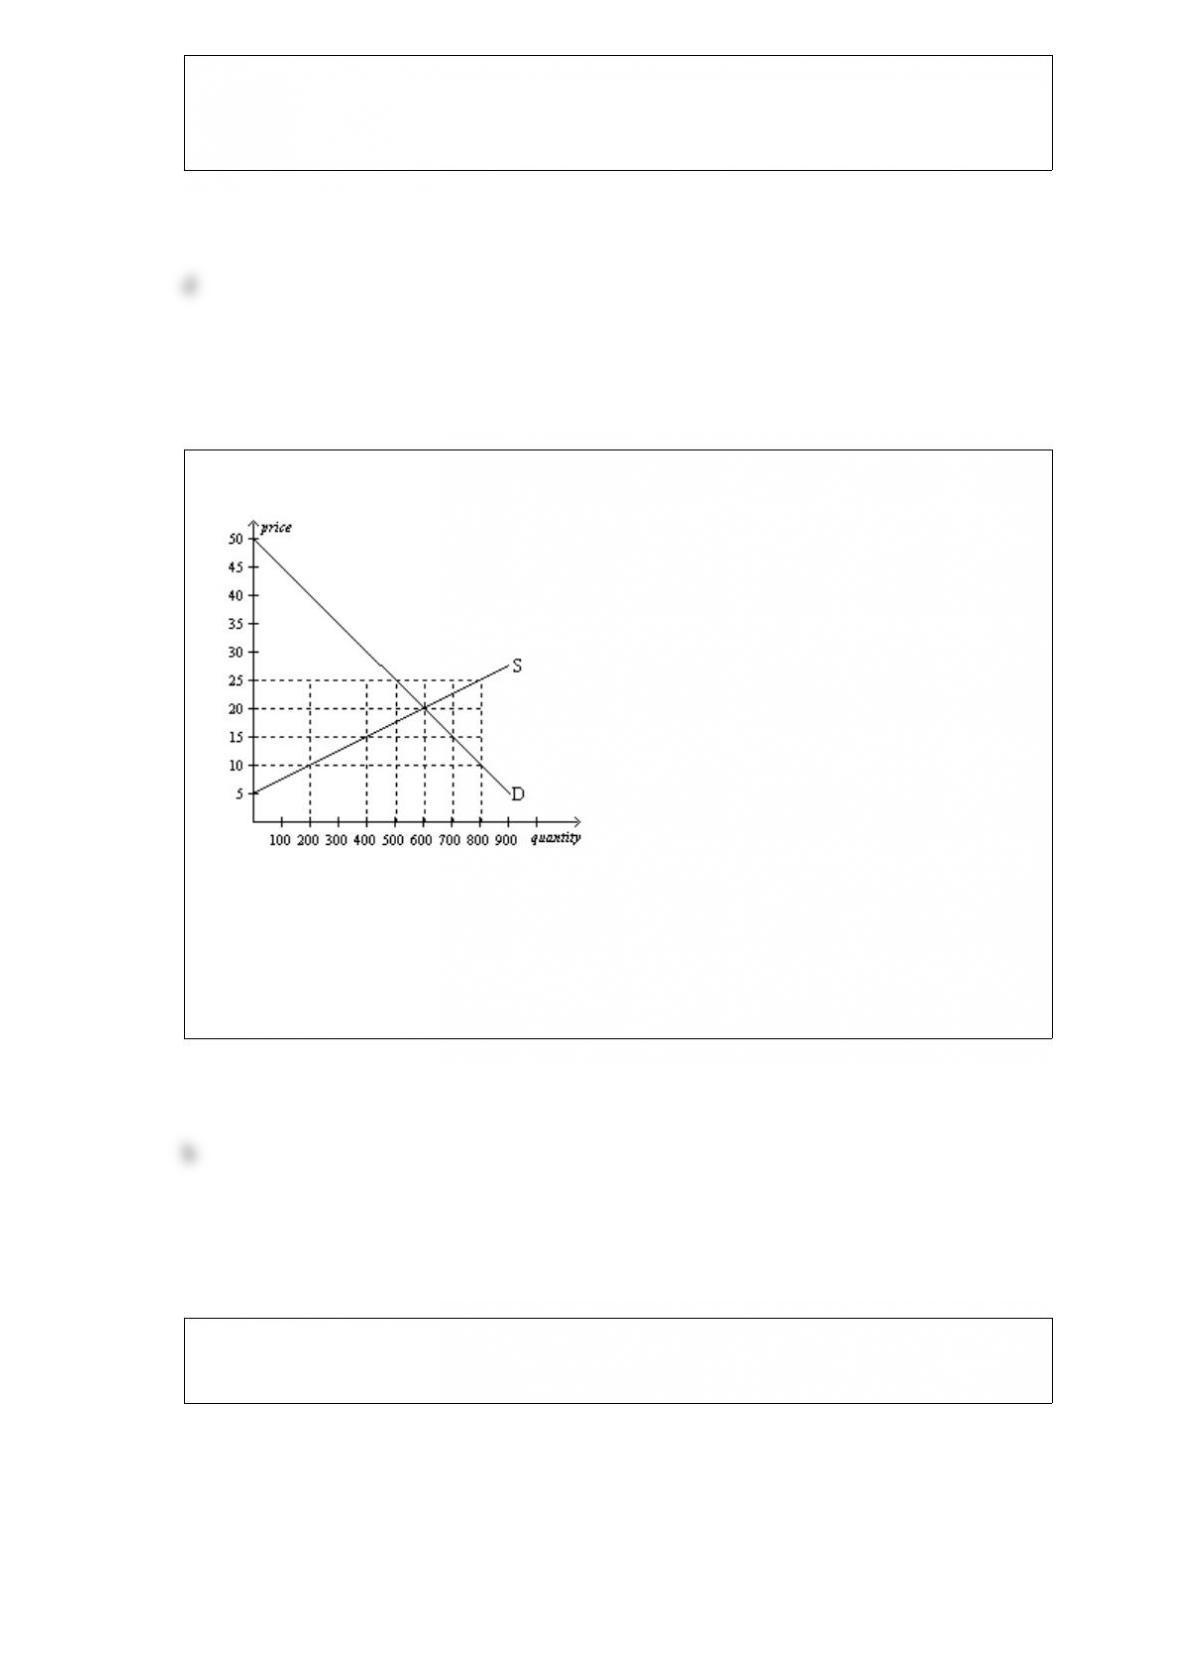
Figure 420
Refer to Figure 420. If the price is $25, then there would be an excess
a. supply of 100 units, and price would fall.
b. supply of 300 units, and price would fall.
c. demand of 100 units, and price would fall.
d. demand of 300 units, and price would fall.
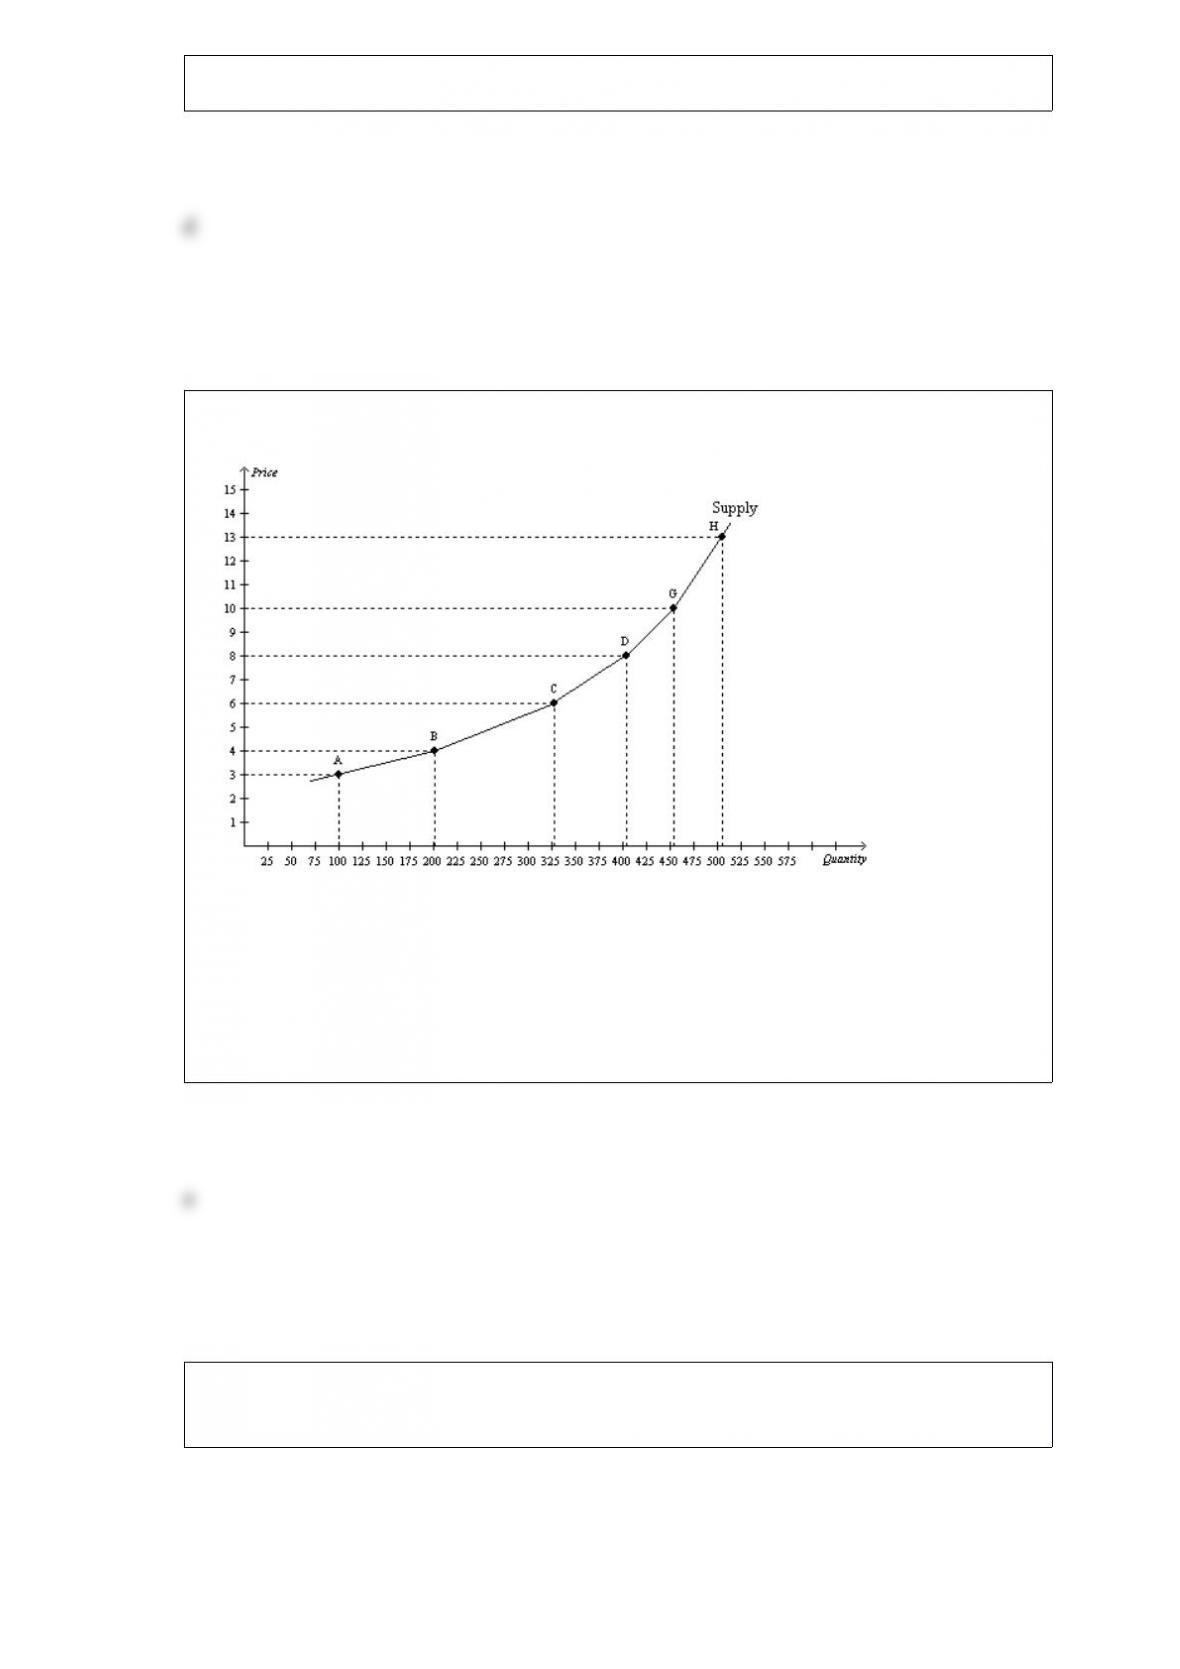
Figure 814
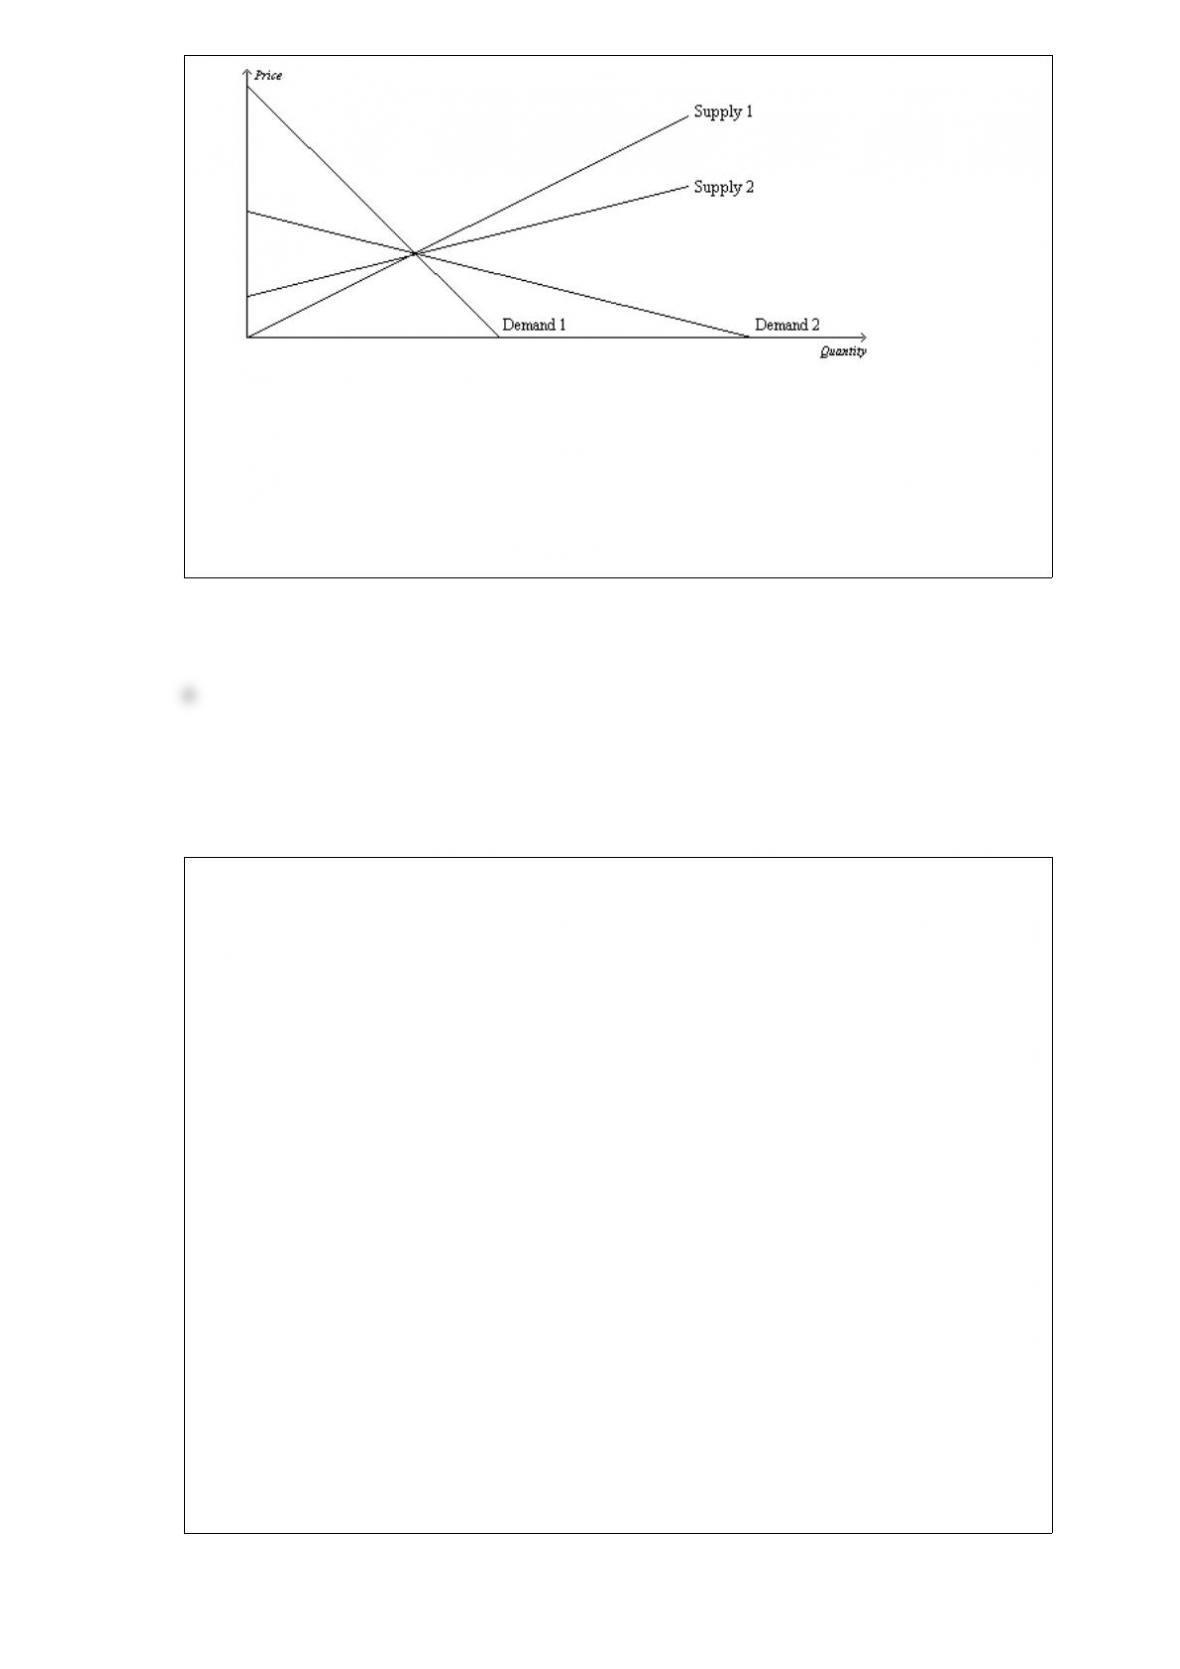
Refer to Figure 814. Which of the following combinations will minimize the
deadweight loss from a tax?
a. supply 1 and demand 1
b. supply 2 and demand 2
c. supply 1 and demand 2
d. supply 2 and demand 1
Table 712
The numbers reveal the opportunity costs of providing 10 piano lessons of equal
quality.
SellerCost
Marcia$200
Jan$250
Cindy$350
Greg$400
Peter$700
Bobby$800
Refer to Table 712. You wish to purchase 10 piano lessons, so you take bids from each
of the sellers. The bids are required to be rounded to the nearest dollar. You will not
accept a bid below a seller’s cost because you are concerned that the seller will not
provide all 10 lessons. Your parents have given you $450 to spend on piano lessons.
You believe that the sellers with higher opportunity costs offer higher quality lessons.
You want the highest quality lessons that you can afford, but you can spend any
remaining money on dinner with friends. From whom will you take lessons, and how
much money will you spend?
a. Peter; $450
b. Cindy; $450
c. Greg; $401
d. Cindy; $401

Necessities such as food and clothing tend to have
a. high price elasticities of demand and high income elasticities of demand.
b. high price elasticities of demand and low income elasticities of demand.
c. low price elasticities of demand and high income elasticities of demand.
d. low price elasticities of demand and low income elasticities of demand.
The most common data for testing economic theories come from
a. carefully controlled and conducted laboratory experiments.
b. computer models of economies.
c. historical episodes of economic change.
d. centrally planned economies.
Which of the following tools help us evaluate how taxes affect economic wellbeing?
(i)consumer surplus
(ii)producer surplus
(iii)tax revenue
(iv)deadweight loss
a. (i) and (ii) only
b. (i), (ii), and (iii) only
c. (iii) and (iv) only
d. (i), (ii), (iii), and (iv)
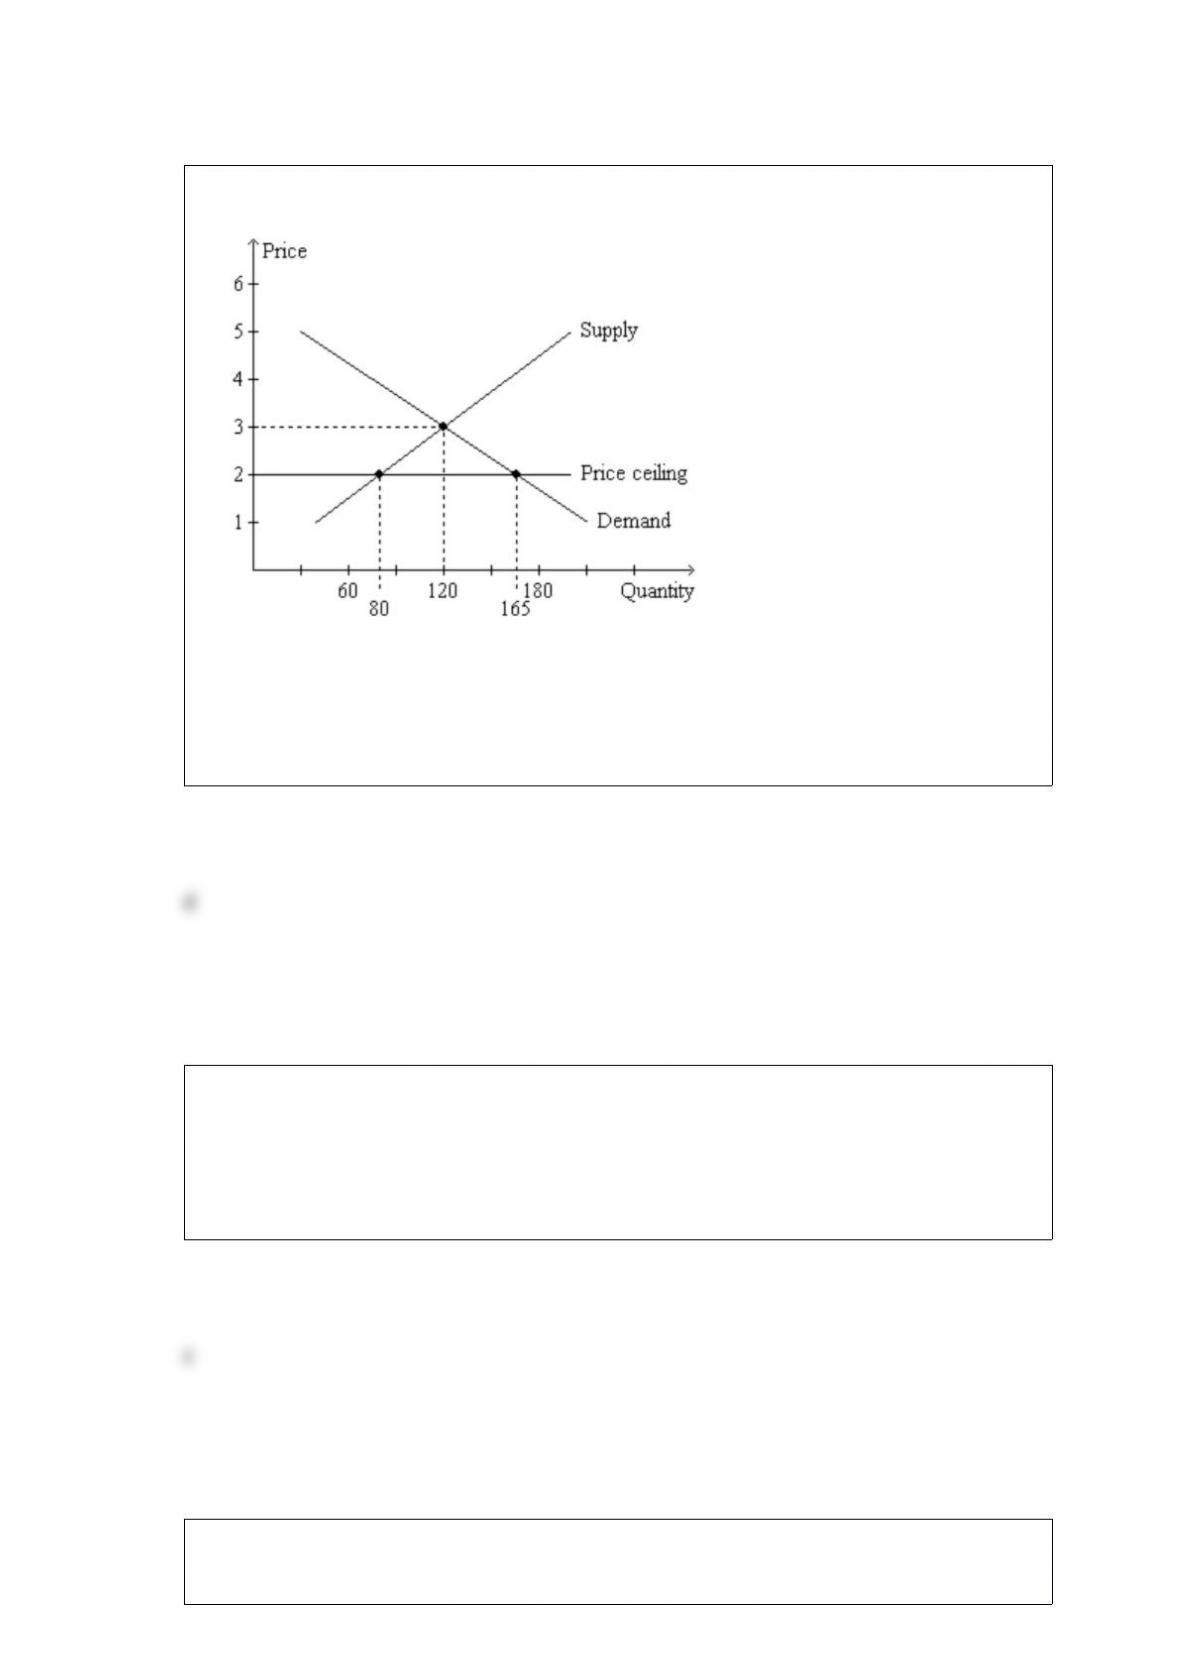
Figure 62
Refer to Figure 62. The price ceiling causes quantity
a. supplied to exceed quantity demanded by 45 units.
b. supplied to exceed quantity demanded by 85 units.
c. demanded to exceed quantity supplied by 45 units.
d. demanded to exceed quantity supplied by 85 units.
If something happens to alter the quantity demanded at any given price, then
a. the demand curve becomes steeper.
b. the demand curve becomes flatter.
c. the demand curve shifts.
d. we move along the demand curve.
Figure 220
Relationship Between Years of Education and Annual Income
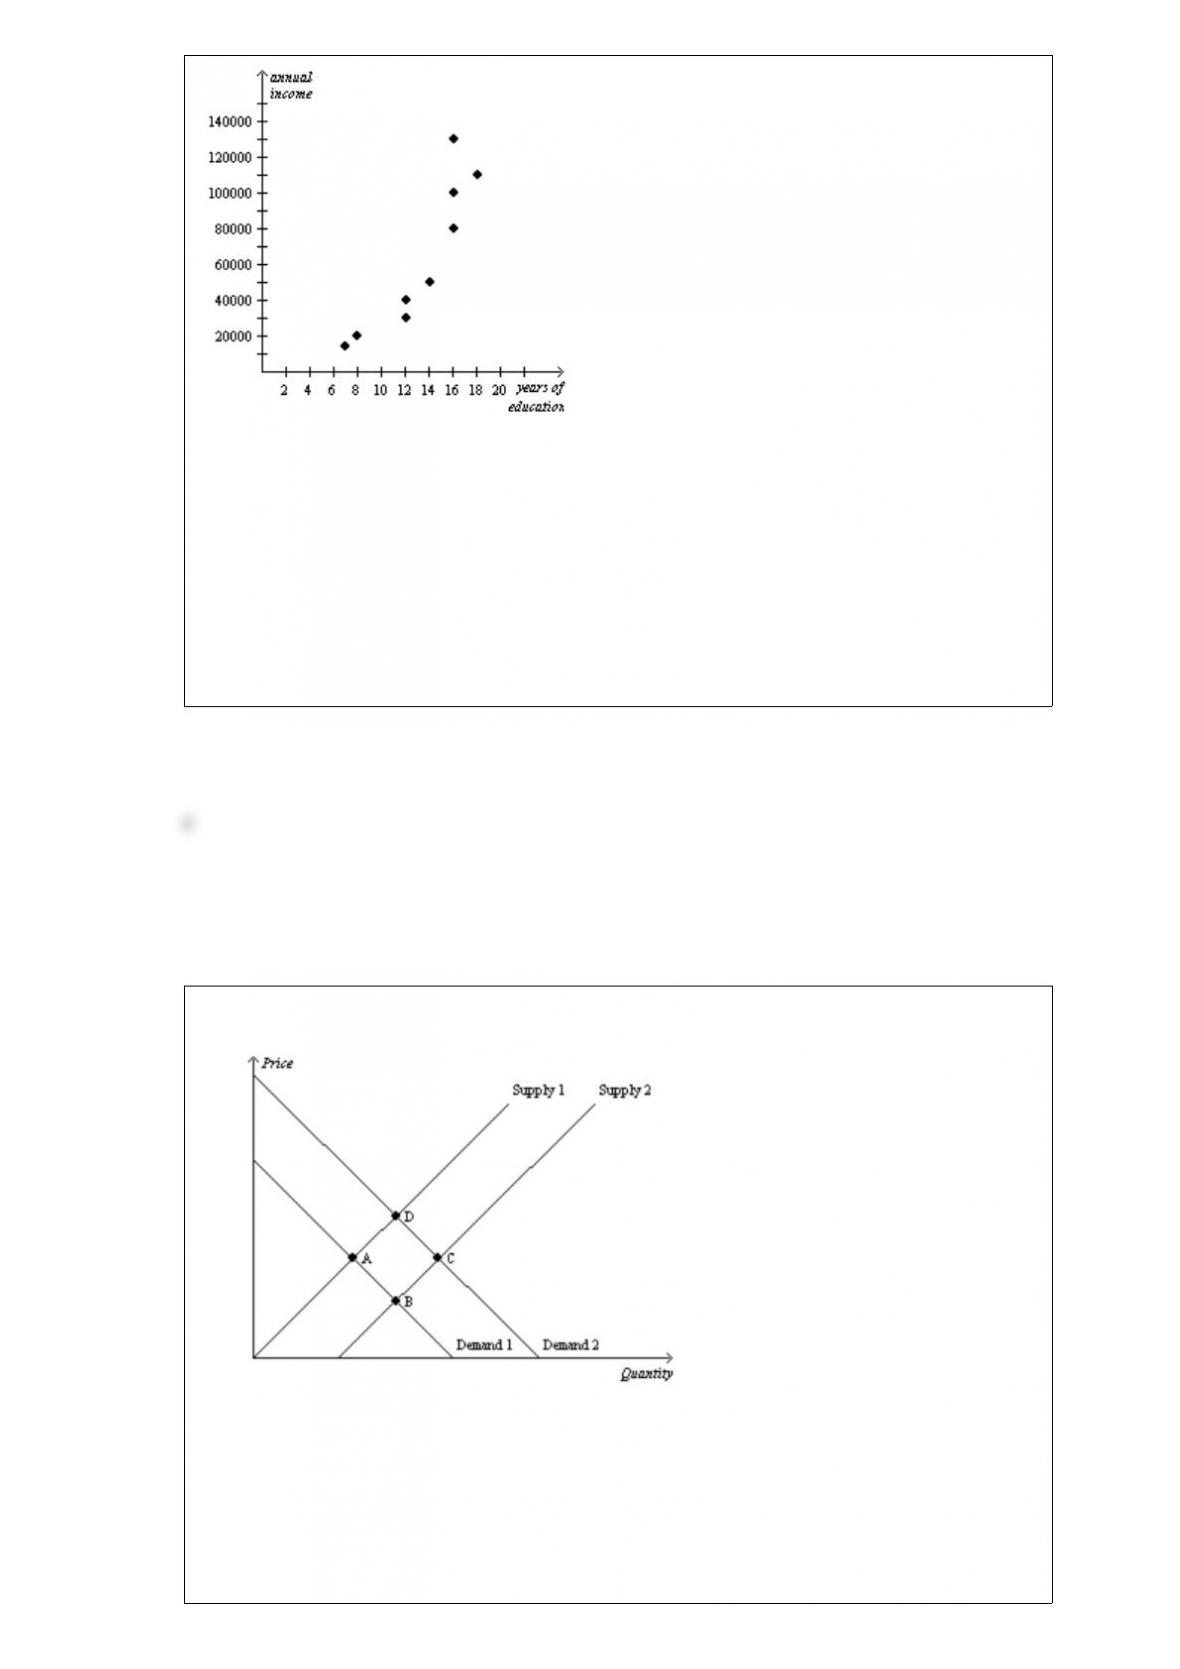
Refer to Figure 220. Senator Smith observes the graph and concludes that people who
earn higher incomes attend school for more years. Senator Jones observes the graph and
concludes that people who attend school for more years earn higher incomes. Who is
correct?
a. Senator Smith is correct.
b. Senator Jones is correct.
c. It is difficult to say which senator might be correct due to the reverse causality
problem.
d. It is difficult to say which senator might be correct due to omitted variable bias.
Figure 426
Refer to Figure 426. Which of the following movements would illustrate the effect in
the market for ballroom dancing lessons resulting from the introduction of a popular
new television show called “Dancing with the Stars”?
a. Point A to Point B
b. Point C to Point B
c. Point C to Point D
d. Point A to Point D
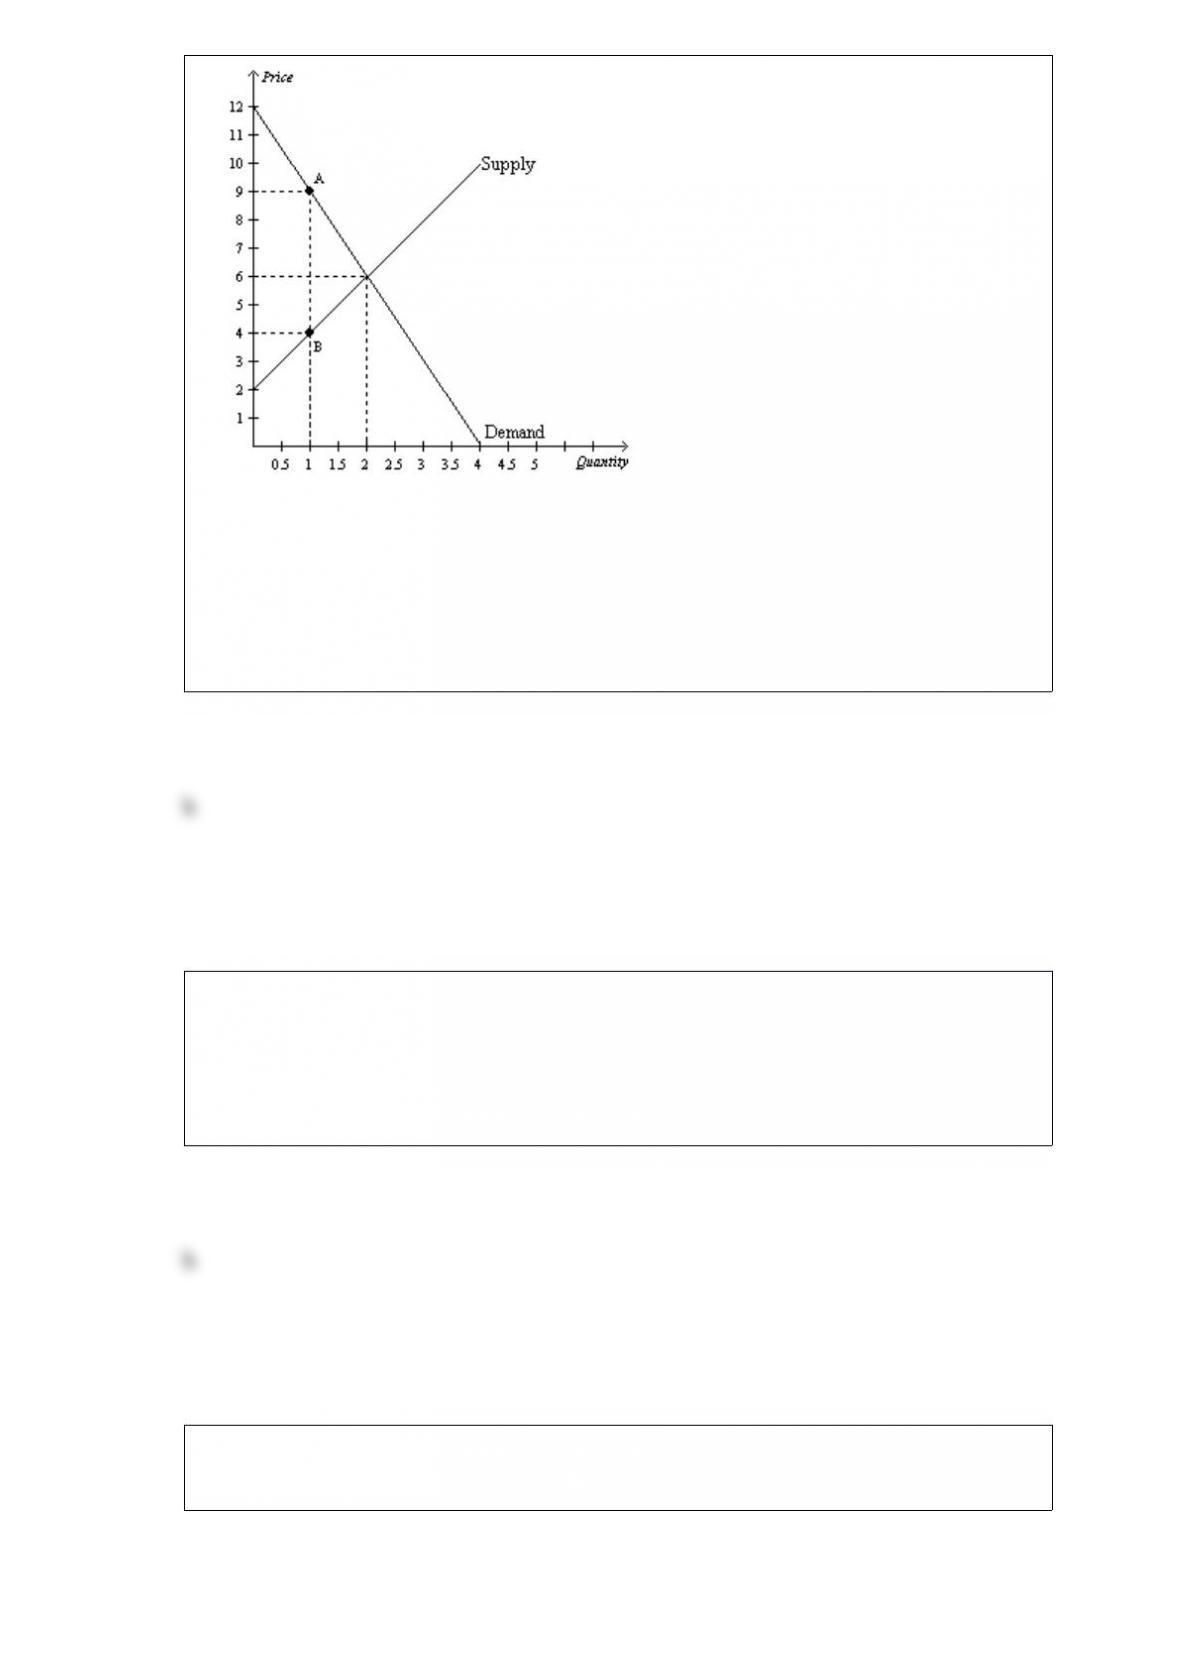
Figure 515
Refer to Figure 515. Along which of these segments of the supply curve is supply most
elastic?
a. AB
b. CD
c. DH
d. GH
Figure 82
The vertical distance between points A and B represents a tax in the market.
Refer to Figure 82. The loss of producer surplus associated with some sellers dropping
out of the market as a result of the tax is
a. $0.
b. $1.
c. $2.
d. $3.
Moving production from a highcost producer to a lowcost producer will
a. lower total surplus.
b. raise total surplus.
c. lower producer surplus.
d. raise producer surplus but lower consumer surplus.
Figure 724
Refer to Figure 724. If 6 units of the good are produced and sold, then
a. consumer surplus is greater than producer surplus.
b. producer surplus is maximized.
c. the sum of consumer surplus and producer surplus is maximized.
d. consumer surplus equals producer surplus.
Figure 627
This figure shows the market demand and market supply curves for good Z.
Refer to Figure 627. Suppose a tax of $6 per unit is imposed on this market. Which of
the following is correct?
a. Buyers and sellers will share the burden of the tax equally.
b. Buyers will bear more of the burden of the tax than sellers will.
c. Sellers will bear more of the burden of the tax than buyers will.
d. Any of the above is possible.

Suppose the government imposes a 25cent tax on the buyers of incandescent light
bulbs. Which of the following is not correct? The tax would
a. shift the demand curve downward by 25 cents.
b. lower the equilibrium price by 25 cents.
c. reduce the equilibrium quantity.
d. discourage market activity.
An alternative to rentcontrol laws that would not reduce the quantity of housing
supplied is
a. the payment by government of a fraction of a poor family’s rent.
b. higher taxes on rental income earned by landlords.
c. a policy that prevents landlords from evicting tenants.
d. a policy that allows government to confiscate residential property for the purpose of
commercial development.
Figure 618
The vertical distance between points A and B represents the tax in the market.
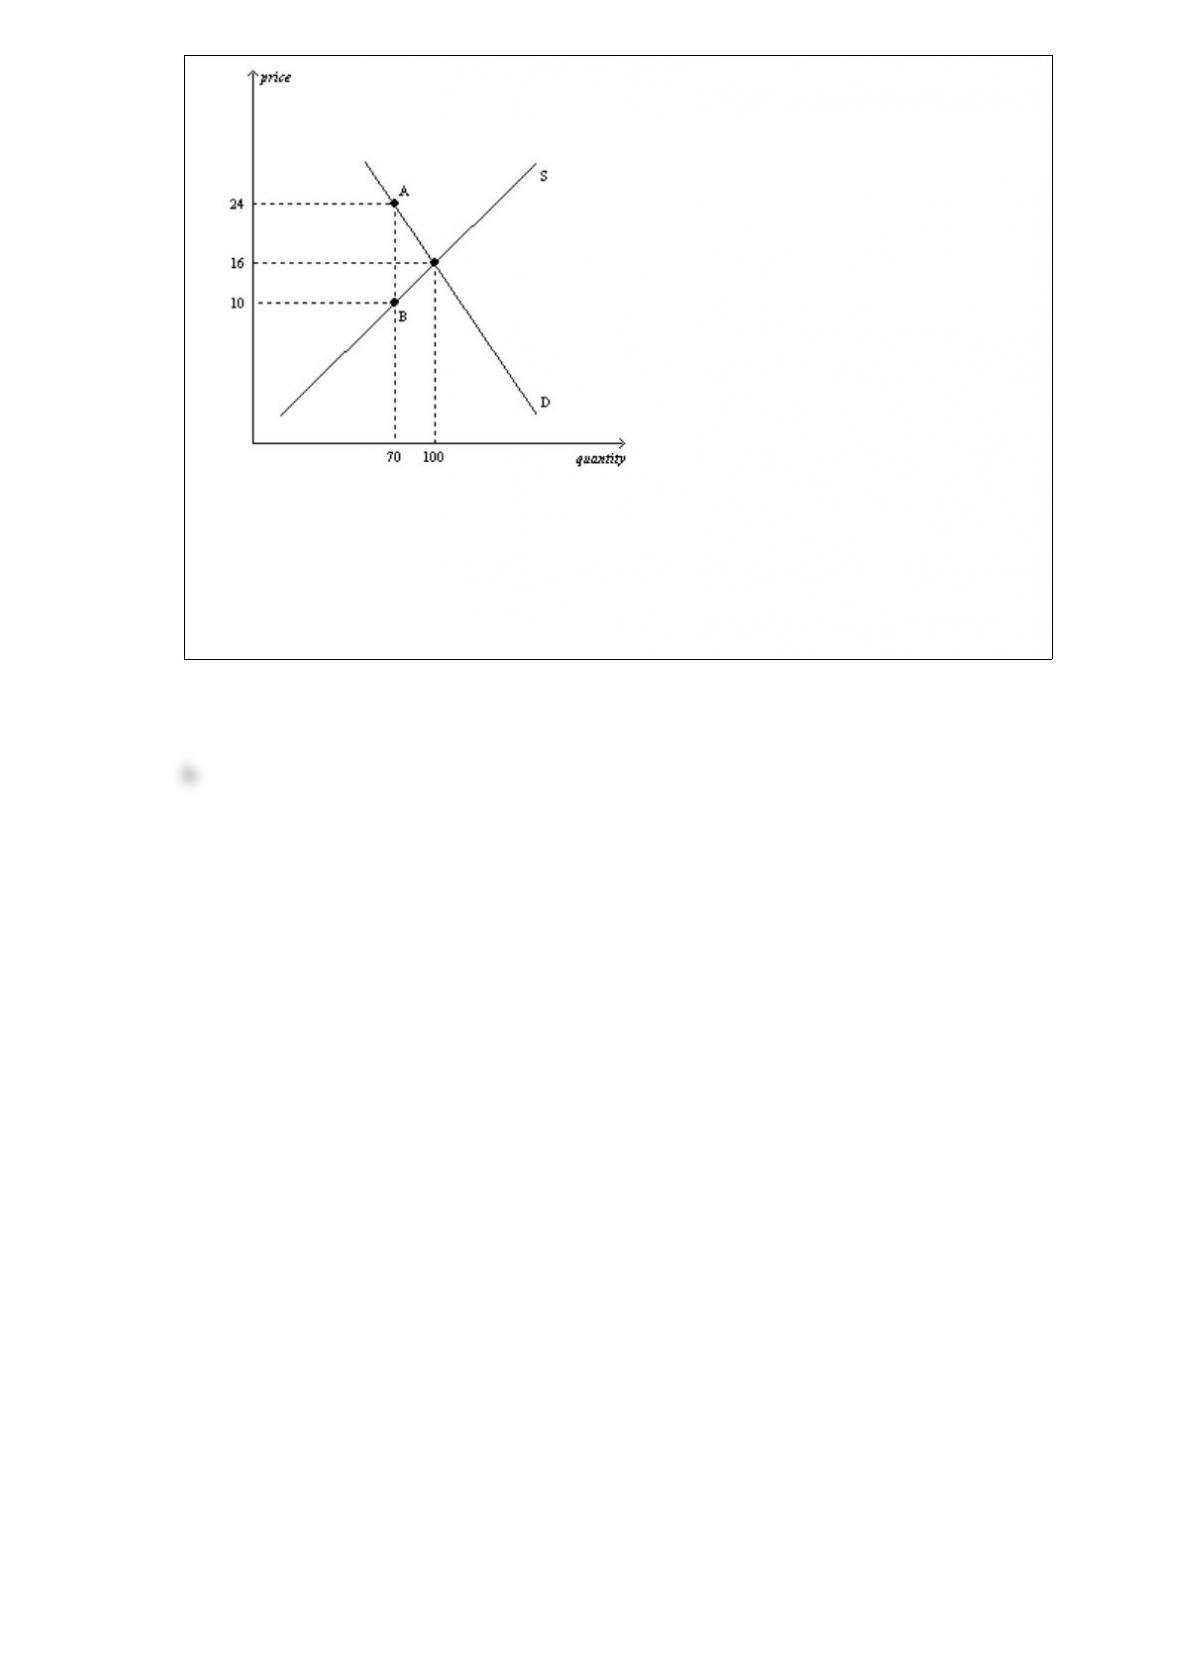
Refer to Figure 618. The effective price that sellers receive after the tax is imposed is
a. $6.
b. $10.
c. $16.
d. $24.