
In a simple economy (no government), the vertical distance between the consumption
function and the expenditure schedule measures
a. undesired inventory depletion.
b. planned investment
c. undesired investment.
d. unintended investment.
To “cure” their balance of payments deficits without altering exchange rates, Southeast
Asian countries in 1997 were forced to create
a. more inflation.
b. recessions.
c. faster economic growth.
d. money at an accelerated rate.
To understand most of today’s economic activity in the U.S. economy, we should look
at which of the following models?
a. perfect competition and pure monopoly

b. perfect competition and oligopoly
c. oligopoly and monopolistic competition
d. monopolistic competition and monopoly
Loopholes reduce the efficiency of the tax system.
a. True
b. False
Inventions like gunpowder and the wheelbarrow were created by the Chinese hundreds
of years ago. The fact that such items were not put to productive use was caused
primarily by a lack of ____.
a. financial capital
b. entrepreneurship
c. an adequate price system
d. marginal analysis

The short-run effects of government’s financial rescue program and fiscal stimulus
package helped the economy increase aggregate demand curing the Great Recession.
a. True
b. False
Most loopholes in the income tax system
a. are more likely to be exploited by the wealthy.
b. make it more progressive.
c. were created by the tax reforms instituted in 1986.
d. do not affect the economic decisions of the people who benefit from them.
If personal income tax rates are decreased in an attempt to stimulate spending, we
should expect to see
a. an increase in consumption and an increase in GDP.
b. an increase in consumption and a decrease in GDP.
c. a decrease in consumption and a decrease in GDP.
d. a decrease in consumption and an increase in GDP.
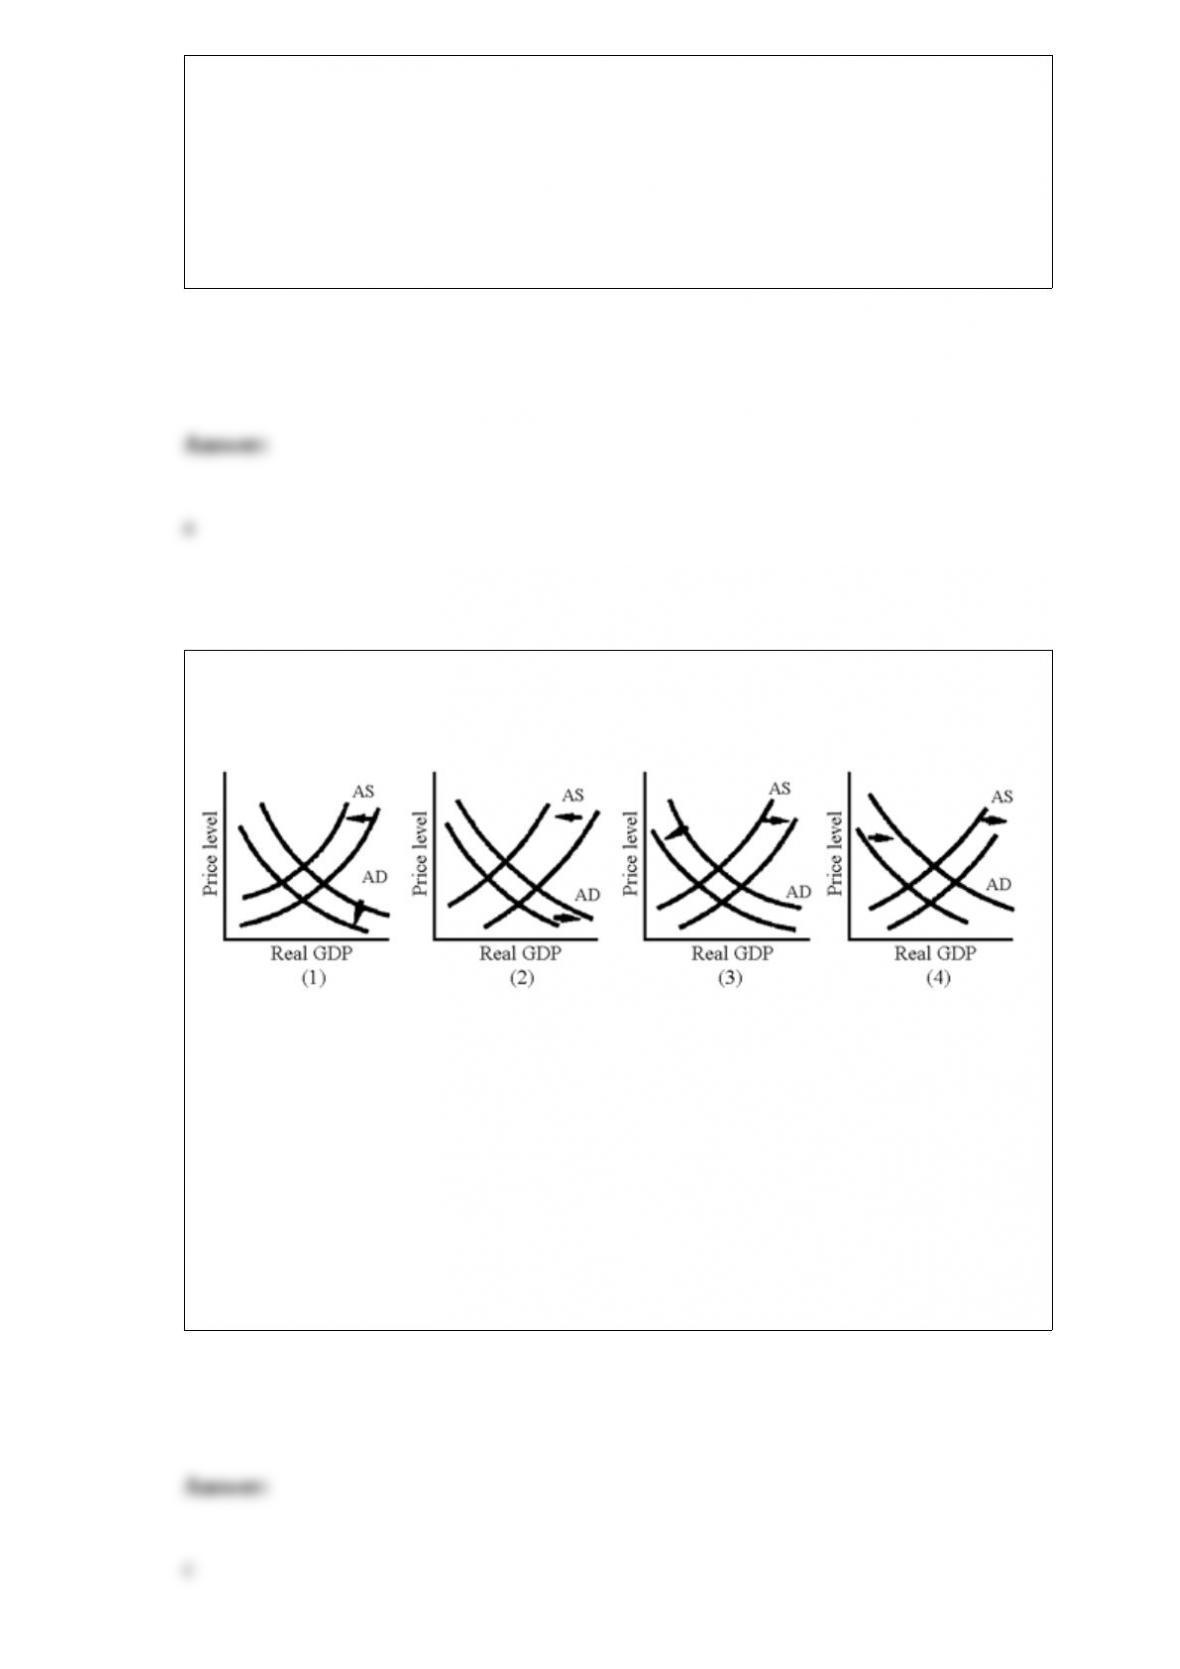
Figure 20-4
Which of the situations illustrated in Figure 20-4 shows a currency appreciation leading
to disinflation?
a. 1
b. 2
c. 3
d. 4

Supply-side tax cuts designed to increase investment spending are attractive in theory,
but in practice
a. the effect is the opposite of what theory suggests.
b. are less useful, because they take a long time to increase the capital stock.
c. they have no effect on the capital stock in the short or long run.
d. are powerful in the short run as capital stock rapidly increases, but the effect tapers
off in the long run.
The price for labor is the wage rate. What happens to the quantity of labor demanded if
wages increase?
a. It increases.
b. It decreases.
c. It does not change.
d. The whole demand schedule shifts to the left.
An indifference curve is a line showing

a. combinations of goods that can be produced if all resources are fully employed.
b. all combinations of two commodities that are equally desirable to the consumer.
c. all combinations of goods over which the consumer has no choice.
d. how decisions are made in a nonmarket economy.
Among possible union strategies, the one that can both raise wages and add to
employment is
a. restricting the supply of workers.
b. raising the demand curve for the product or for labor.
c. fixing the wage.
d. striking frequently.
The price of coal fell and the quantity sold also fell. Everything else being equal, it is
consistent that
a. the price of oil fell.
b. coal miners received large wage increases.
c. more efficient mining equipment was installed.
d. consumer incomes rose.
e. the supply of coal fell.
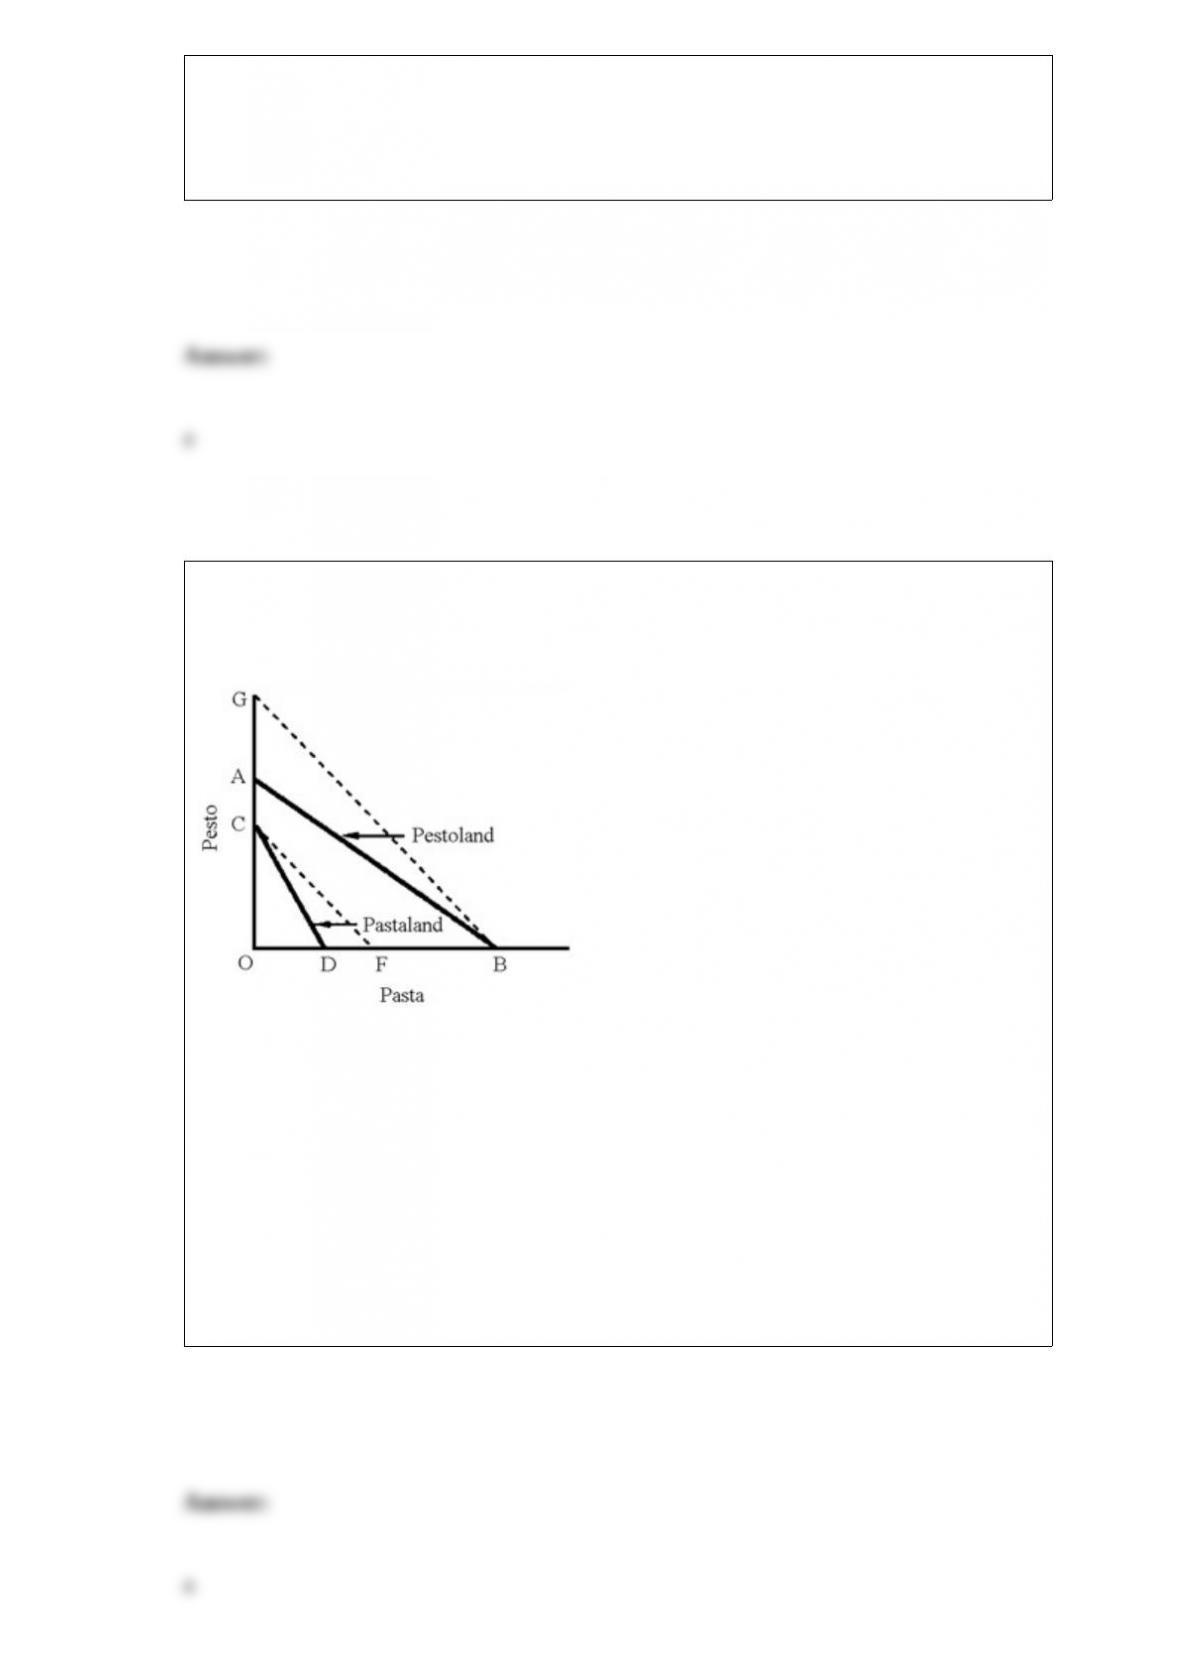
Figure 22-7
In Figure 22-7, AB represents the production possibilities of Pestoland and CD that of
Pastaland. In this graph, Pestoland has a comparative advantage in
a. pasta because OA/OB < OC/OD.
b. pesto because OA/OB < OC/OD.
c. pasta because OA/OB OC/OD.
d. pesto because OA/OB OC/OD.

Regulating an industry to remove all economic profit
a. removes all incentive for efficiency and responsiveness to consumer demand.
b. removes distortions caused by cross subsidies.
c. removes allocative inefficiency.
d. increases incentives to be productively efficient.
A monopolist’s demand curve implies that
a. the monopolist is a price taker.
b. the monopolist is a price maker.
c. it has nothing to do with the amount a monopolist can sell.
d. it can be downward sloping or horizontal depending on the price.
Figure 5-1
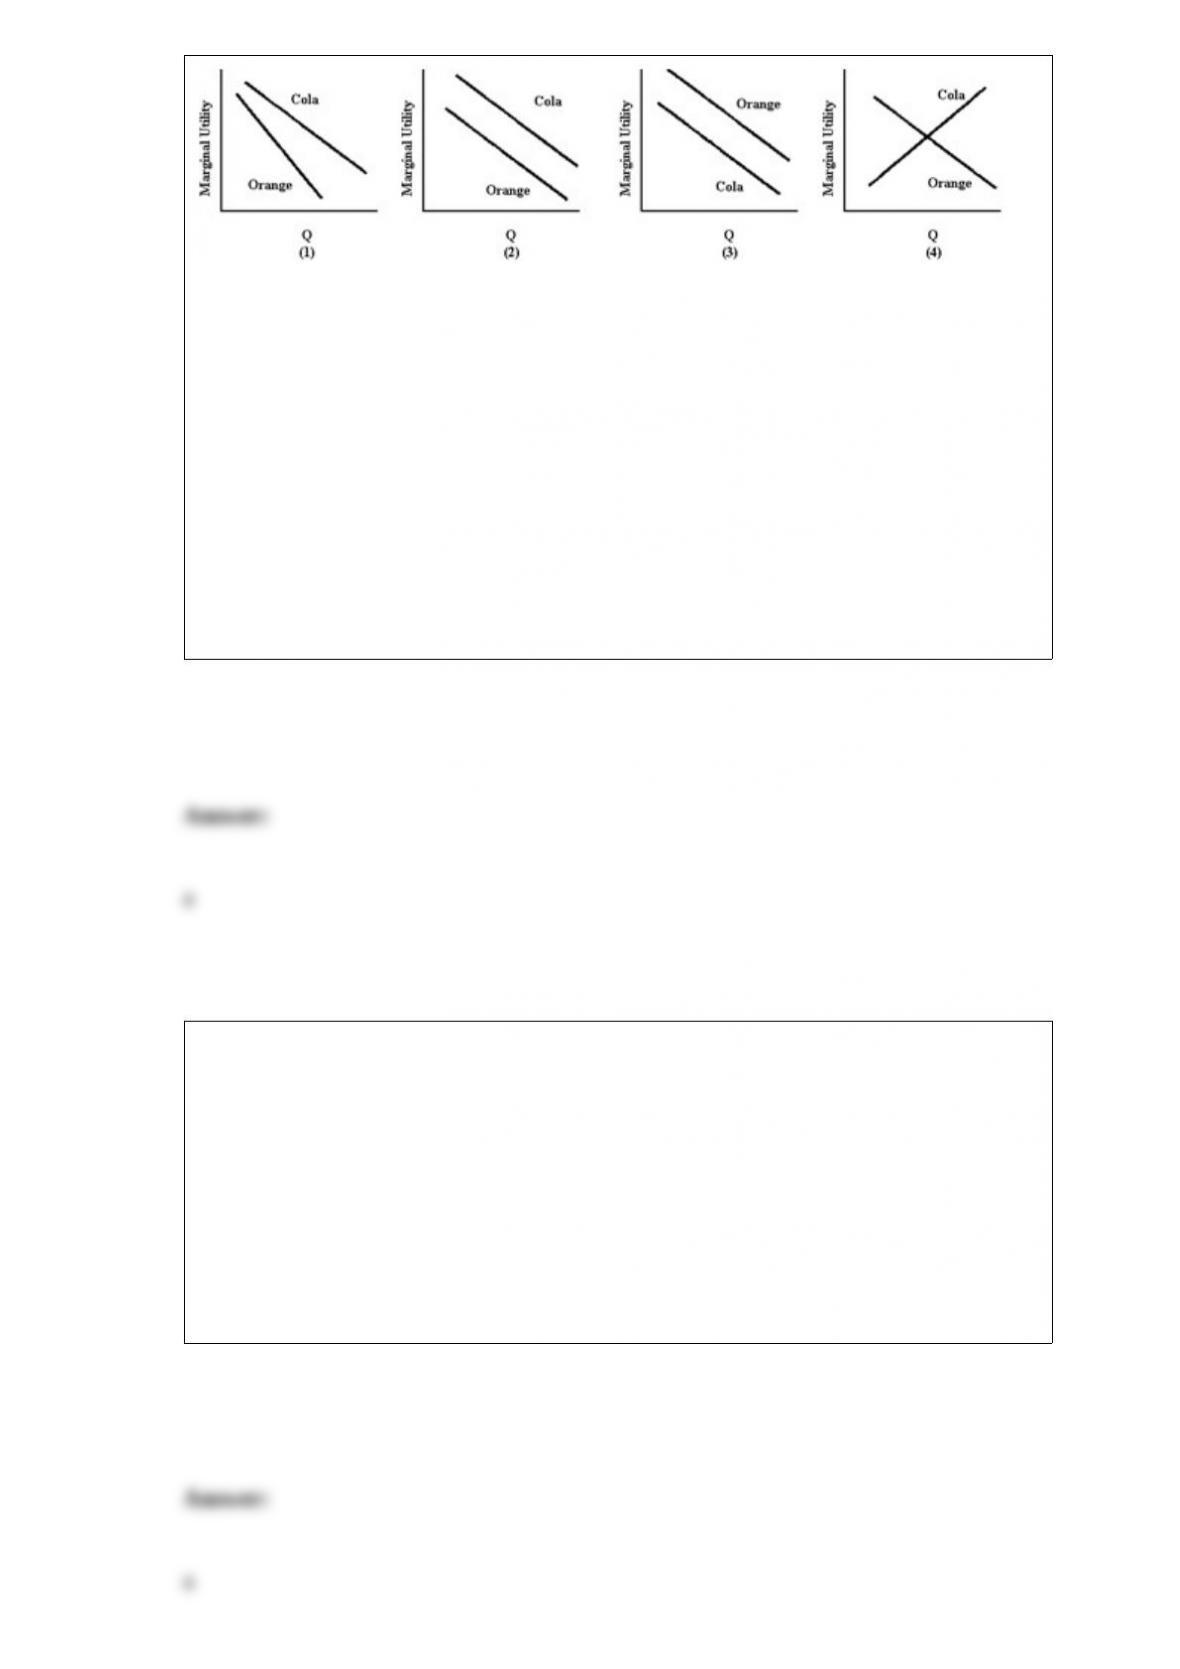
Americans choose cola over other flavors 70 percent of the time. Analysts say this is
because cola’s flavor is more robust and durable. Orange soda, for example, suffers
from flavor fatigue faster than cola. Also, because cola contains caffeine, people may be
addicted to the stimulant. Which panel in Figure 5-1 best illustrates these facts?
a. 1
b. 2
c. 3
d. 4
If doubling the quantity of inputs more than doubles the quantity of outputs, the firm is
experiencing
a. increasing returns to scale.
b. decreasing returns to scale.
c. constant returns to scale.
d. increasing costs per unit of output.

Which of the following observations concerning the absolute definition of poverty is
true?
a. It is based on average income.
b. It is an optimistic definition.
c. It is not arbitrary in nature.
d. It is a cultural definition.
Why do economists tend to create models in diagrammatic form?
a. Diagrams hide reality, and theory is an attempt to avoid reality.
b. It is easier than building models out of physical objects.
c. Economic reality cannot possibly be represented except in diagrams.
d. Most economists are frustrated artists, and like to draw when possible.
e. All of the above are correct.
Aggregate demand is the sum of

a. C + I + G + (X − IM).
b. C + I + X.
c. C + I + X − IM.
d. C + I + G.
When we add a personal income tax to the macroeconomic model, the
a. multiplier becomes larger.
b. multiplier becomes smaller.
c. expenditures schedule shifts upward.
d. expenditures schedule becomes steeper.
Figure 22-5
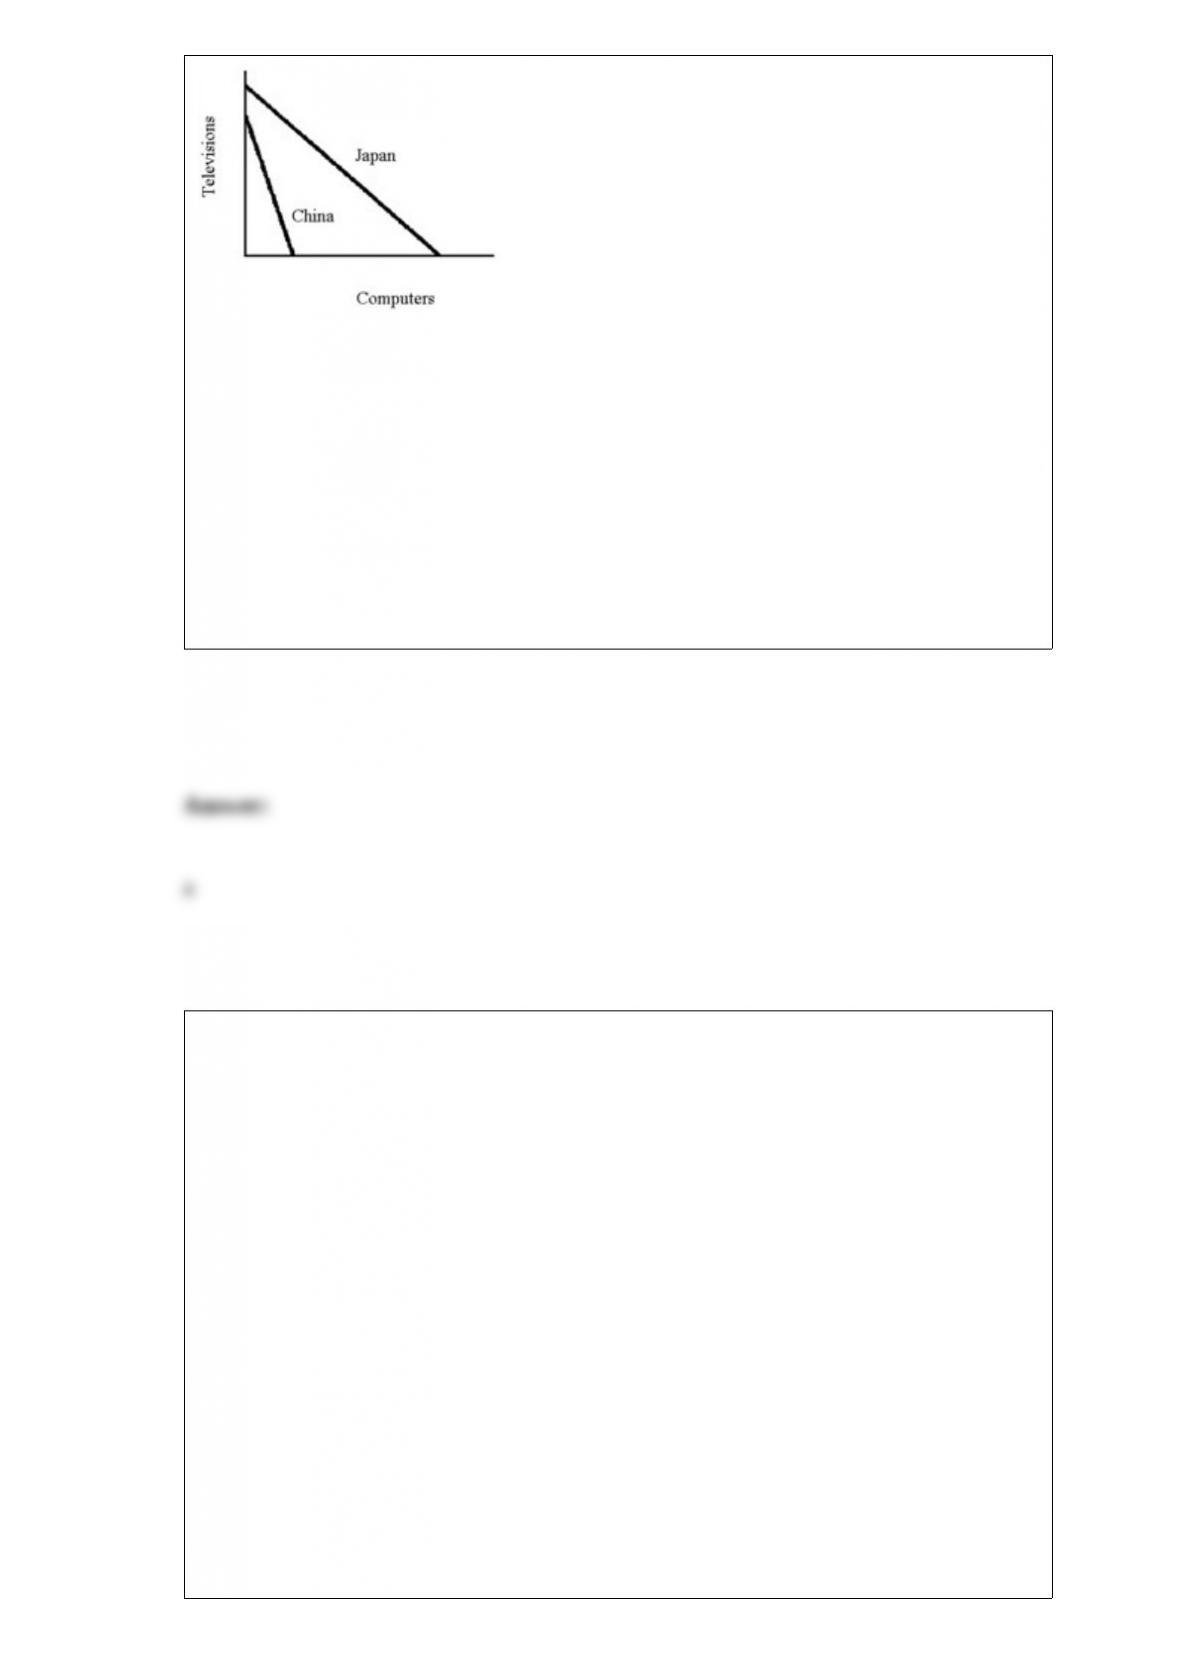
From the graph in Figure 22-5 (curves show output per unit of labor input), one can
infer that
a. in terms of TVs, computers are more expensive in China than Japan.
b. in terms of computers, TVs are more expensive in China than Japan.
c. China should produce more TVs and fewer computers.
d. All of the above are correct.
Table 20-1
Suppose the economy of Macroland is described by the following:
C = 200 + .8DI (DI = disposable income)
I = 300 + .2Y − 50r (Y = GDP)
(r, the interest rate, is measured in percentage points. For example, a 9 percent interest
rate is r = 9).
For this economy, assume that the Federal Reserve uses its monetary policy to peg the
interest rate at
r = 5
G = 750

T = .25Y
X = 200
M = 150 + .2Y
Hint: DI = Y − T
From Table 20-1, find the budget deficit or surplus for Macroland.
a. 125.50
b. −93.75
c. −126.25
d. −154.75
The productivity growth rates of poorer countries tend to be ____ than those of richer
countries.
a. higher
b. lower
c. increasing slower
d. decreasing faster

Economists generally assume that faster economic growth is negative for society.
a. True
b. False
When the invisible hand is at work,
a. the price system will sometimes give incorrect cost signals to consumers.
b. the price system will allocate resources based only on consumer need.
c. all prices will be set equal to marginal costs.
d. there will be some shortages and surpluses that cannot be avoided.
One complication in the process of reducing inflation by creating recessions is that the
price level
a. adjusts more quickly to recessionary gaps than to inflationary gaps.
b. does not apply as it does in inflationary gaps.
c. always rises.

d. rarely falls.
One of the problems that monetary unions eliminate is
a. inflationary gaps.
b. recessionary gaps.
c. exchange rate instability.
d. business cycles.
Economists before Keynes assumed that equilibrium GDP occurred
a. automatically.
b. only with the help of government stabilization.
c. if spending was generally greater than output.
d. only in socialist economies with central planning.

Capital refers to an inventory or a stock of productive equipment and machines.
a. True
b. False