In economics, the term “free rider” refers to
A) a person who evades taxes.
B) a supervisor who delegates menial time-consuming activities to others.
C) one who volunteers her services.
D) one who waits for others to produce a good and then enjoys its benefits without
paying for it.
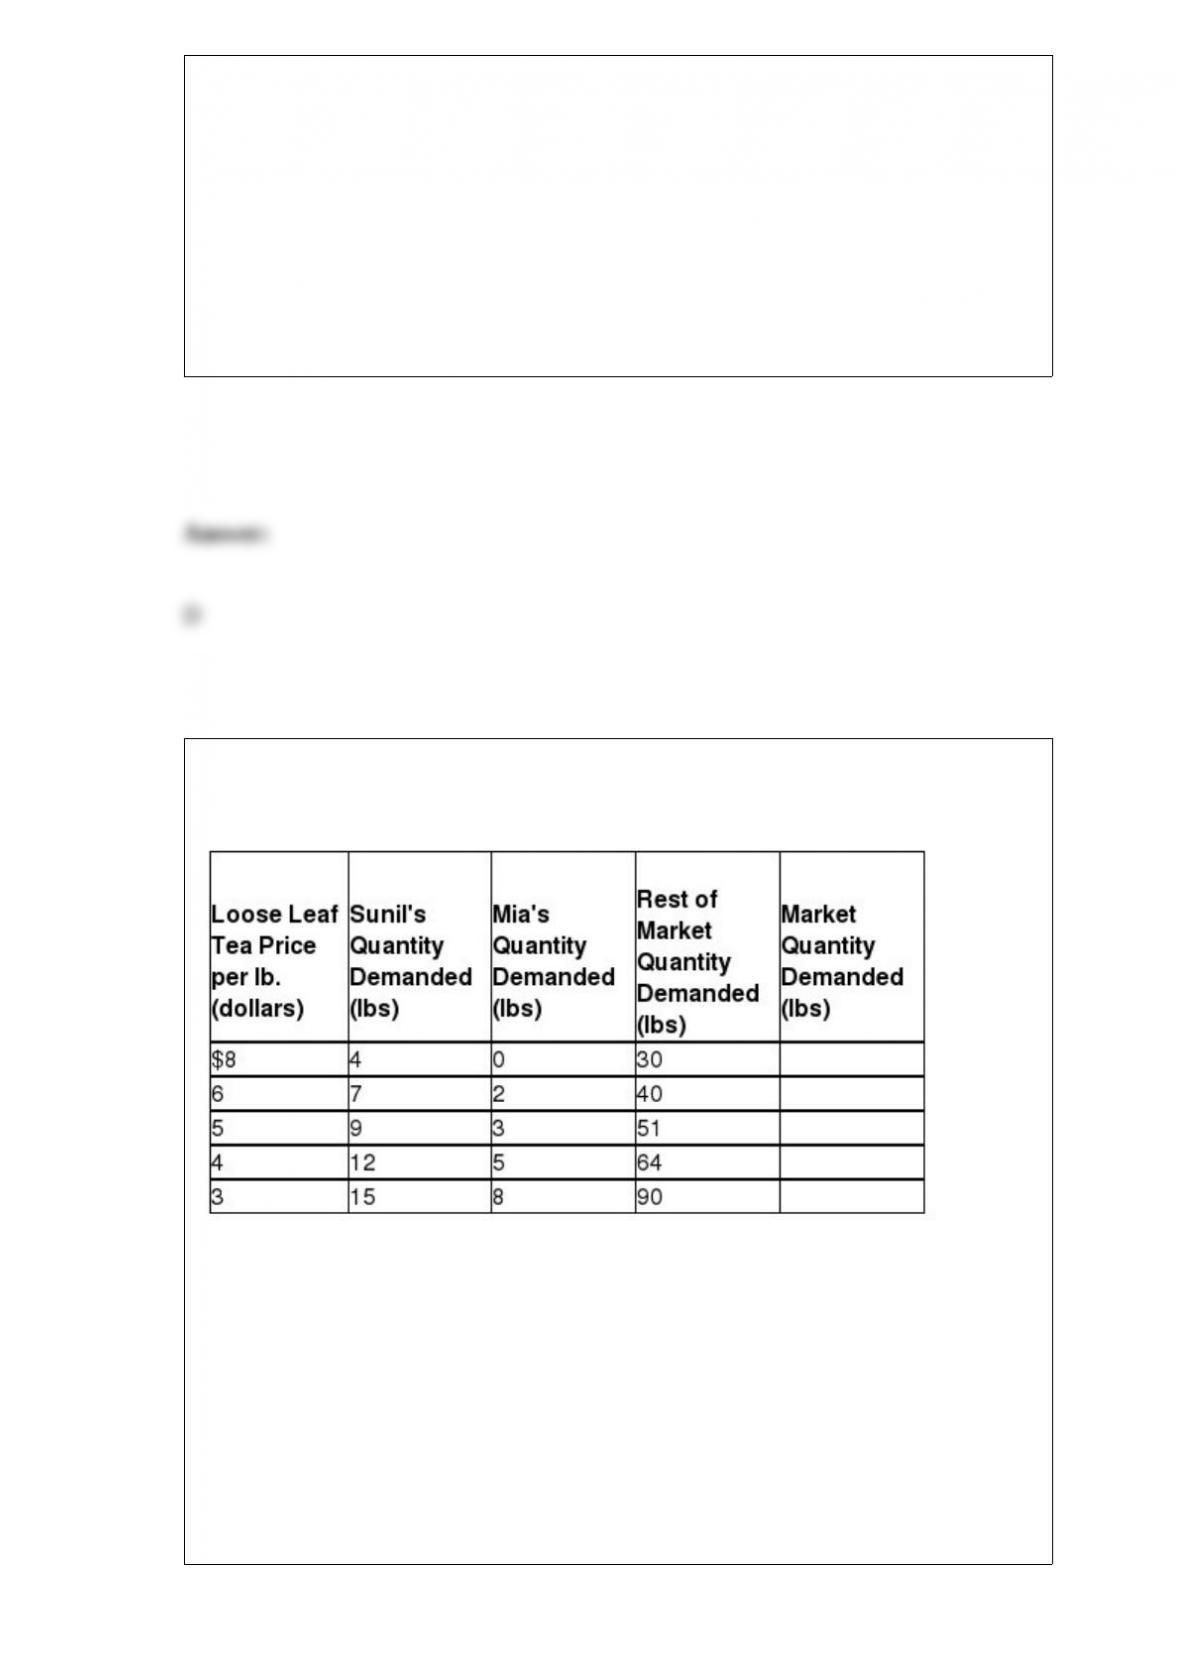
Table 3-1
Refer to Table 3-1. The table above shows the demand schedules for loose-leaf tea of
two individuals (Sunil and Mia) and the rest of the market. If the price of loose-leaf tea
rises from $3 to $4, the market quantity demanded would
A) decrease by 32 lbs.
B) increase by 64 lbs.
C) increase by 32 lbs.
D) decrease by 64 lbs.

Which of the following generation categories has the largest population in the United
States in 2015?
A) the millennials
B) generation X
C) the baby boomers
D) the centenarians
Figure 4-3
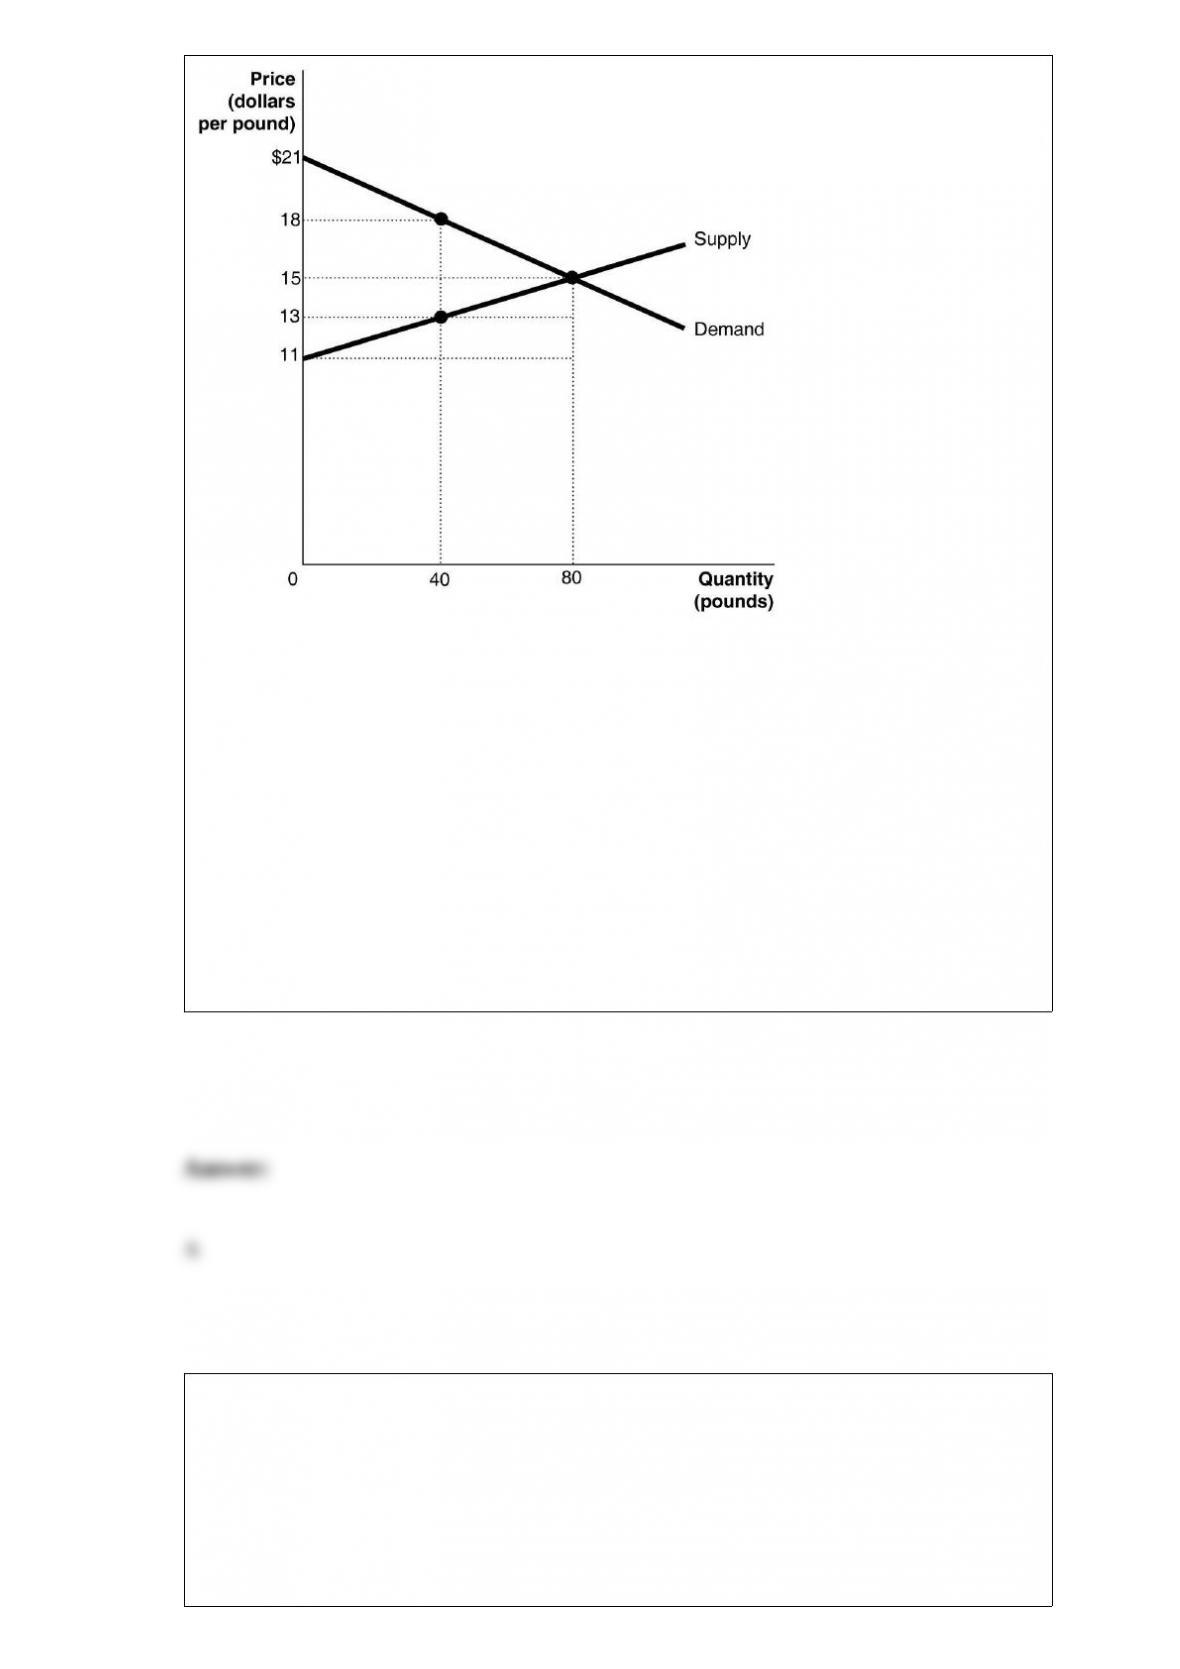
Figure 4-3 shows the market for tiger shrimp. The market is initially in equilibrium at a
price of $15 and a quantity of 80. Now suppose producers decide to cut output to 40in
order to raise the price to $18.
Refer to Figure 4-3. What is the value of consumer surplus at a price of $18?
A) $60
B) $120
C) $180
D) $240
The demand for labor is described as a derived demand because
A) it is derived by workers seeking to earn income to fund the consumption of goods
and services.
B) it is derived by producers seeking to make profits by starting new businesses.

C) it is derived from the demand for products that use labor in the production process.
D) it is derived from government institutions which rely on labor markets for the
purpose of raising tax revenue.
Stock prices are
A) based more on the current profitability of firms than on their expected future
profitability.
B) based less on the current profitability of firms than on their expected future
profitability.
C) based equally on the current profitability of firms and on their expected future
profitability.
D) not based on the current profitability of firms or on their expected future
profitability.
Figure 10-4
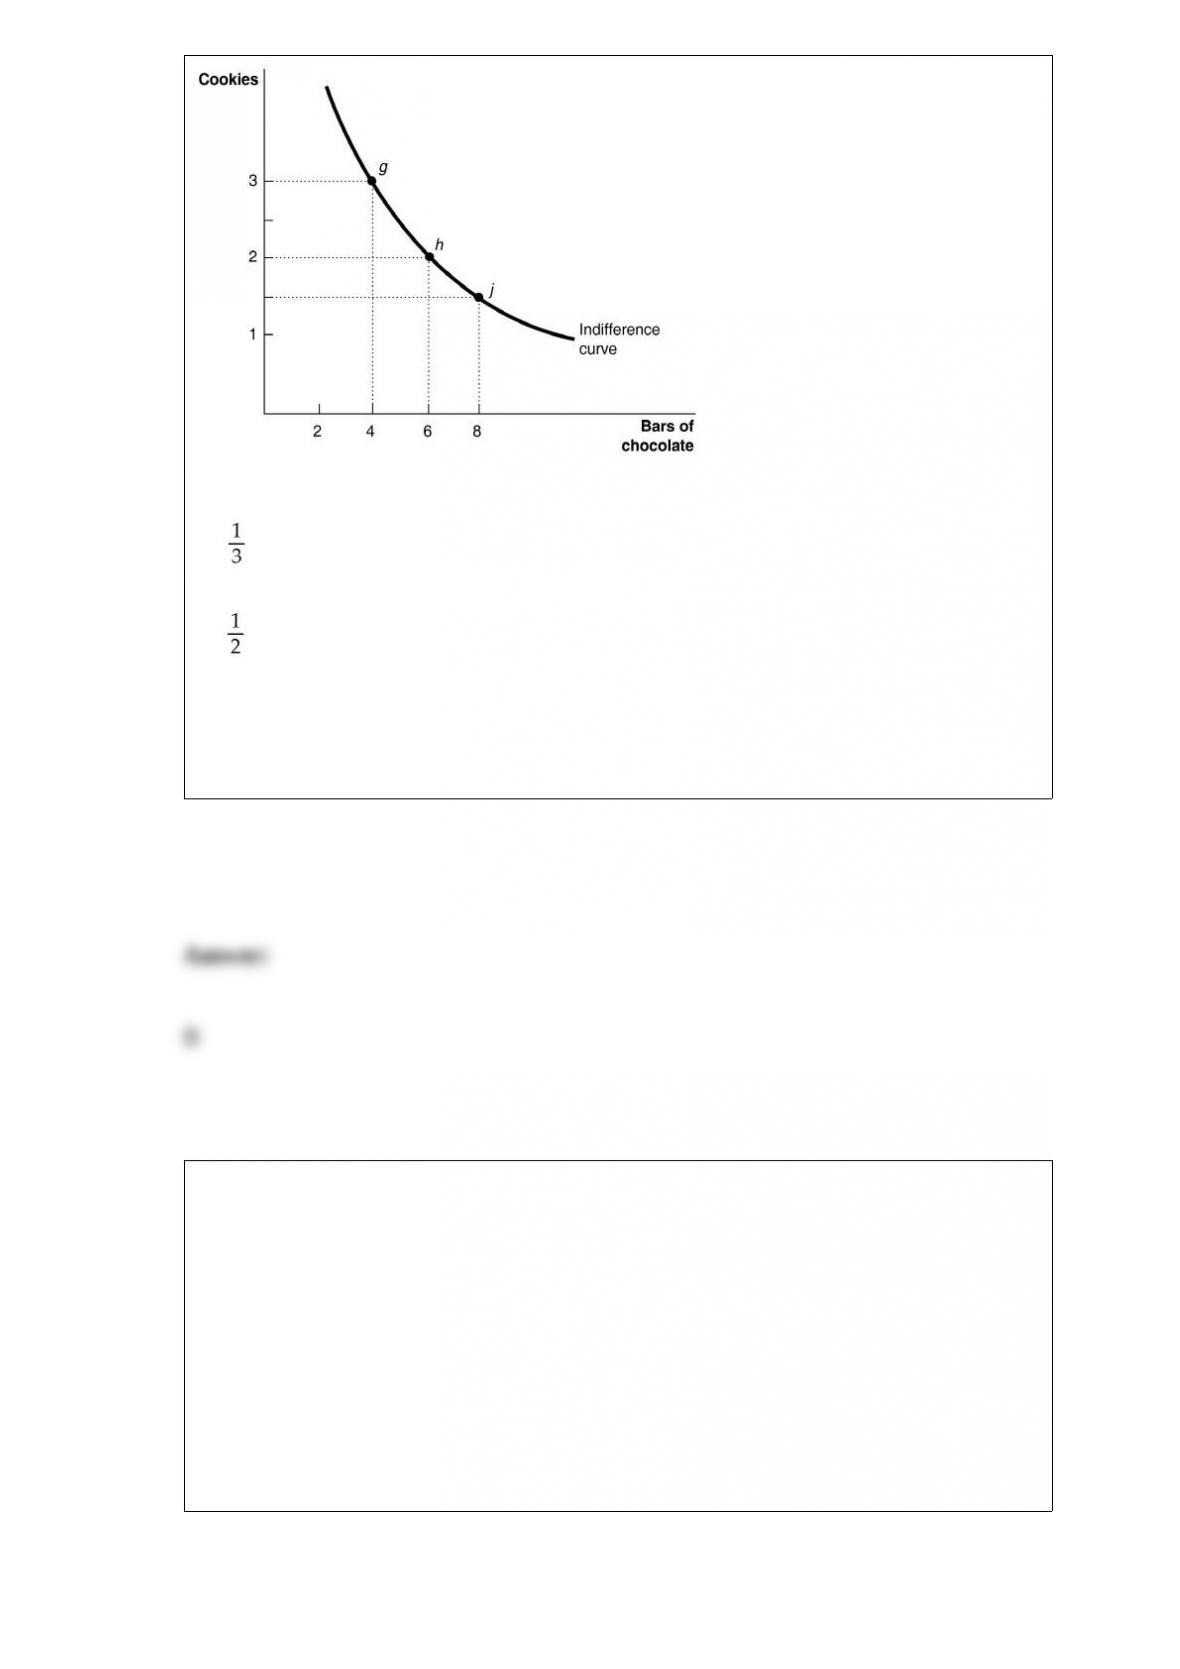
Refer to Figure 10-4. What is the marginal rate of substitution between g and h?
A) of a cookie.
B) of a cookie.
C) 2 cookies.
D) 3 cookies.
Market supply is found by
A) vertically summing the relevant part of each individual producer’s marginal cost
curve.
B) horizontally summing the relevant part of each individual producer’s marginal cost
curve.
C) vertically summing each individual producer’s average total cost curve.
D) horizontally summing each individual producer’s average total cost curve.

You own a business that answers telephone calls for physicians after their offices close.
You have an incentive to substitute capital for labor if the
A) price of capital increases.
B) price of labor decreases.
C) price of labor increases.
D) marginal product of labor increases.
Policies that mandate the installation of specific pollution control devices are called
A) command-and-control policies.
B) benefit policies.
C) welfare policies.
D) incentive policies.

It is difficult for a private market to provide the economically efficient quantity of a
public good because
A) by law governments cannot use cost-benefit analysis to determine this quantity.
B) public goods produce positive and negative externalities.
C) individual preferences are not revealed in the market for the good.
D) it is too expensive to produce the necessary amount of the good.
Let MP = marginal product, P = output price, and W = wage, then the equation that
represents a situation where a competitive firm should lay off some workers to
maximize profits is
A) P × MP = W.
B) P × MP > W.
C) P × MP < W.
D) MP × W = P.
Which of the following statements about the price elasticity of demand along a
downward-sloping linear demand curve is true?
A) It is inelastic at high prices and elastic at low prices.
B) It is unit elastic throughout the demand curve.
C) It is elastic at high prices and inelastic at low prices.
D) It is perfectly elastic at very high prices and perfectly inelastic at very low prices.
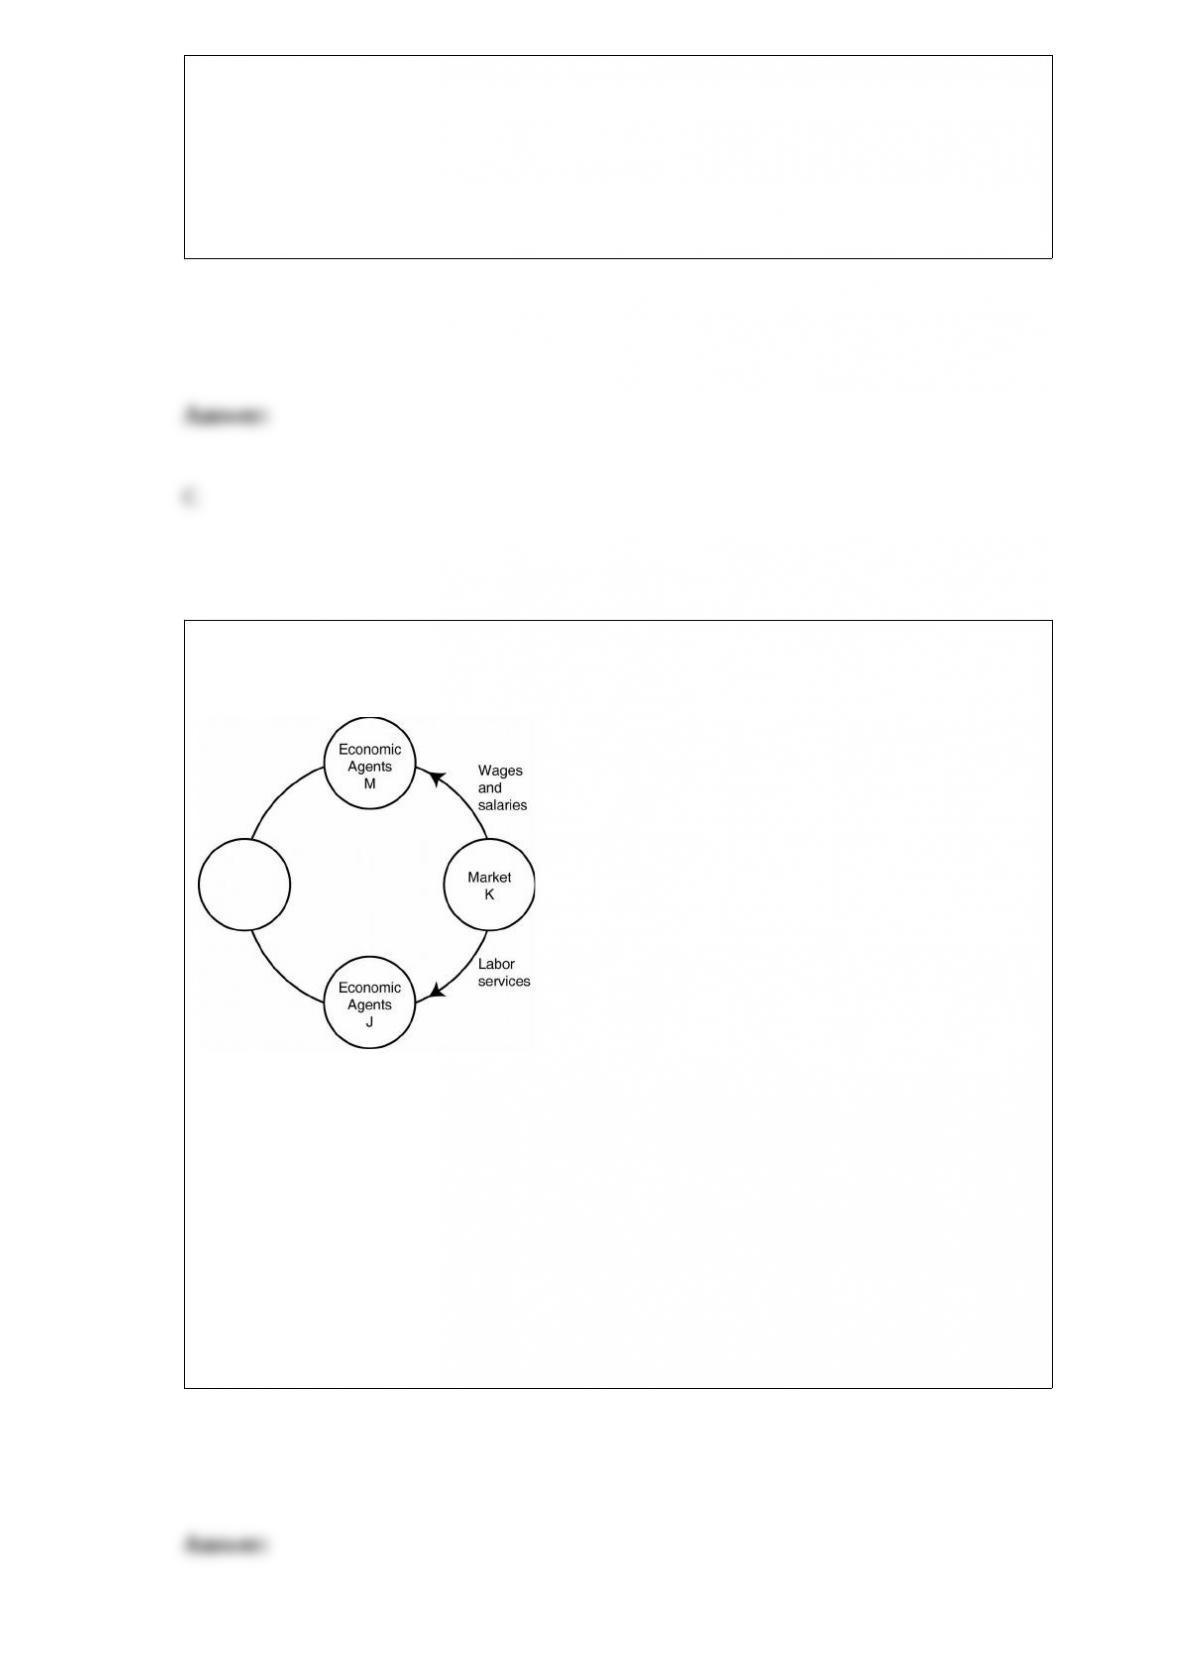
Figure 2-11
Refer to Figure 2-11. One segment of the circular flow diagram in the figure shows the
flow of wages and salaries from market K to economic agents M. What is market K and
who are economic agents M?
A) K = factor markets; M = households
B) K = product markets; M = households
C) K = factor markets; M = firms
D) K = product markets; M = firms

Figure 10-6
The above panels show various combinations of indifference curves and budget
constraints for two products: Popcorn and Candy.
Refer to Figure 10-6. A change in the price of popcorn only is shown in
A) Panel A.
B) Panel B.
C) Panel C.
D) none of the above panels.
Figure 4-3
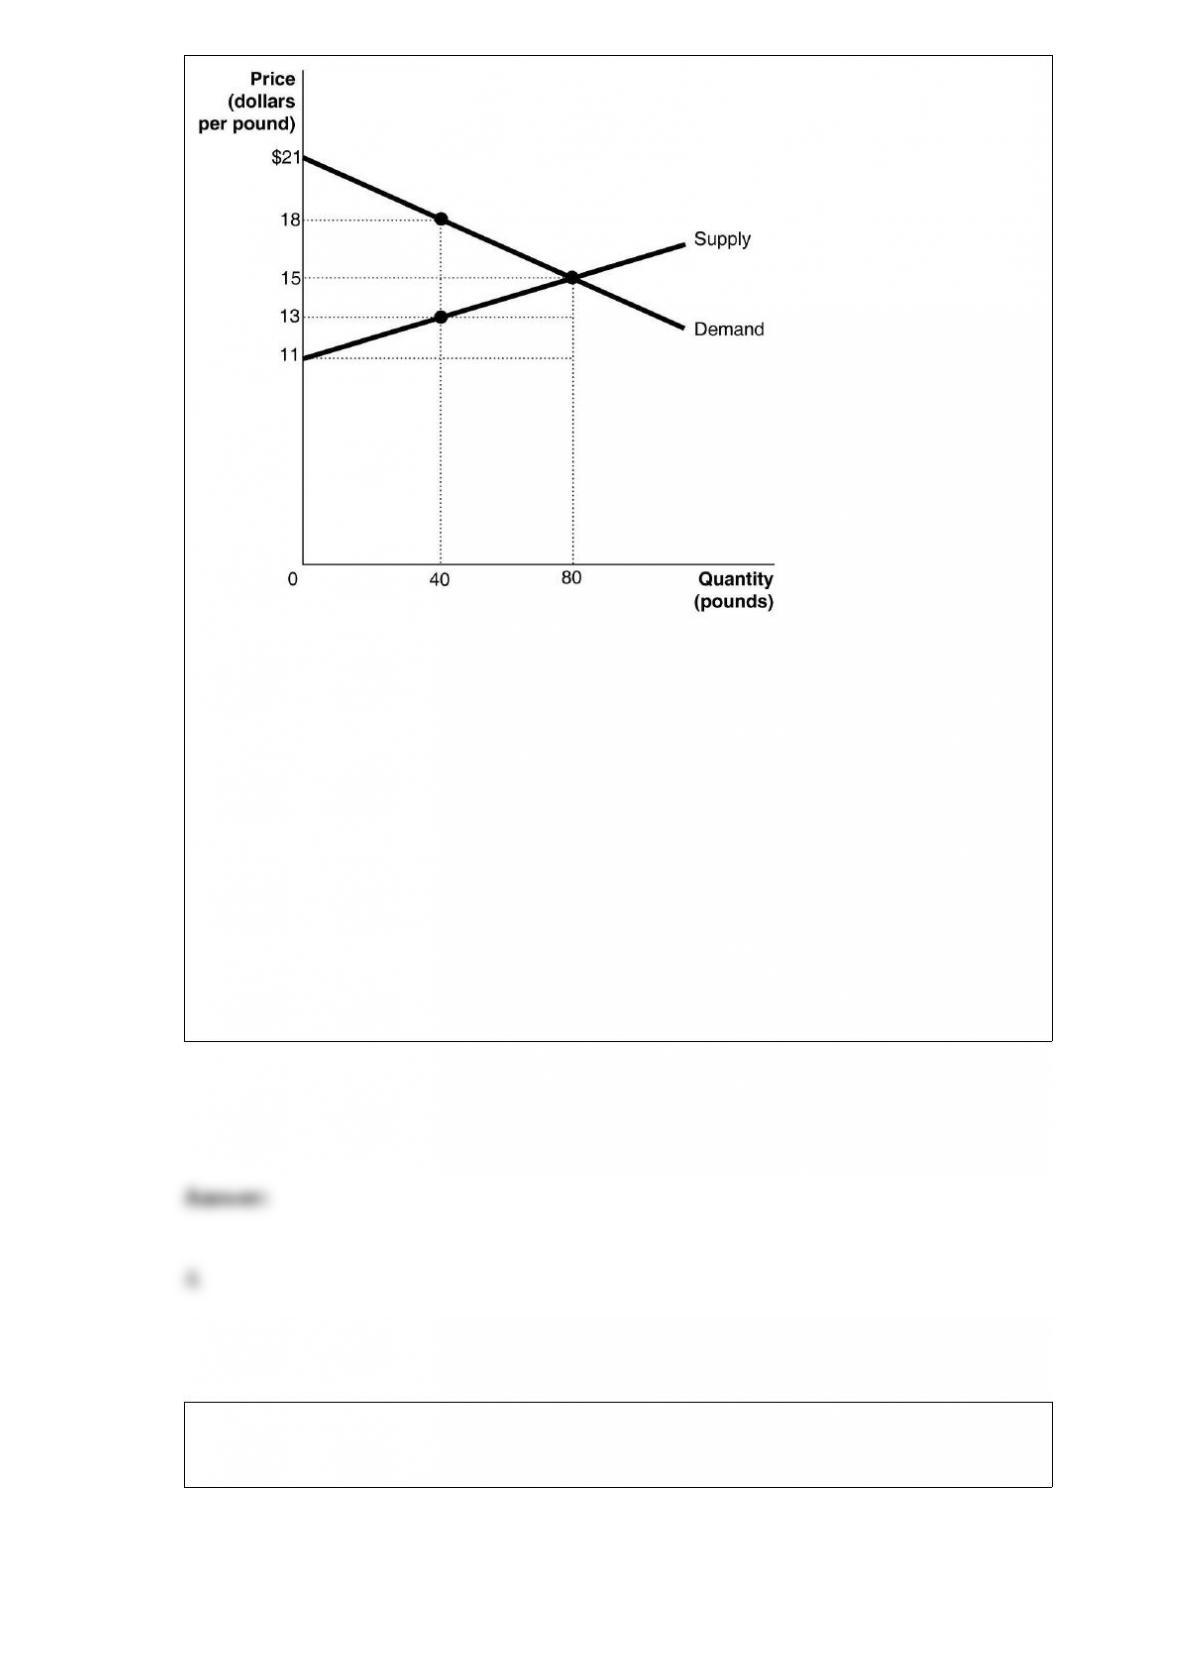
Figure 4-3 shows the market for tiger shrimp. The market is initially in equilibrium at a
price of $15 and a quantity of 80. Now suppose producers decide to cut output to 40in
order to raise the price to $18.
Refer to Figure 4-3. What is the value of the deadweight loss at the equilibrium price
of $15?
A) $0
B) $40
C) $60
D) $100
Figure 3-2
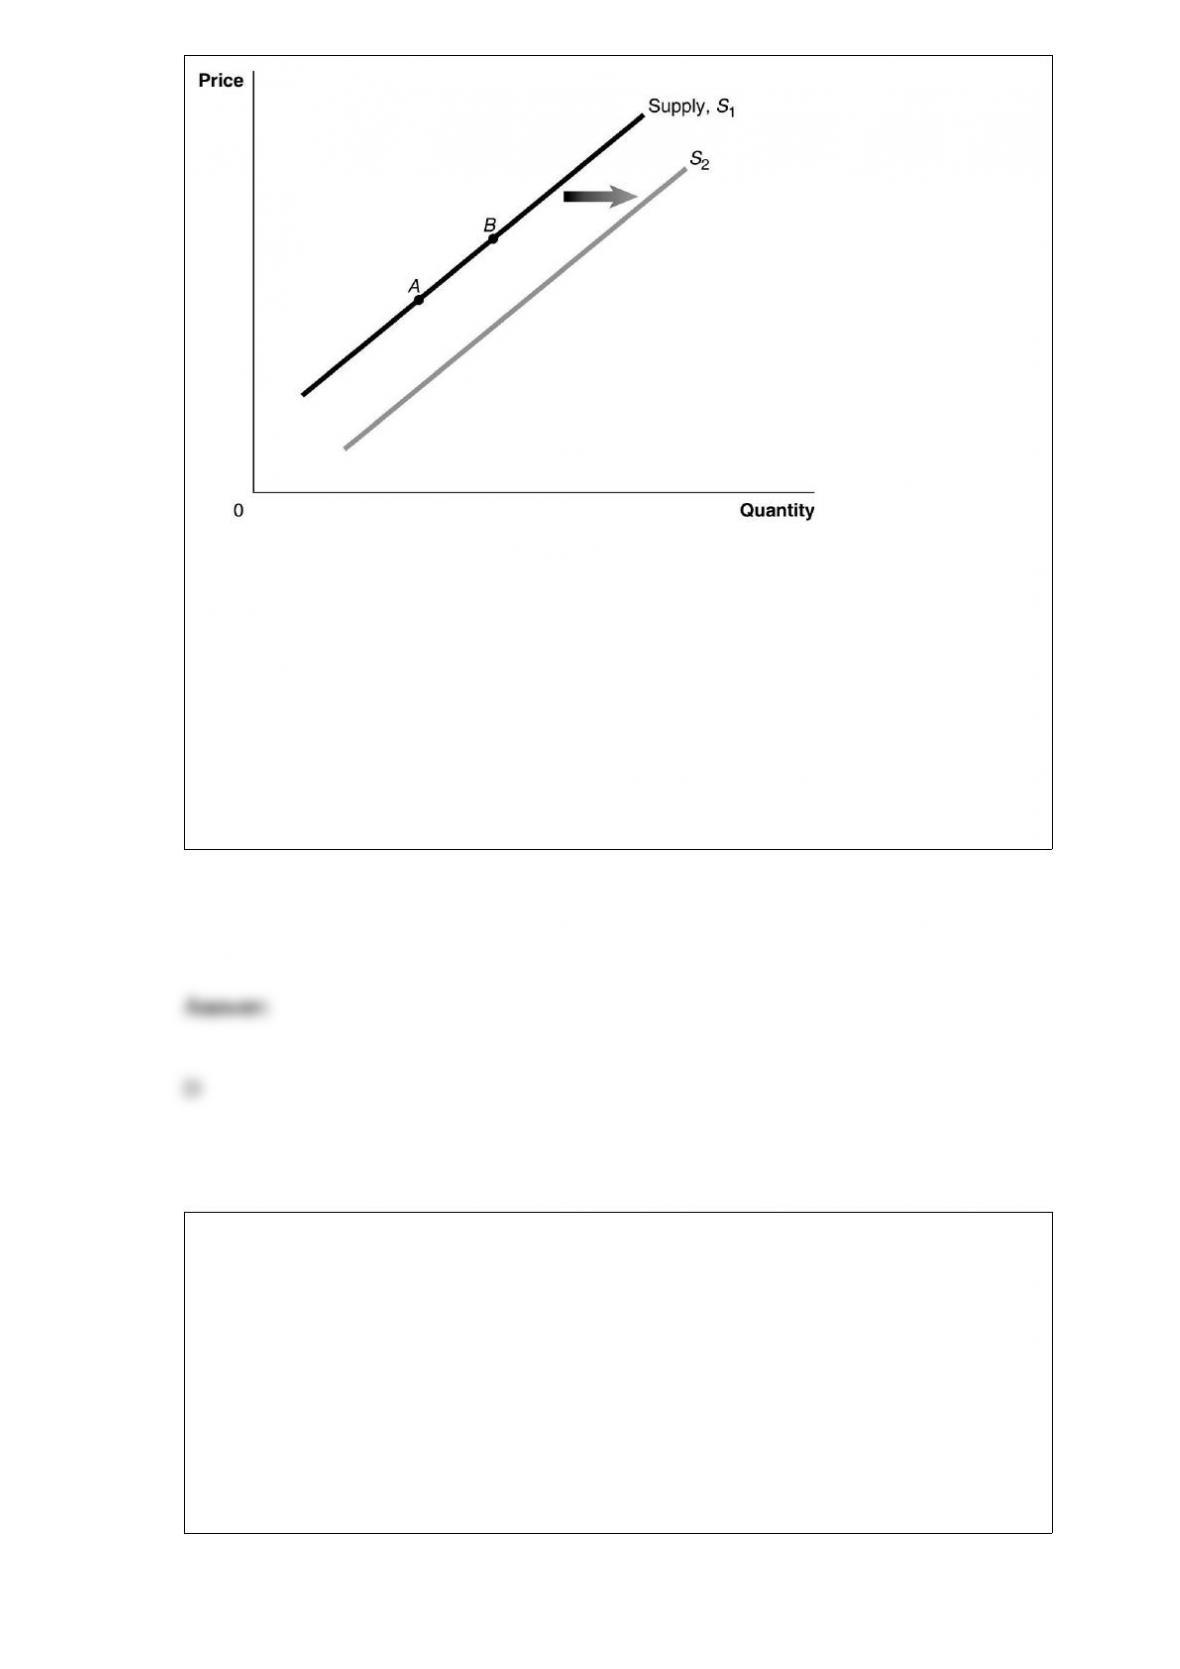
Refer to Figure 3-2. An increase in price of inputs would be represented by a
movement from
A) A to B.
B) B to A.
C) S1 to S2.
D) S2 to S1.
A product is considered to be rivalrous if
A) you can keep those who did not pay for the item from enjoying its benefits.
B) you cannot keep those who did not pay for the item from enjoying its benefits.
C) your consumption of the product reduces the quantity available for others to
consume.
D) it is jointly owned by all members of a community.

Many economists do not believe that network externalities lock consumers into the use
of products that have technology inferior to other, similar products. These economists
believe that
A) consumers are always rational.
B) in practice, the gains from using a superior technology exceed the losses consumers
incur from switching costs.
C) there is no good evidence that switching costs exist.
D) the government will prevent products with inferior technology from being sold to
consumers.
Allocative efficiency best explains ________, and productive efficiency best explains
________.
A) how something will be produced; when something will be produced
B) when something will be produced; why something will be produced
C) why something will be produced; what will be produced
D) what will be produced; how something will be produced

Economists James Buchanan and Gordon Tullock are well-known for developing
A) the impossibility theorem.
B) the voting paradox.
C) the public choice model.
D) the concept of government failure.
Is a monopolistically competitive firm allocatively efficient?
A) No, because it does not produce at minimum average total cost.
B) Yes, because it produces where marginal cost equals marginal revenue.
C) No, because price is greater than marginal cost.
D) Yes, because price equals average total cost.
As a firm moves to higher isocost lines
A) its profits increase.
B) its revenue increases.
C) its input price ratio increases.
D) its total cost increases.
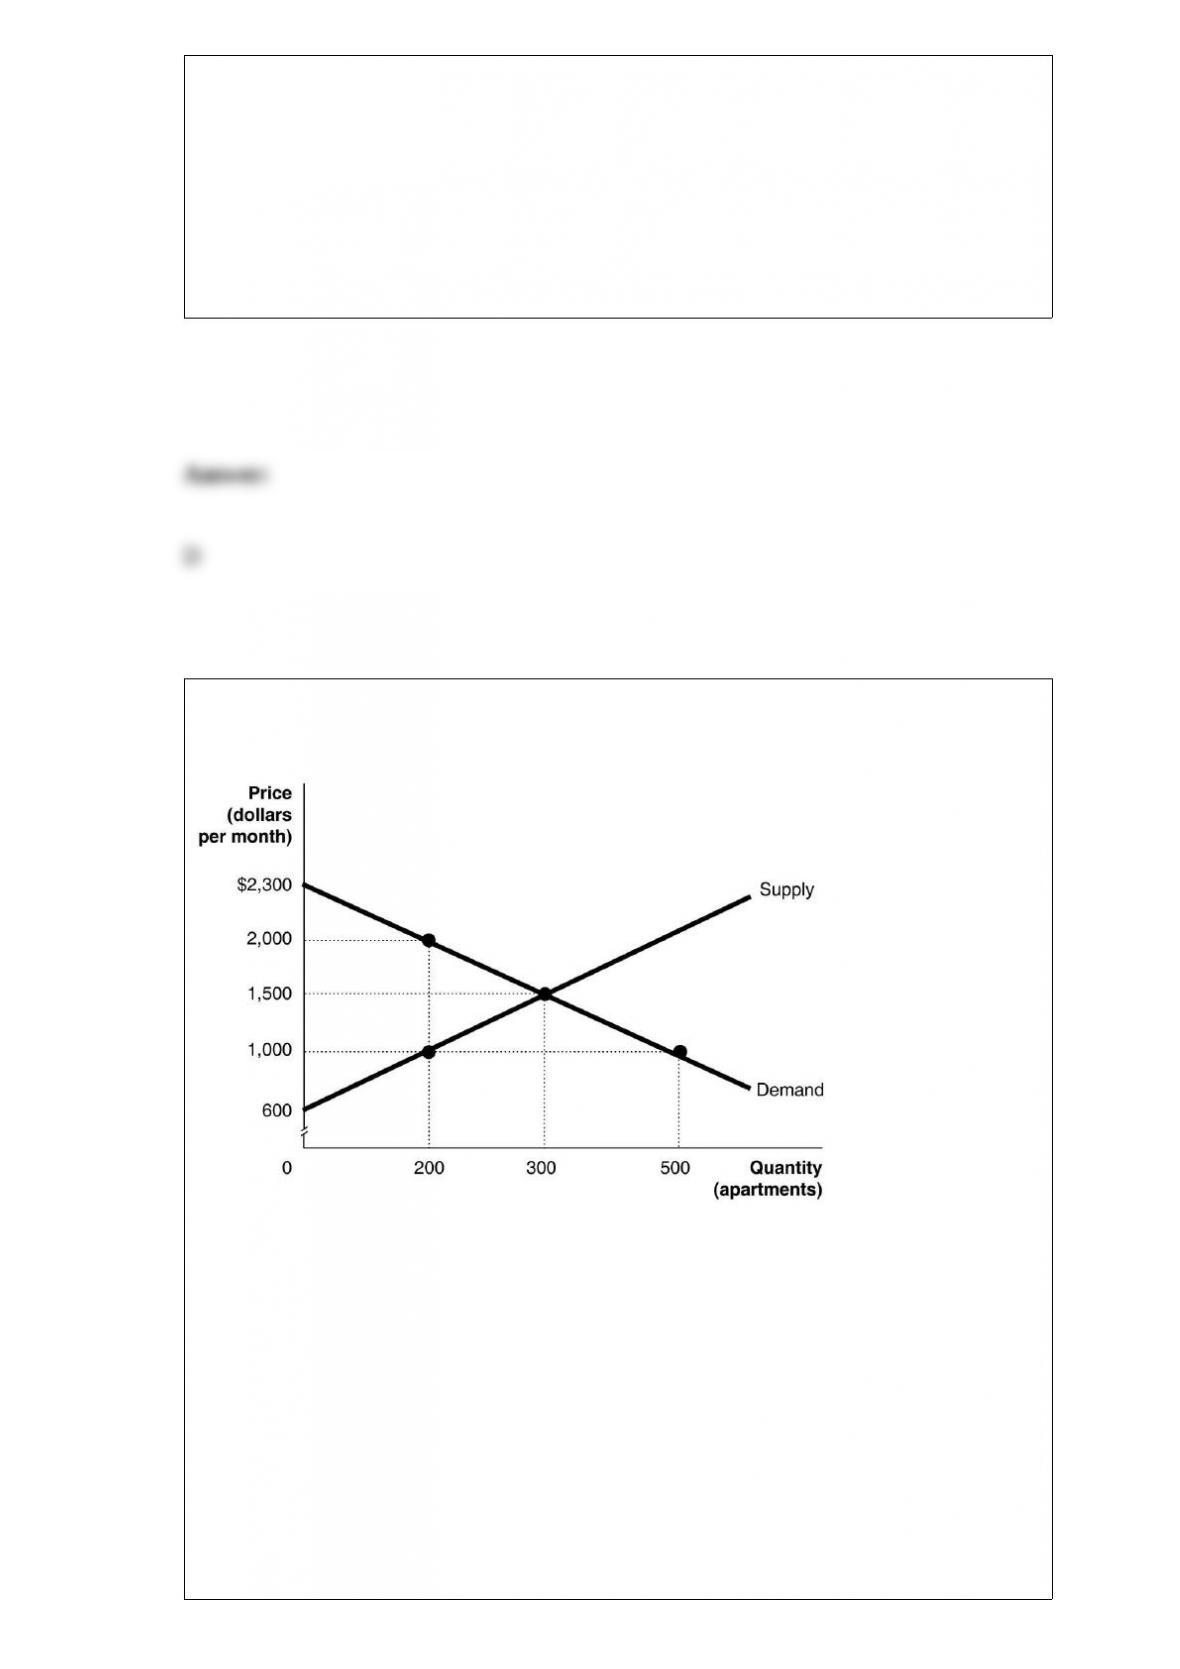
Figure 4-5
Figure 4-5 shows the market for apartments in Springfield. Recently, the government
imposed a rent ceiling of $1,000 per month.
Refer to Figure 4-5. Suppose that instead of a rent ceiling, the government imposed a
price floor of $2,000 per month for apartments. What is the value of producer surplus
after the imposition of the price floor?
A) $40,000
B) $240,000
C) $270,000
D) $290,000
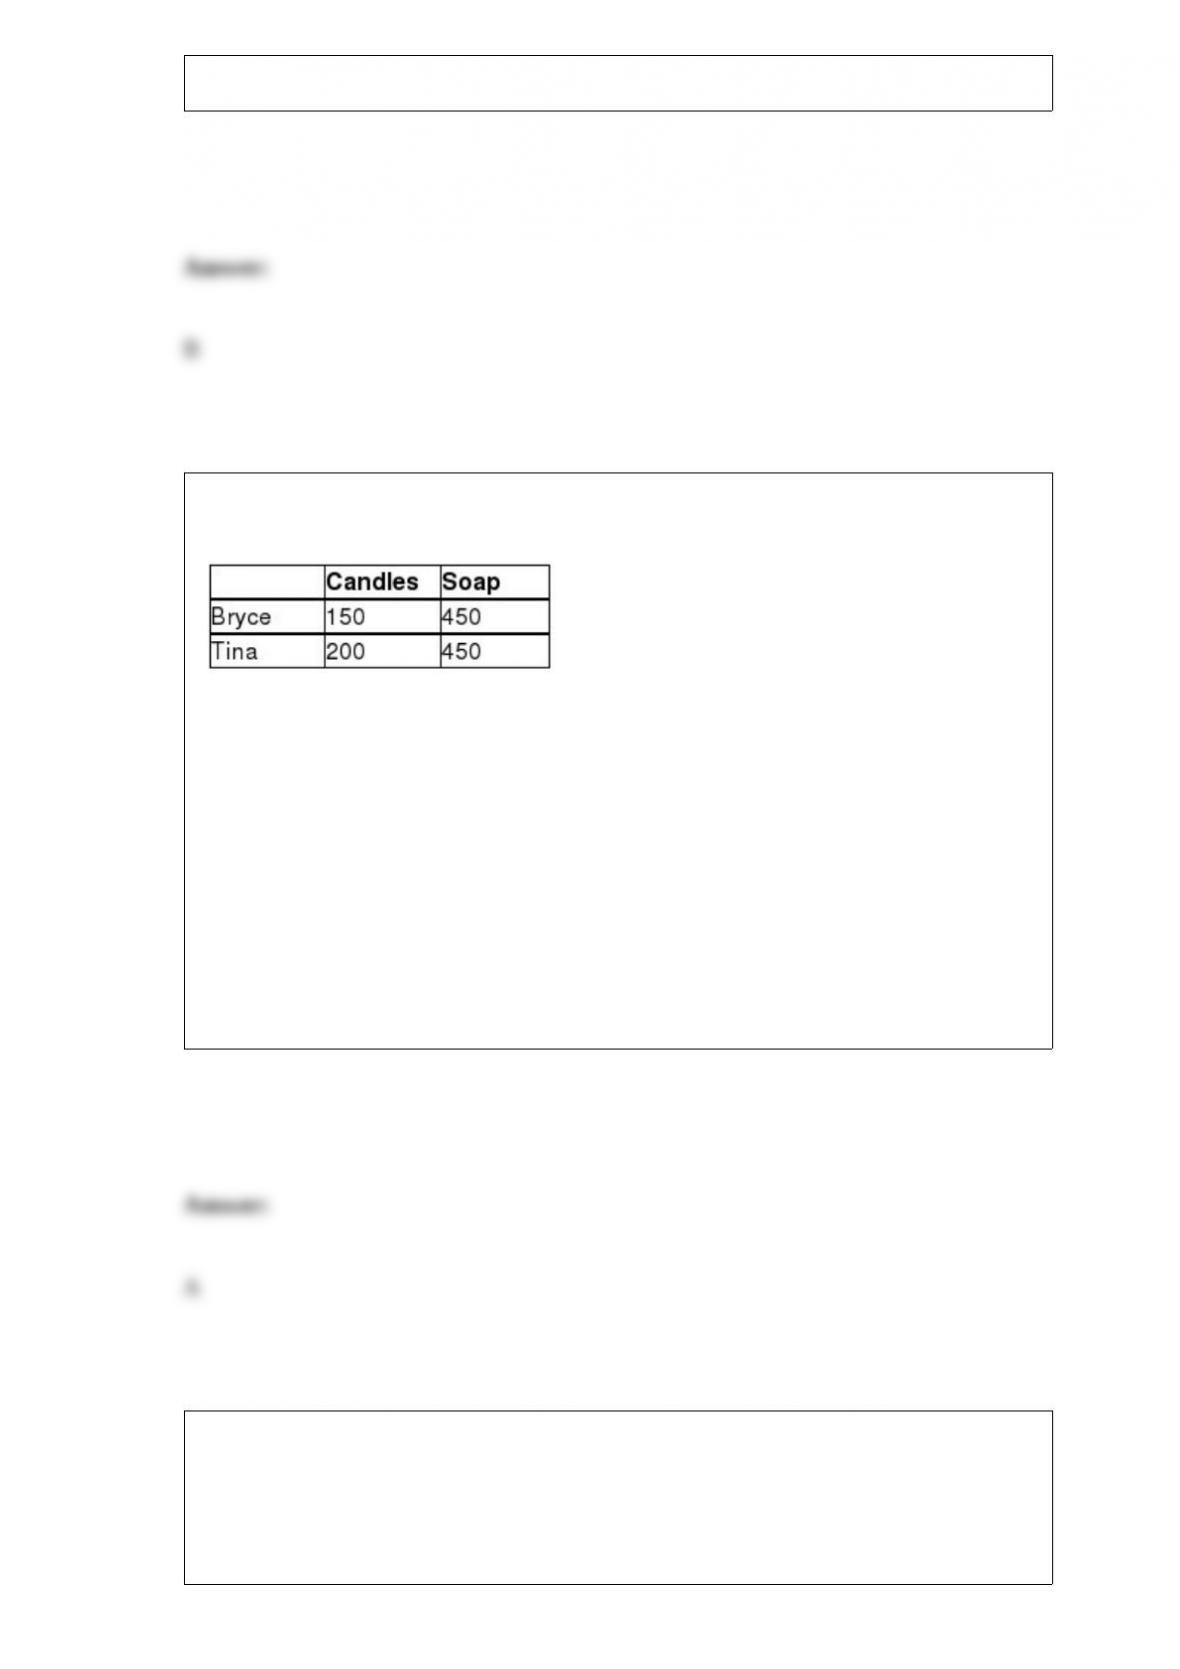
Table 9-3
Bryce and Tina are artisans who produce homemade candles and soap. Table 9-3 lists
the number of candles and bars of soap Bryce and Tina can each produce in one month.
Refer to Table 9-3. Select the statement that accurately interprets the data in the table.
A) Tina has a comparative advantage in making candles.
B) Bryce has an absolute advantage in making soap.
C) Bryce has a comparative advantage in making candles.
D) Bryce has a comparative advantage in making candles and making soap.
Table 9-6
Production and
Consumption Production
Without Trade With Trade
Denmark and Belize can produce both clocks and hats. Table 9-6 shows the production
and consumption quantities without trade, and the production numbers with trade.
Refer to Table 9-6. If the actual terms of trade are 1 hat for 1.8 clocks and 150 hats are
traded, how many hats will Denmark consume?
A) 150
B) 180
C) 270
D) 400
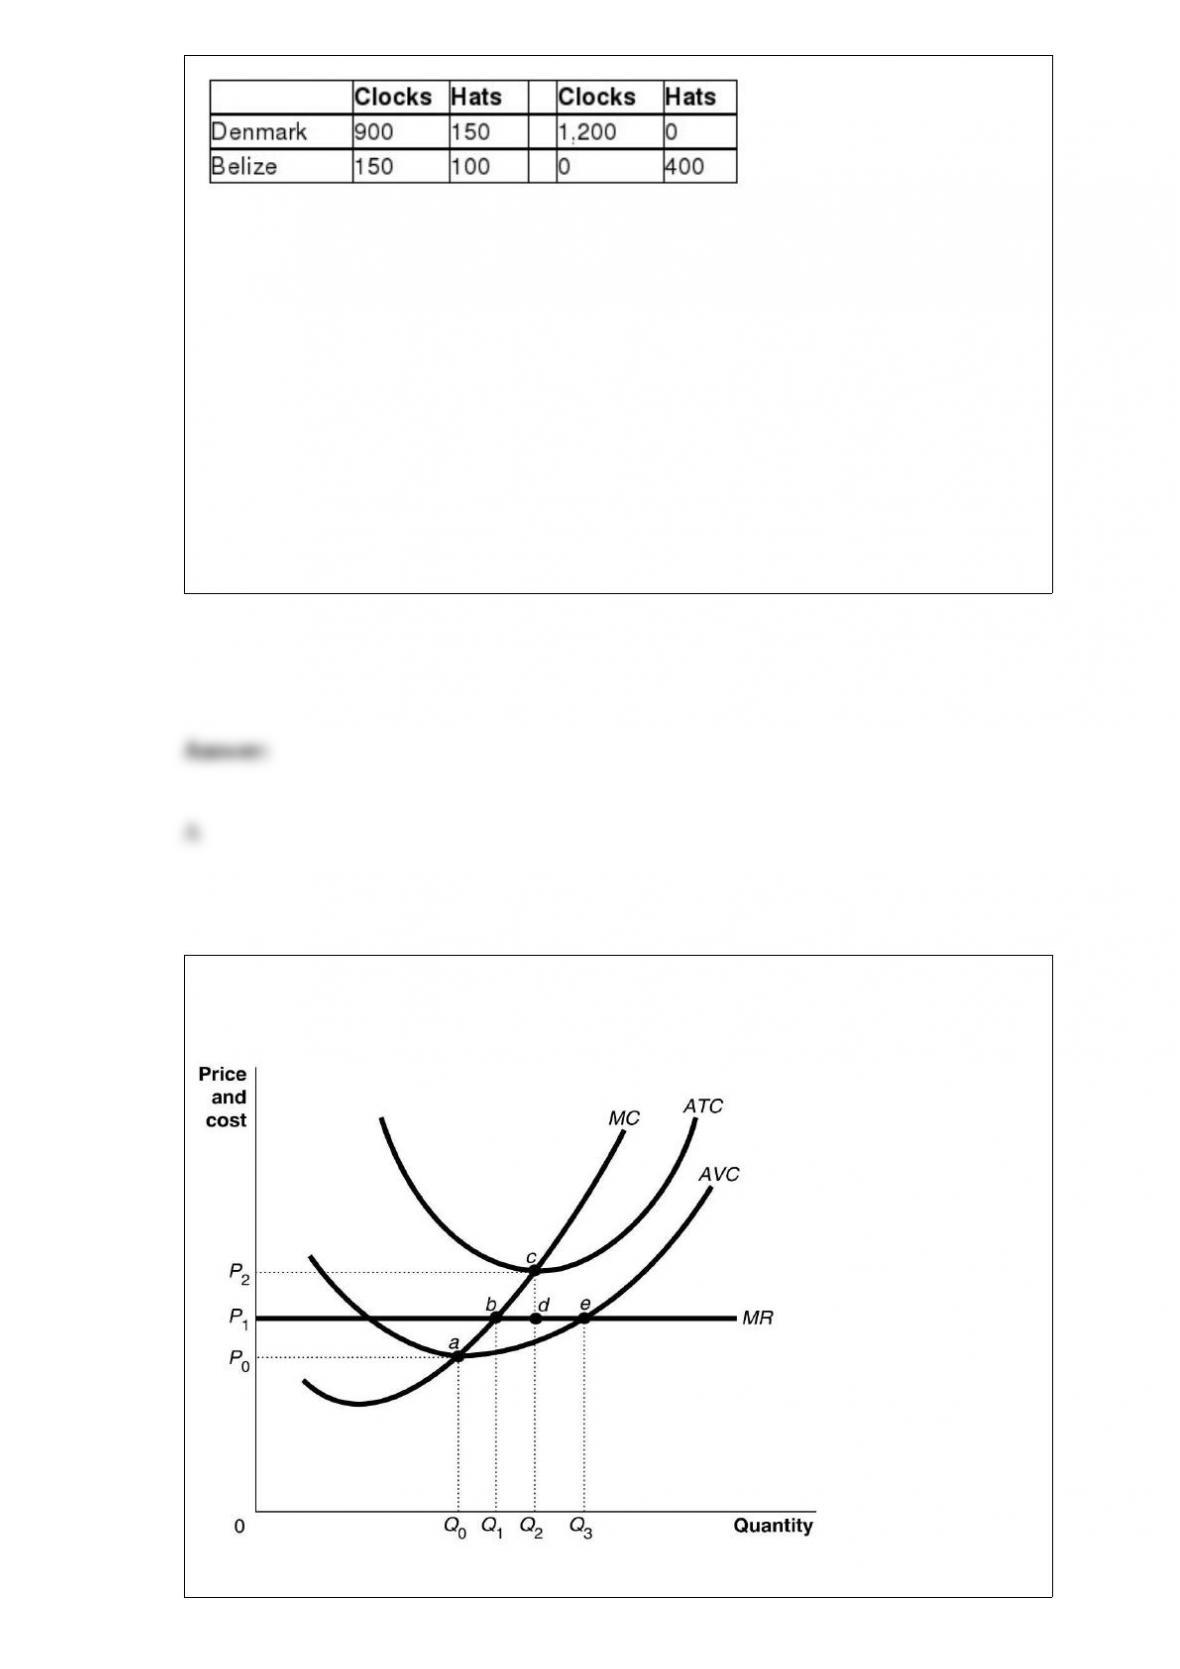
Figure 12-13
Refer to Figure 12-13. Suppose the prevailing price is P1 and the firm is currently

producing its loss-minimizing quantity. In the long-run equilibrium
A) there will be fewer firms in the industry and total industry output decreases.
B) there will be more firms in the industry and total industry output increases.
C) there will be fewer firms in the industry but total industry output increases.
D) there will be more firms in the industry and total industry output remains constant.
The ________ effect refers to the change in quantity demanded for a good that results
from the effect of a change in the good’s price on consumer’s purchasing power.
A) ceteris paribus
B) population
C) substitution
D) income
Which of the following would result in a positive externality?
A) A local government establishes a price ceiling on rental apartments.
B) An electric utility burns coal that causes acid rain.

C) Medical research results in a cure for malaria.
D) McDonald’s adds new fat-free items to its menu.
A cooperative equilibrium results when firms
A) choose the best strategy regardless of what other players do.
B) choose the strategy that maximizes the total game payoff.
C) choose the strategy that minimizes the payoff to other players.
D) choose a strategy by random chance.
Figure 2-10
Figure 2-10 shows the production possibilities frontiers for Tahiti and Bora Bora. Each
country produces two goods, milk and honey.
Refer to Figure 2-10. Which country has a comparative advantage in the production of
milk?
A) Bora Bora
B) They have equal productive abilities.
C) Tahiti
D) neither country
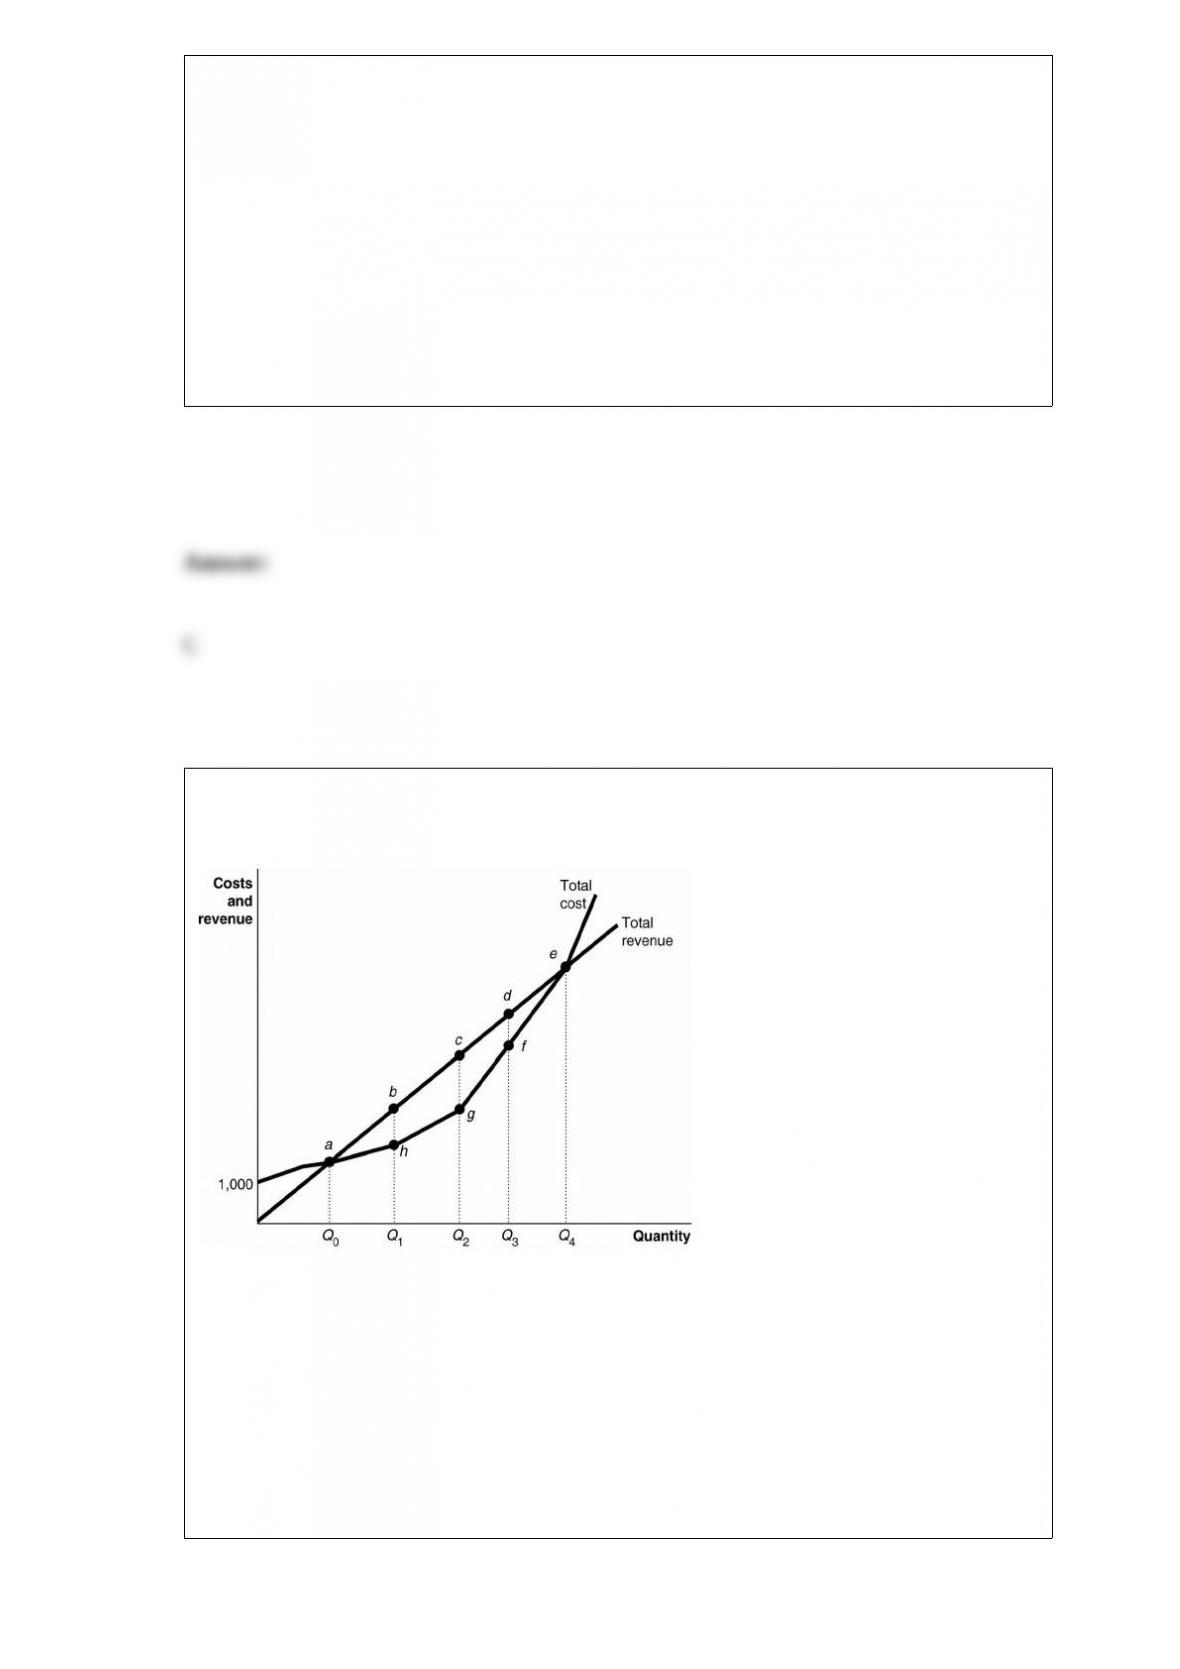
Figure 12-2
Refer to Figure 12-2. What happens if the firm produces more than Q4 units?
A) Its profit increases.
B) It makes a loss.
C) Its total revenue is increasing faster than its total cost.
D) It could make a profit or a loss depending on what happens to demand.