Figure: Monopolistic Competition VI
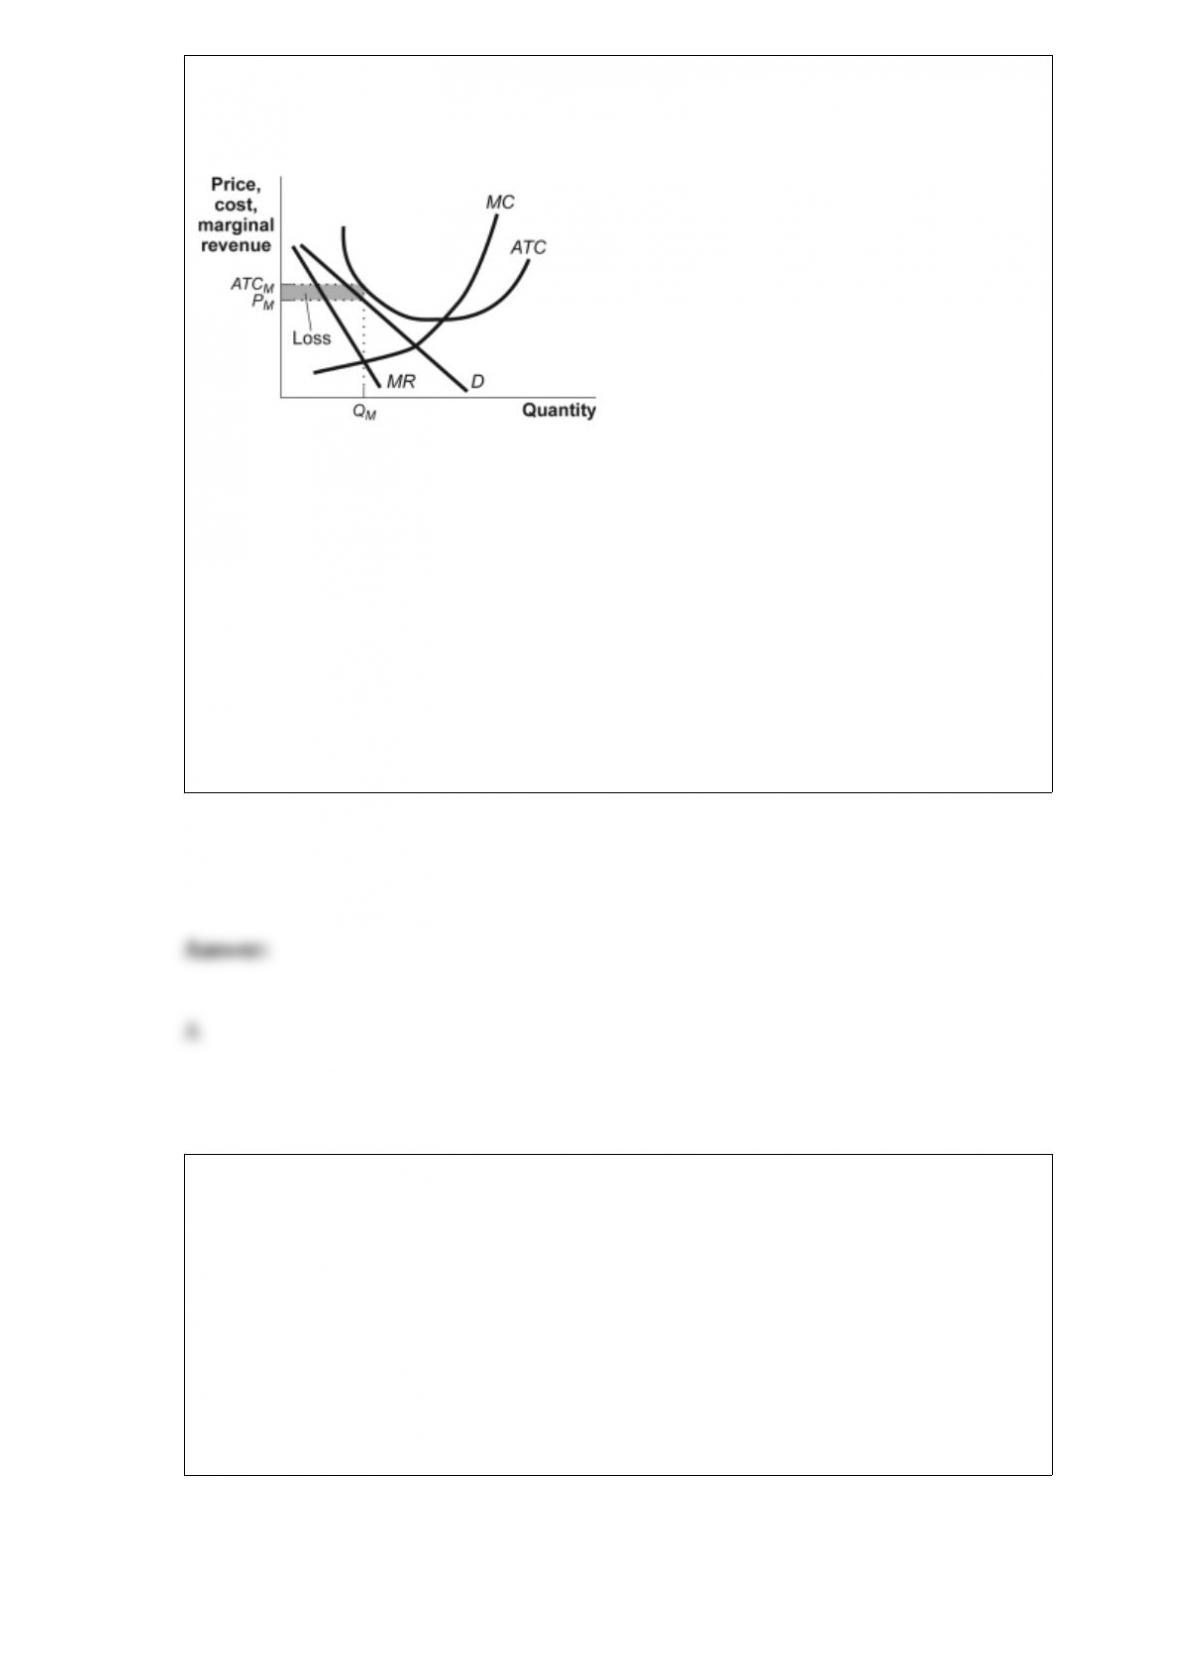
(Figure: Monopolistic Competition VI) The figure Monopolistic Competition VI
illustrates a firm in the _____; in the _____, the demand and marginal revenue curves
will shift to the _____.
A) short run; long run; right
B) long run; short run; left
C) short run; long run; left
D) long run; short run; right
In contrast with perfect competition, a monopolist:
A) produces more at a lower price.
B) produces where MR > MC, and a perfectly competitively firm produces where P =
MC.
C) may have economic profits in the long run.
D) earns zero economic profits in the long run.
Medicaid is funded by:
A) private charities.
B) the federal government only.
C) state governments only.
D) federal and state governments.
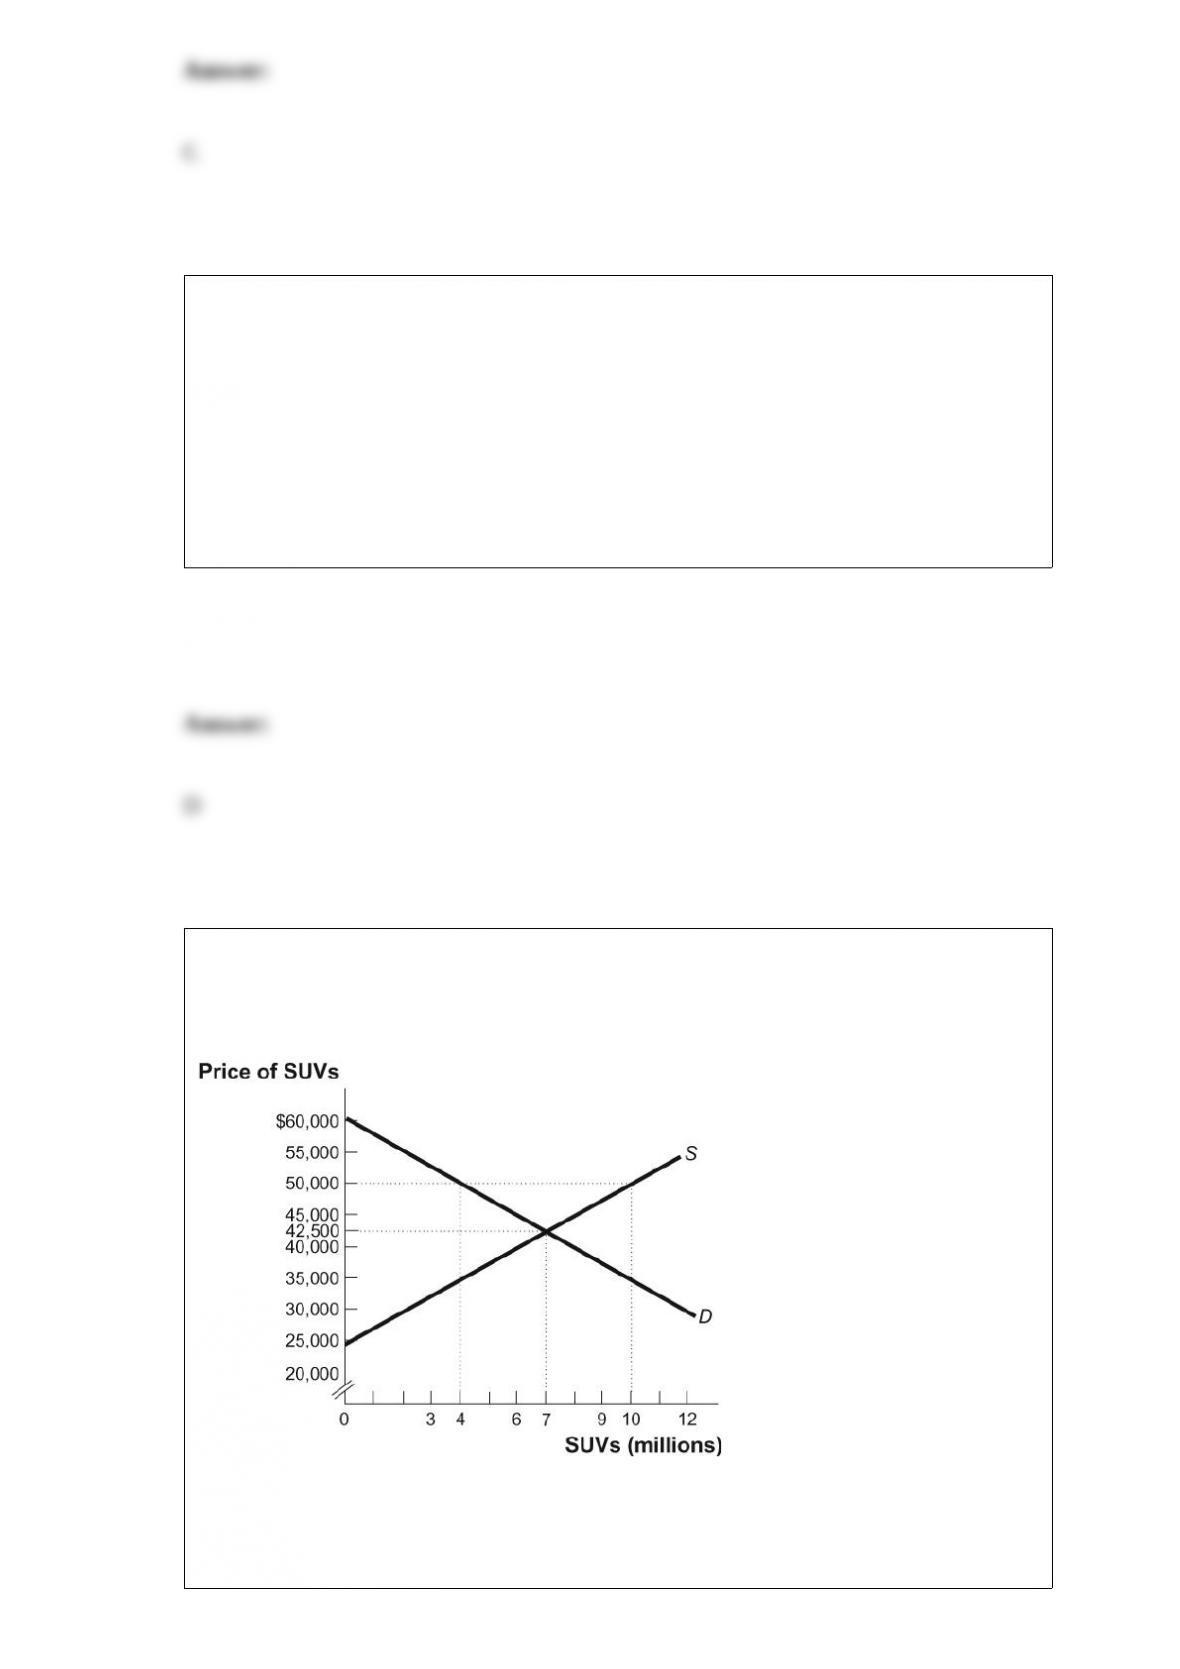
Figure: The Domestic Supply and Demand for SUVs in the United States
(Figure: The Domestic Supply and Demand for SUVs in the United States) Look at the
figure The Domestic Supply and Demand for SUVs in the United States. Suppose the
world price equals $50,000 and there is free trade. The United States would _____

SUVs.
A) import 6 million
B) export 6 million
C) export 2 million
D) import 2 million
In the market for computers, if the demand curve is elastic and the price of a computer
decreases, we expect total revenue to _____. If the demand curve is inelastic and the
price of a computer decreases, we expect total revenue to _____.
A) increase; decrease
B) increase; increase
C) decrease; increase
D) decrease; decrease
Because people usually exploit opportunities to make themselves better off, if the price
of gasoline rises and stays high for an extended period, we expect people to:
A) increase the number of miles they drive.
B) buy larger and less fuel-efficient cars.
C) use more public transportation.
D) ride their bicycles less.
Figure: Traffic Lights in Plymouth
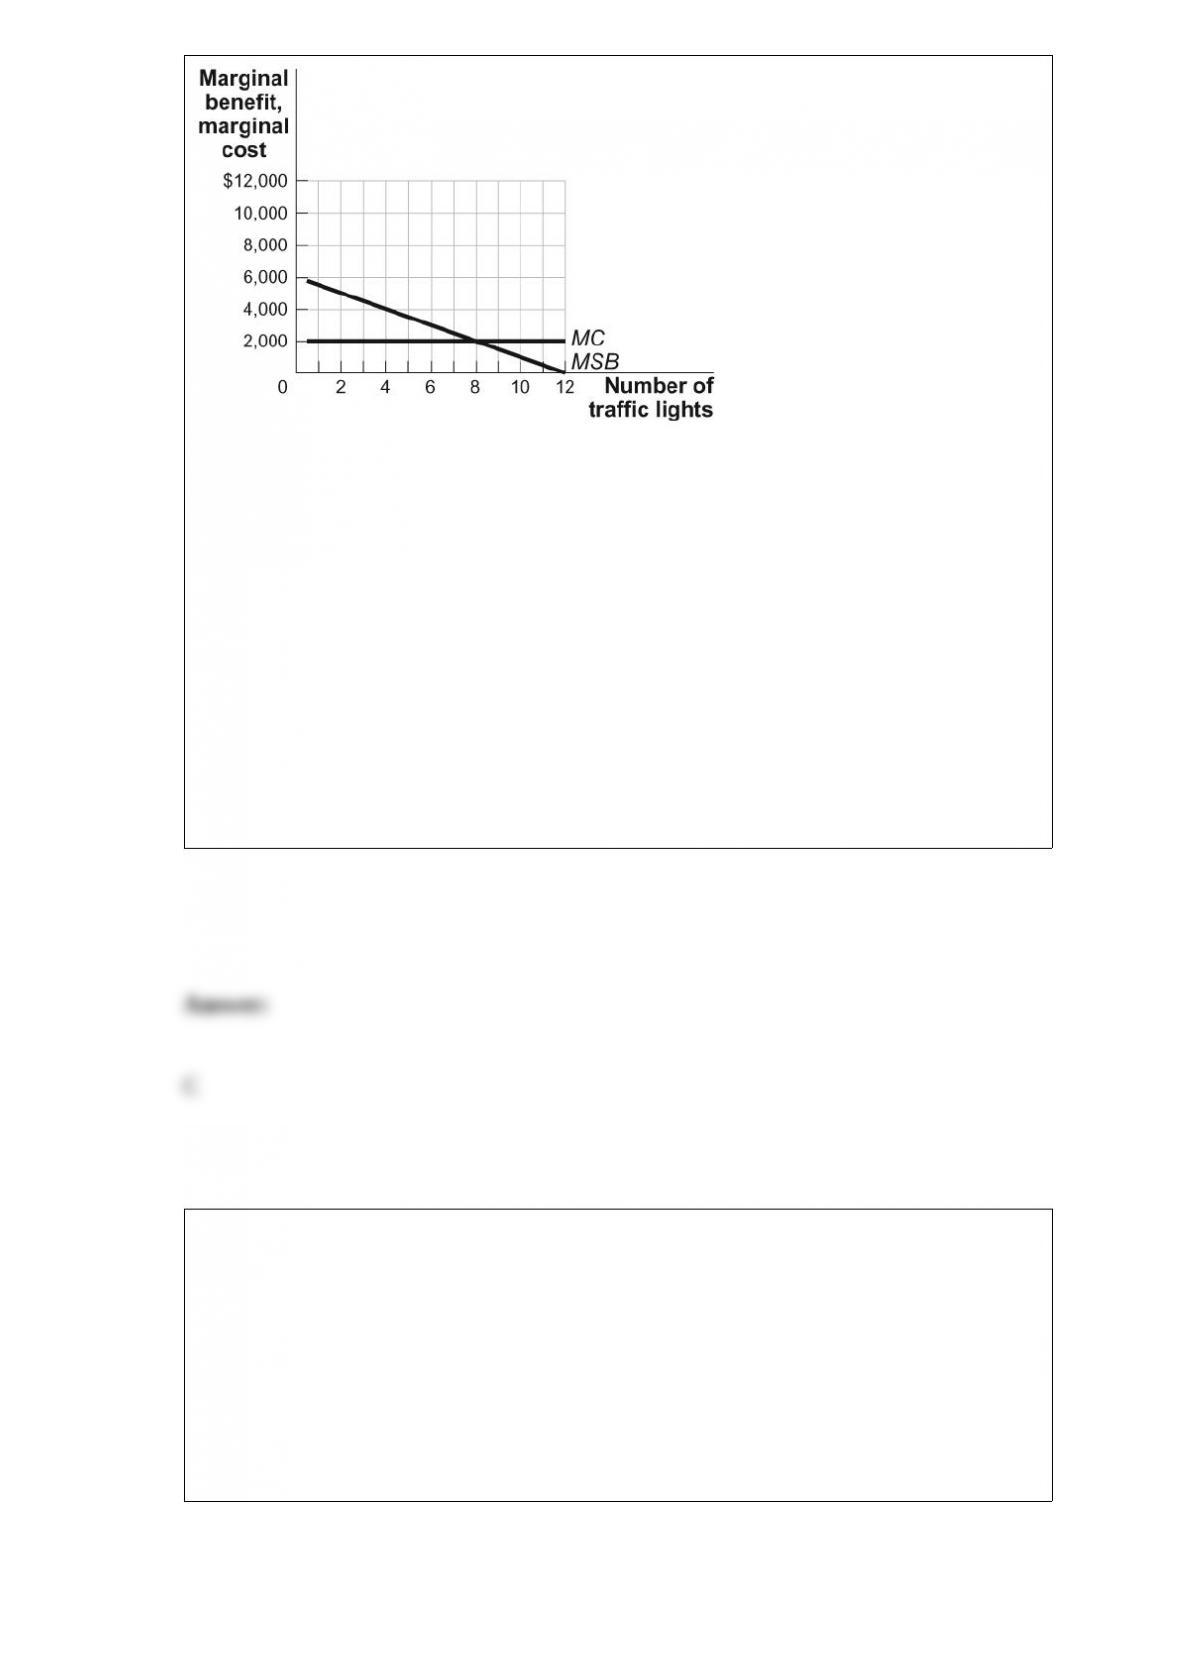
(Figure: Traffic Lights in Plymouth) Look at the figure Traffic Lights in Plymouth.
Plymouth has 1,000 residents. Each of the residents has the same individual marginal
benefit per traffic light. If the town’s population doubles and the new residents share the
identical individual marginal benefit of the existing residents, the socially efficient
quantity of traffic lights will:
A) stay the same.
B) fall.
C) rise.
D) fall to zero.
Indifference curves that exhibit a diminishing marginal rate of substitution are:
A) concave to the origin.
B) upward-sloping over part of their length.
C) downward-sloping straight lines.
D) convex to the origin.
The key distinction between a factor of production and an input is that:
A) an input is an enduring source of income, but a factor of production is used up in
production.
B) a factor of production earns income from selling its services over and over again, but
an input cannot.
C) an input earns income from selling its services over and over again, but a factor of
production cannot.
D) a factor of production has limited earning potential.
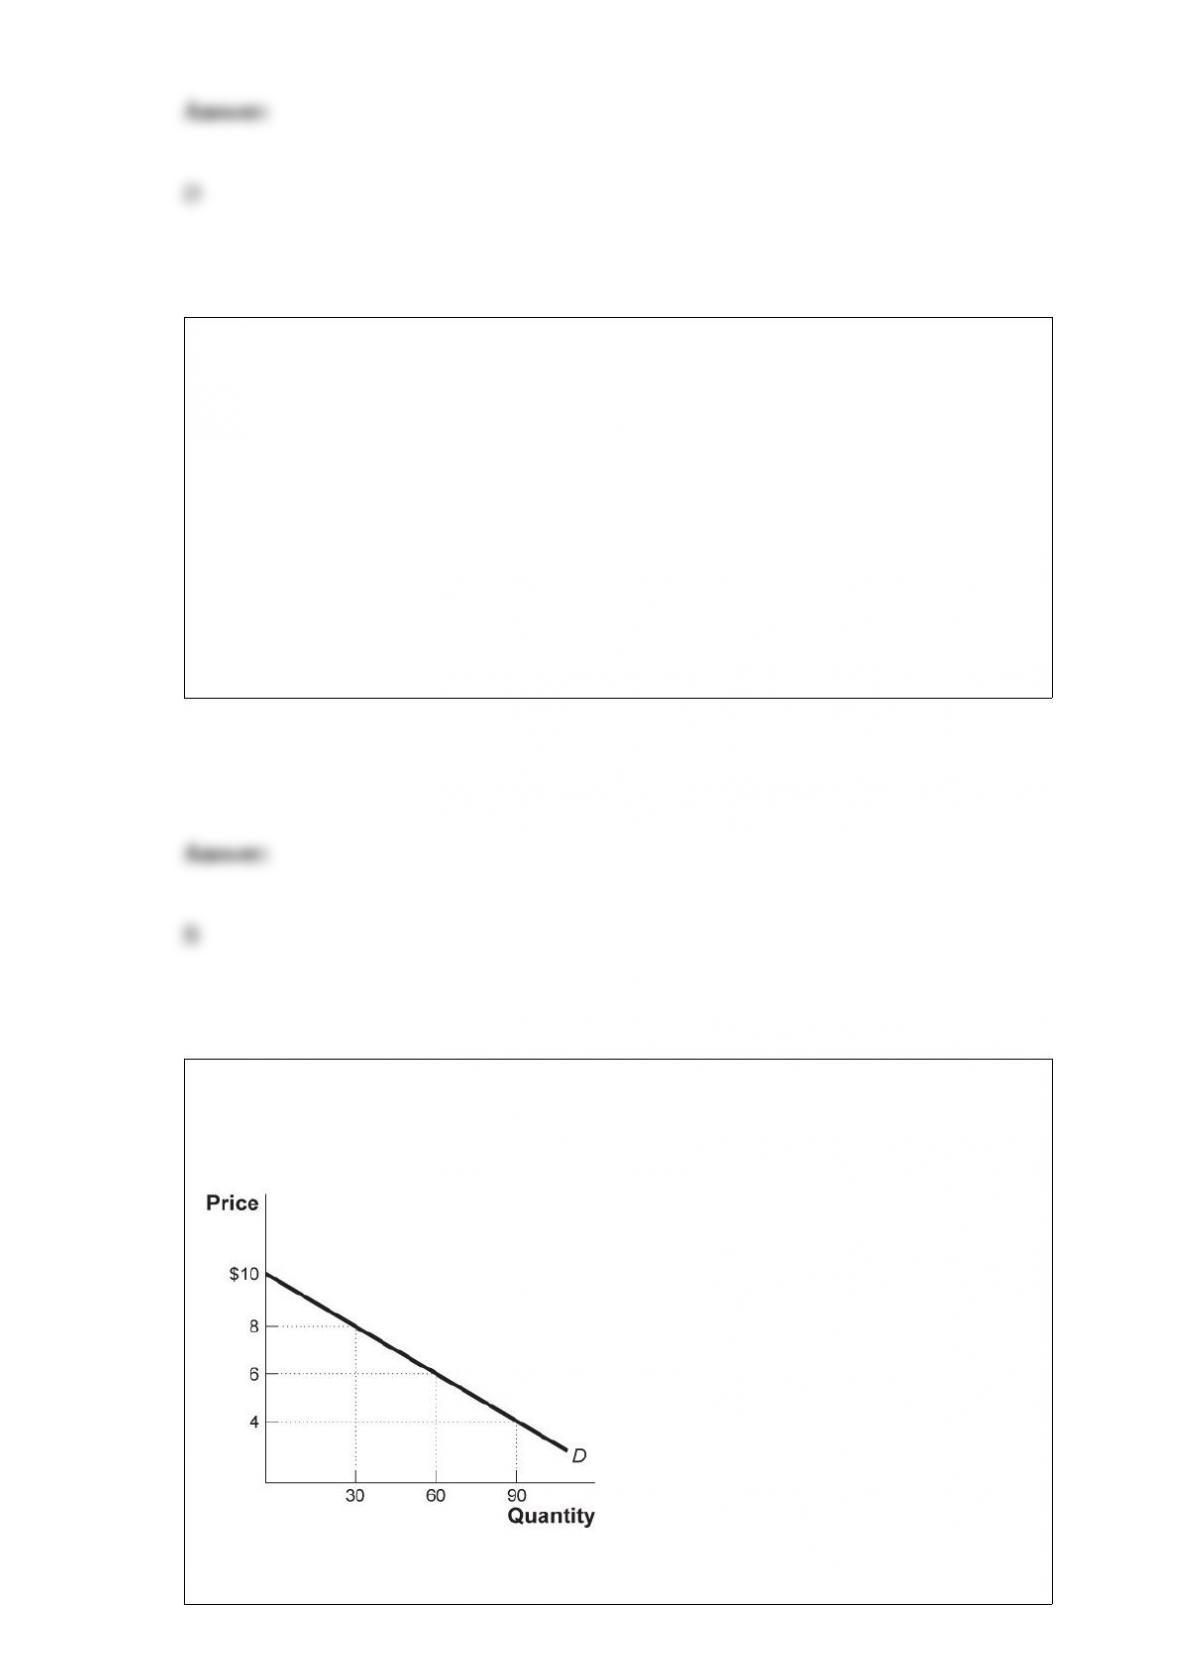
Figure: The Demand for e-Books
(Figure: The Demand for e-Books) Look at the figure The Demand for e-Books. What

is the price elasticity of demand (by the midpoint method) when the price increases
from $6 to $8?
A) 0.55
B) 0.5
C) 2.33
D) 0.67
A quota is:
A) a quantity restriction.
B) a price control.
C) a consumer surplus.
D) a means to combat black markets.
Bangladesh exports shirts, the making of which is labor-intensive, to the United States.
The likely source of Bangladesh’s comparative advantage in shirts is:
A) a hotter climate, which makes it possible to produce shirts outdoors, eliminating the
need for factory buildings and hence reducing costs.

B) superior production technology.
C) that in comparison with the United States, Bangladesh is a labor-abundant country.
D) the higher labor productivity in Bangladesh.
Suppose that more police and security workers become aware that wearing bulletproof
vests can protect them from injury and decide to start wearing bulletproof vests. At the
same time, the price of ceramics used to produce the vests falls. The equilibrium price
of bulletproof vests _____ and the equilibrium quantity produced _____.
A) increases; increases
B) decreases; decreases
C) probably changes, but in an ambiguous direction; probably changes, but in an
ambiguous direction
D) probably changes, but in an ambiguous direction; increases
Figure: Production Possibilities and Circular-Flow Diagram
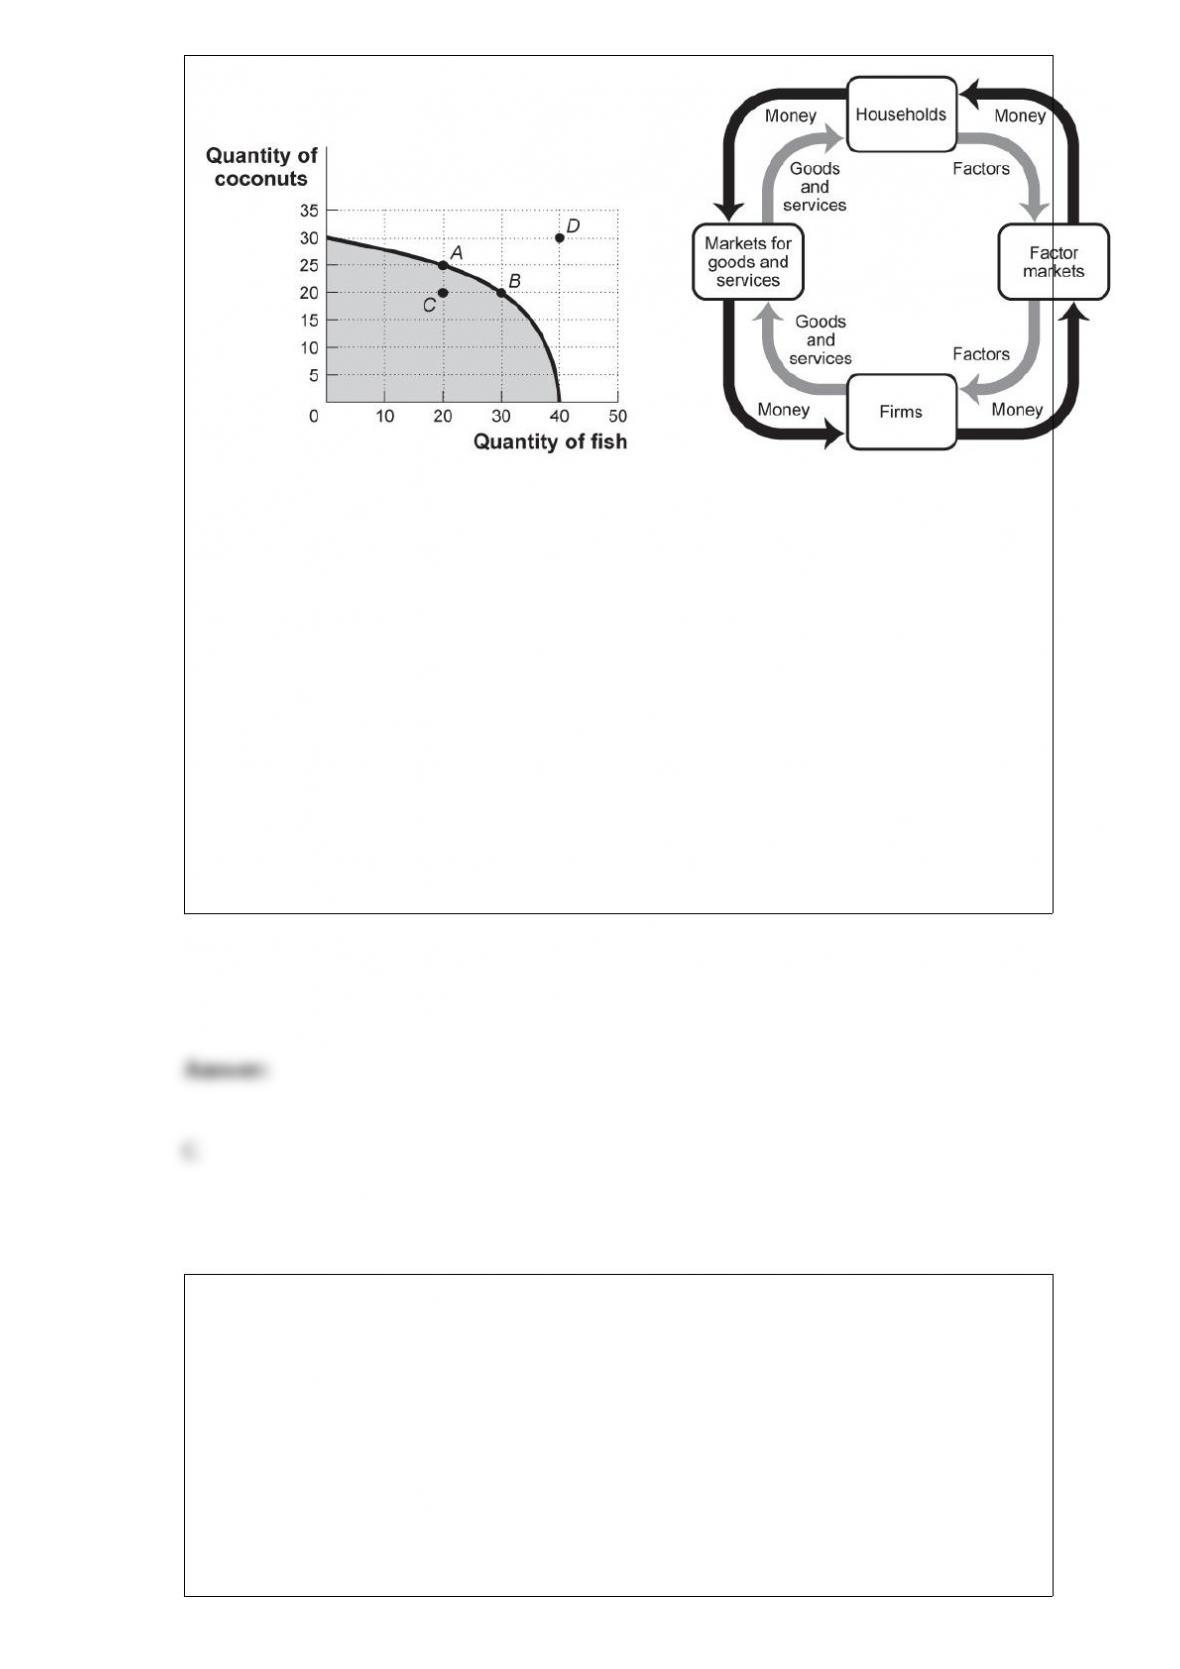
(Figure: Production Possibilities and Circular-Flow Diagram) Look at the figure
Production Possibilities and Circular-Flow Diagram. Assume the two figures represent
the same economy. Suppose that in the circular-flow diagram there is a significant
decrease in the amount of labor flowing to the firms that produce coconuts. If all other
variables remain unchanged, this adjustment in the economy would be best represented
in the production possibilities figure by a move from point A toward:
A) point A (no movement).
B) point B (a decrease in coconut production and an increase in fish production).
C) point C (a decrease in coconut production).
D) point D (an outward shift of the entire curve).
Suppose that some firms in a perfectly competitive industry earn negative economic
profits. In the long run, the:
A) short-run industry supply curve will not shift.
B) short-run industry supply curve will shift to the left.
C) number of firms in the industry will not change.
D) number of firms in the industry will increase.
A curve that shows the quantity of a good or service supplied at various prices after all
long-run adjustments to a price change have been completed is a long-run _____ curve.
A) marginal revenue
B) marginal cost
C) industry supply
D) production

A wage _____ reduces the quantity of labor supplied through the _____ effect.
A) decrease; income
B) increase; substitution
C) increase; income
D) decrease; complement
If the marginal benefit received from consuming a good is greater than the marginal
cost of production:
A) society’s well-being can be improved if production increases.
B) society’s well-being can be improved if production decreases.
C) society’s well-being cannot be improved by changing production.
D) the market is producing too much of the good.
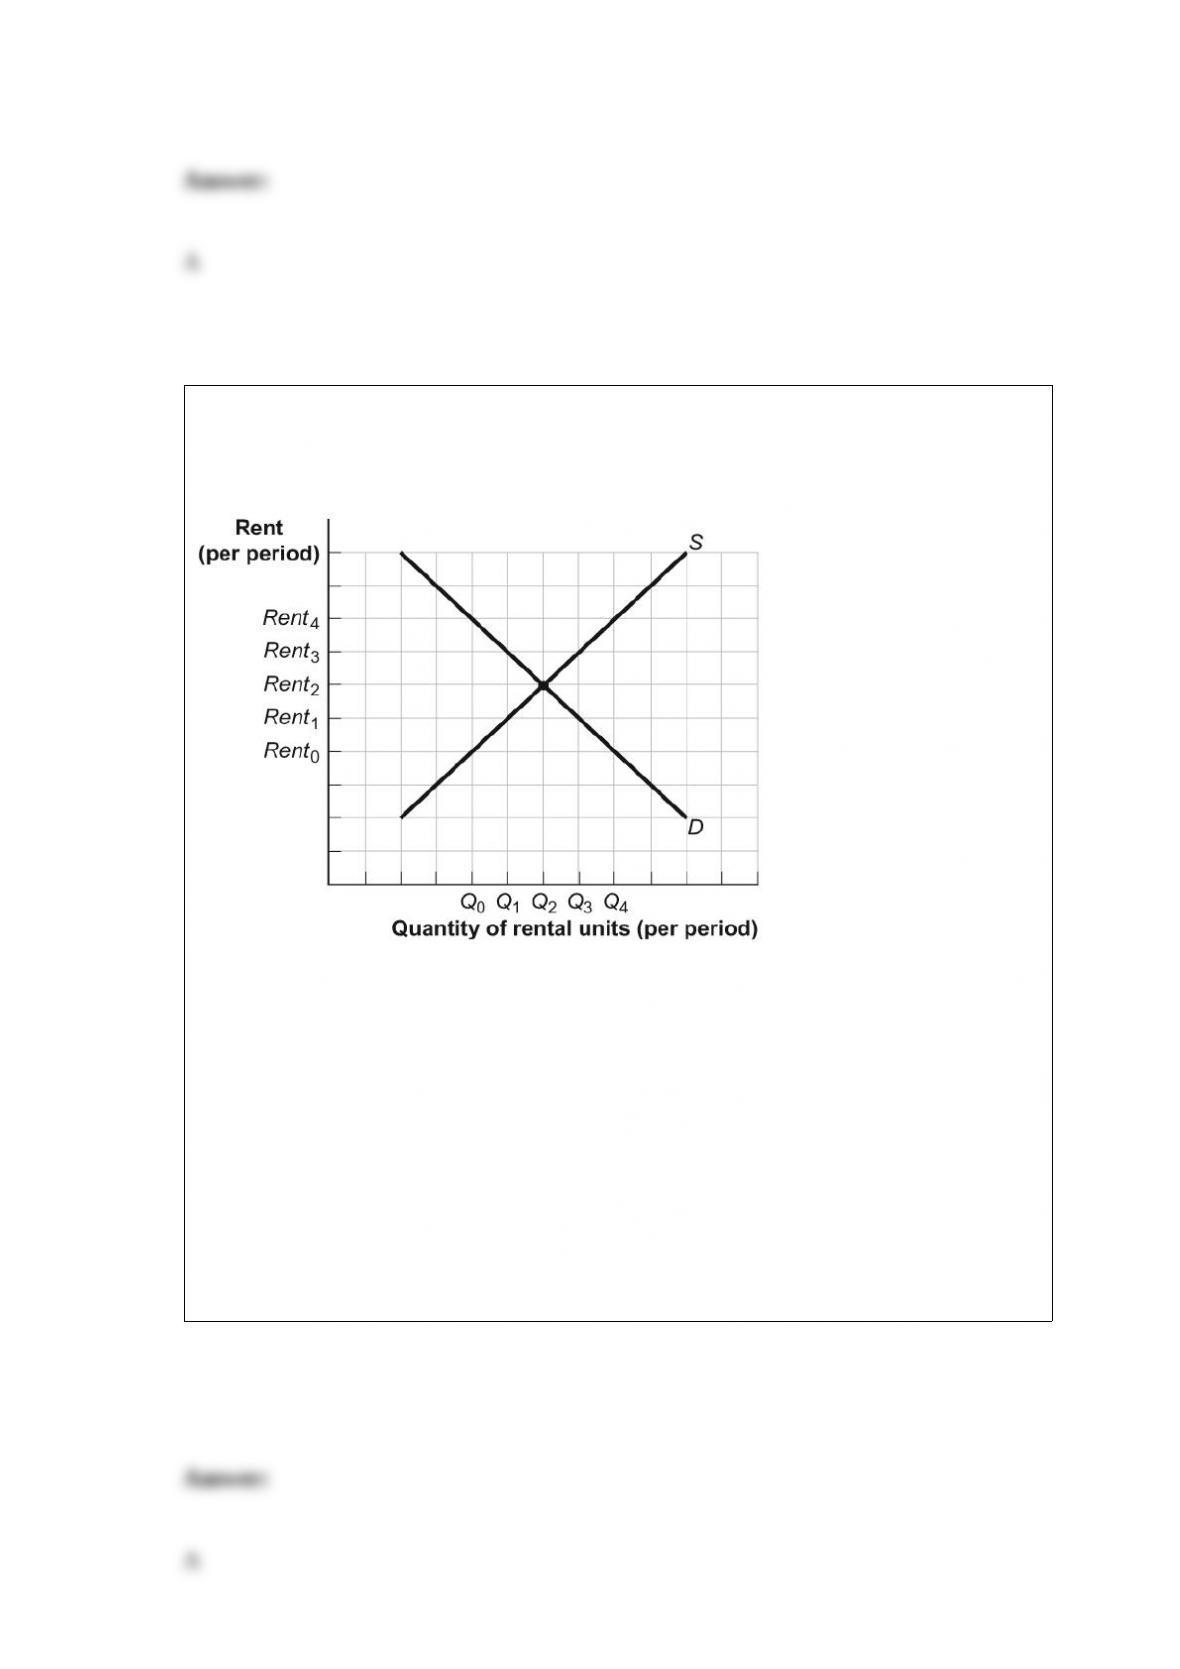
Figure: Rent Controls
(Figure: Rent Controls) Look at the figure Rent Controls. If rent controls are set at
Rent0, renters would be willing to pay a price at least as high as:
A) Rent4 for Q0 units.
B) Rent4 for Q1 units.
C) Rent3 for Q1 units.
D) No one would be willing to pay a higher actual price than Rent0.

When a welfare program is provided to those whose income falls below some
minimum, it is said to be:
A) means-tested.
B) an in-kind benefit.
C) a monetary benefit.
D) a negative income tax.
Mark and Rasheed are at the bookstore buying new calculators for the semester. Mark is
willing to pay $75 and Rasheed is willing to pay $100 for a graphing calculator. The
price for a calculator at the bookstore is $65. How much is their total consumer surplus?
A) $10
B) $35
C) $45
D) $60
An externality is said to be internalized:
A) when individuals take external costs and benefits into account in their decision
making.
B) when the Coase theorem is irrelevant or cannot be applied.
C) when individuals successfully petition the government to ban or restrict activities
that generate negative externalities.
D) when individuals learn to adapt to negative externalities through introspection or
internal acceptance of what are viewed as unchangeable facts of life.
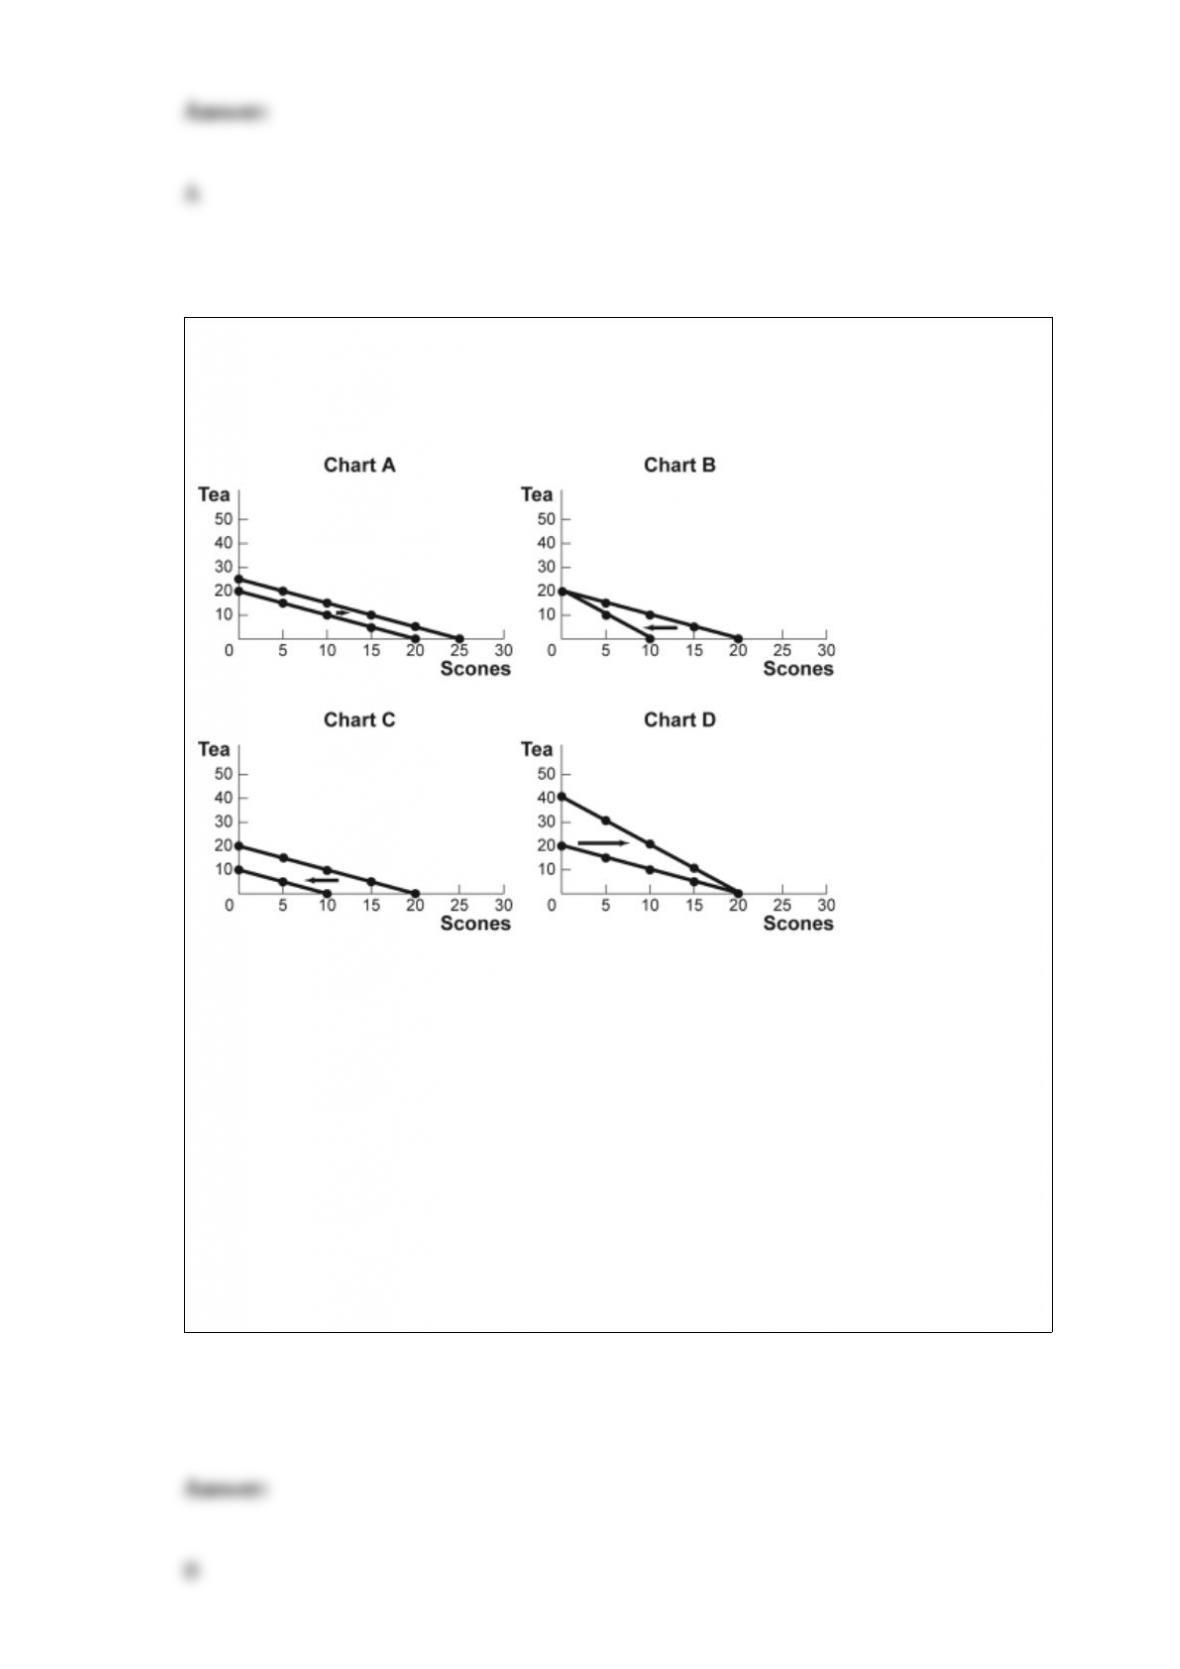
Figure: Budget Lines for Tea and Scones
(Figure: Budget Lines for Tea and Scones) Look at the figure Budget Lines for Tea and
Scones. For months now, Agnes has had $20 per month to spend on tea and scones. The
price of each cup of tea and each scone has been $1. Which of the charts shows what
will happen to her budget line if the price of a scone rises to $2?
A) A
B) B
C) C
D) D

If they bake only cakes, in a single day George can bake 10 cakes and Greta can bake 5
cakes. If they make only pies, in a single day George can bake 10 pies while Greta can
bake 4 pies. We know that _____ has an absolute advantage and a comparative
advantage in making _____.
A) George; cakes
B) George; pies
C) Greta; cakes
D) Greta; pies
If the labor supply curve bends backward, then the backward-bending portion reveals
that _____ is a(n) _____ good and the _____ effect is greater than the _____ effect.
A) labor; normal; income; substitution
B) labor; inferior; substitution; income
C) leisure; normal; income; substitution
D) leisure; inferior; substitution; income
Community rating is a regulation that requires:

A) cities to give ratings to movies shown in local theaters.
B) insurance companies to offer the same policies for the same premium to everyone,
regardless of medical history.
C) insurance companies to charge higher premiums to healthy people.
D) insurance companies to charge higher premiums to the sickest people in the
community.
As production increases and the fixed cost is divided by larger quantities of output,
average fixed cost drops. This is referred to as the _____ effect.
A) diminishing returns
B) spreading
C) constant cost
D) increasing returns

Diamond rings are relatively scarce because:
A) according to geologists, diamonds are less common than any other gem-quality
stone.
B) the demand for diamonds is so high.
C) diamond producers limit the quantity supplied to the market.
D) of monopolistic competition.
Which of the following is TRUE?
A) Monopolies produce too much and charge too much from the standpoint of
efficiency.
B) Monopolies usually are economically efficient because they have economic profits
with which to work.

C) Monopolies produce too little and charge too much from the standpoint of efficiency.
D) Monopolies cause an efficiency problem but are not associated with a deadweight
loss.