
Between 1990 and 2005 the price of oil was low relative to prices in the 1970s and
1980s, and consumers responded by buying large, fuel-inefficient vehicles.
A) True
B) False
When the economy is in a recession, tax receipts _____ and unemployment insurance
payments _____.
A) decrease; increase
B) increase; increase
C) increase; decrease
D) decrease; decrease
A repo is a:
A) share of stock in a depository bank.
B) share of stock in a shadow bank.
C) long-term loan.
D) short-term loan.
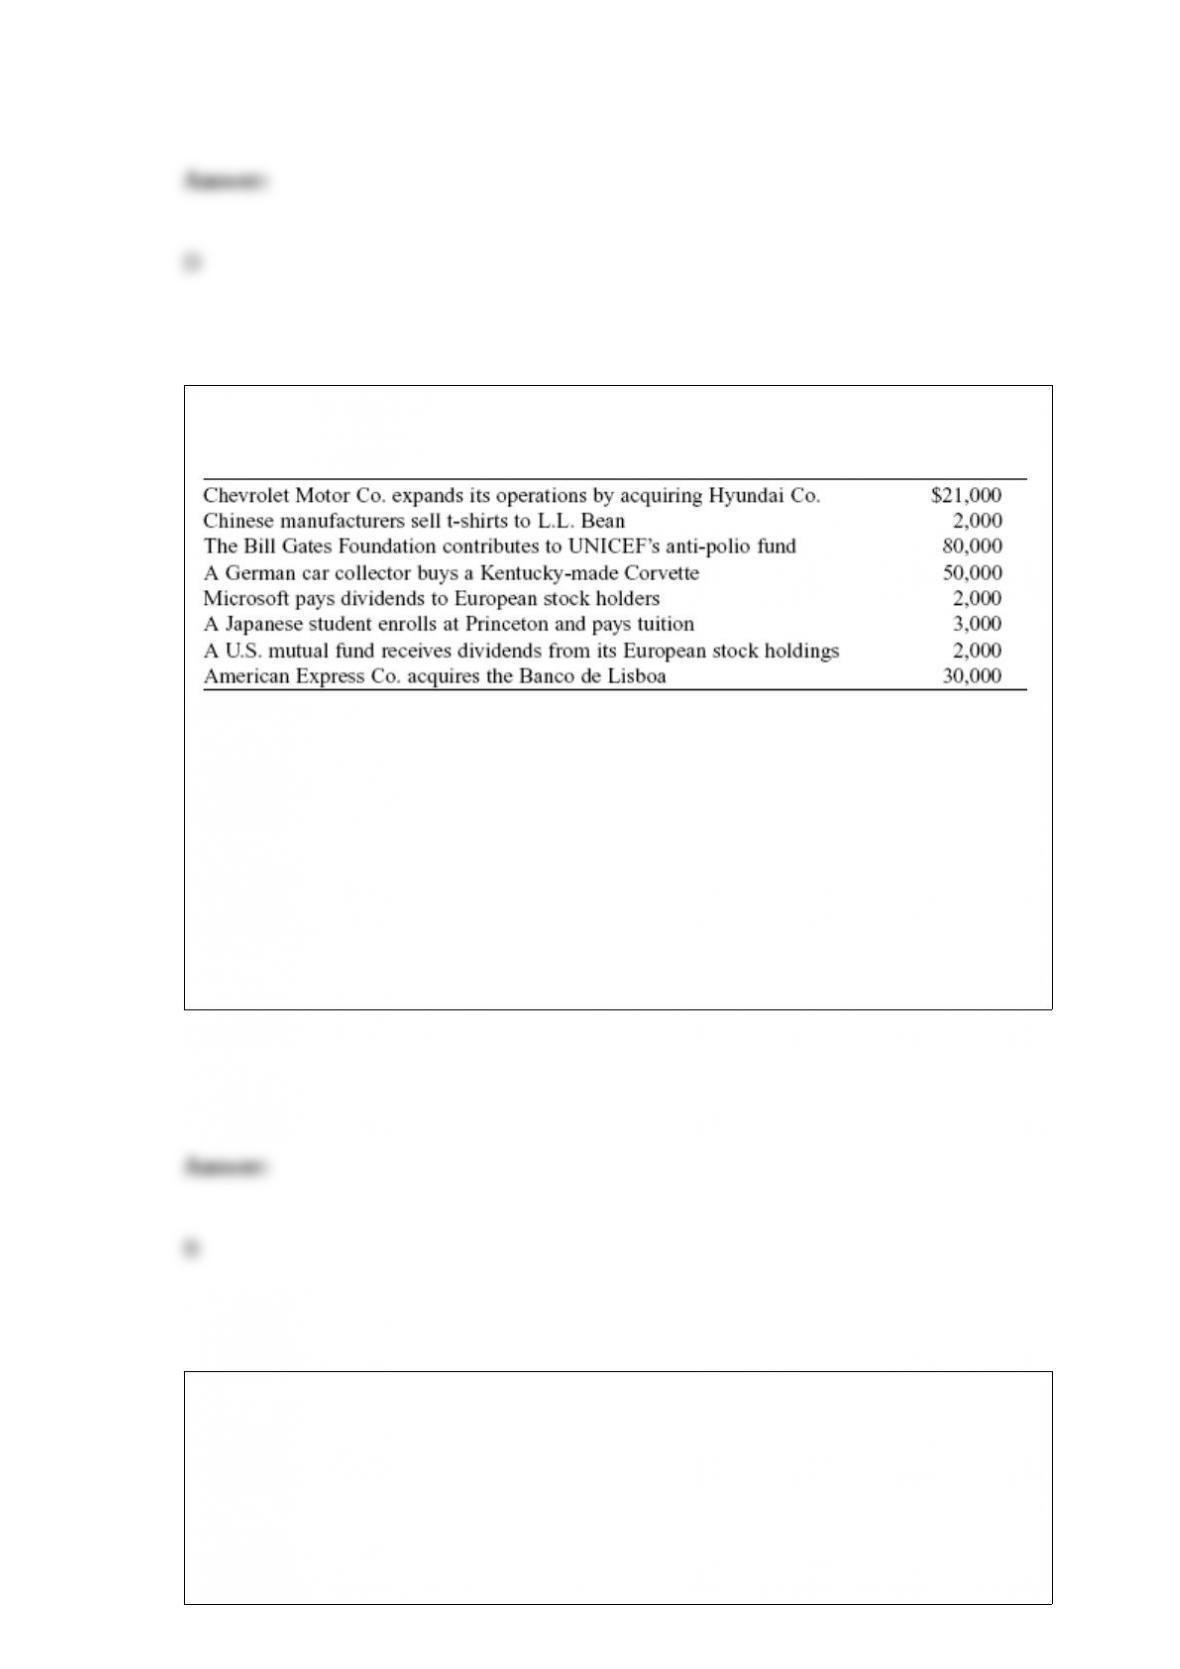
Table: International Transactions
Look at the table International Transactions. The merchandise trade balance is:
A) $51,000.
B) $48,000.
C) $46,000.
D) $2,000.
The Chinese yuan is on a fixed rate. If the government of China uses monetary policy to
change the exchange rate of the yuan from $0.16 to $0.10, the Chinese yuan has
appreciated.
A) True
B) False

If the price level and nominal GDP both doubled, then real GDP would:
A) also double.
B) increase by half.
C) remain unchanged.
D) decrease by half.
The key measure used to track economic growth is:
A) real GDP per capita.
B) nominal GDP.
C) real GDP.
D) nominal GDP per capita.
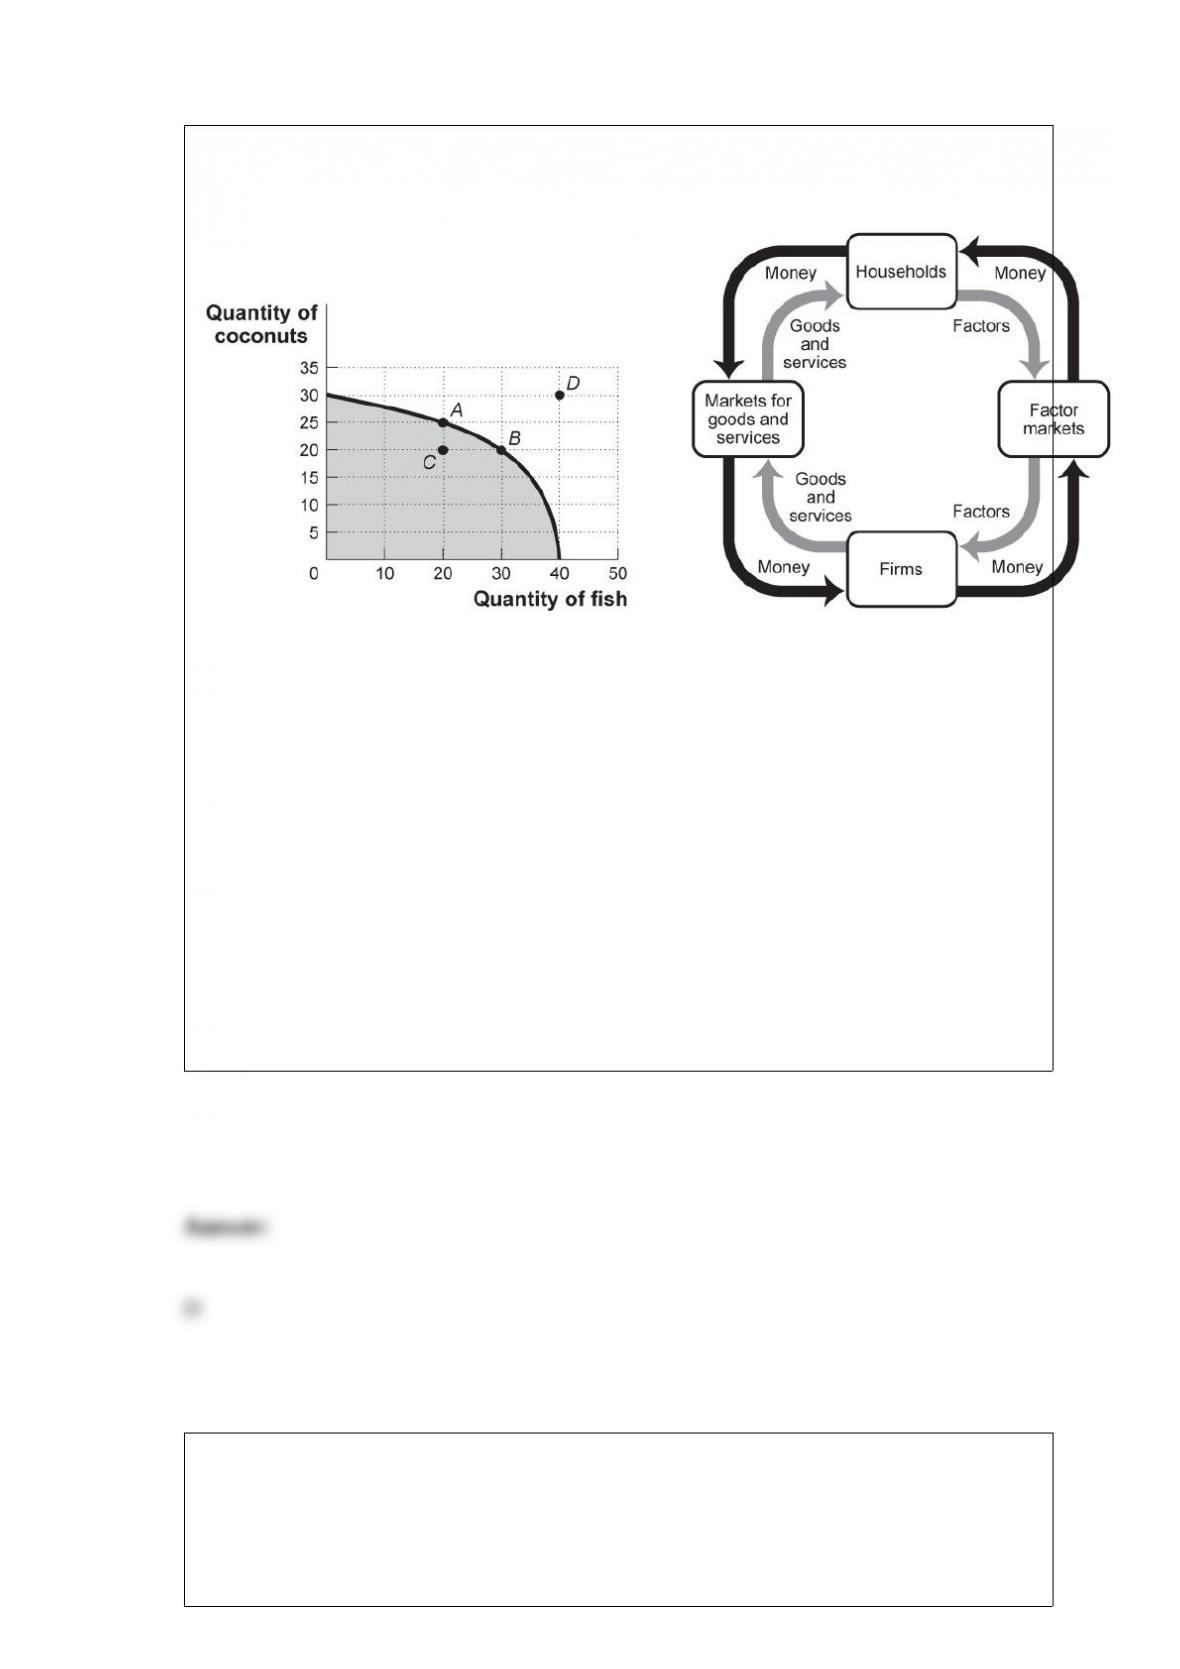
Figure: Production Possibilities and Circular-Flow Diagram
Look at the figure Production Possibilities and Circular-Flow Diagram. Assume the two
figures represent the same economy. Suppose that in the circular-flow diagram there is a
significant increase in the amount of human capital flowing to both coconut producers
and fish producers. If all other variables remain unchanged, then the adjustment in this
economy would be best represented in the production possibilities figure by a
movement from point A toward:
A) point A (no movement).
B) point B (a decrease in coconut production and an increase in fish production).
C) point C (a decrease in coconut production).
D) point D (an outward shift of the entire curve).
When the central bank announces the desired inflation rate and sets policy to reach that
rate, it is using:
A) monetary neutrality policy.
B) the Taylor rule.
C) inflation targeting.
D) fiscal policy.
William McChesney Martin, Alan Greenspan, and Ben Bernanke were all:
A) speakers of the U.S. House of Representatives.
B) candidates for vice president of the United States.
C) chairs of the Federal Reserve.
D) U.S. senators during the Great Depression.
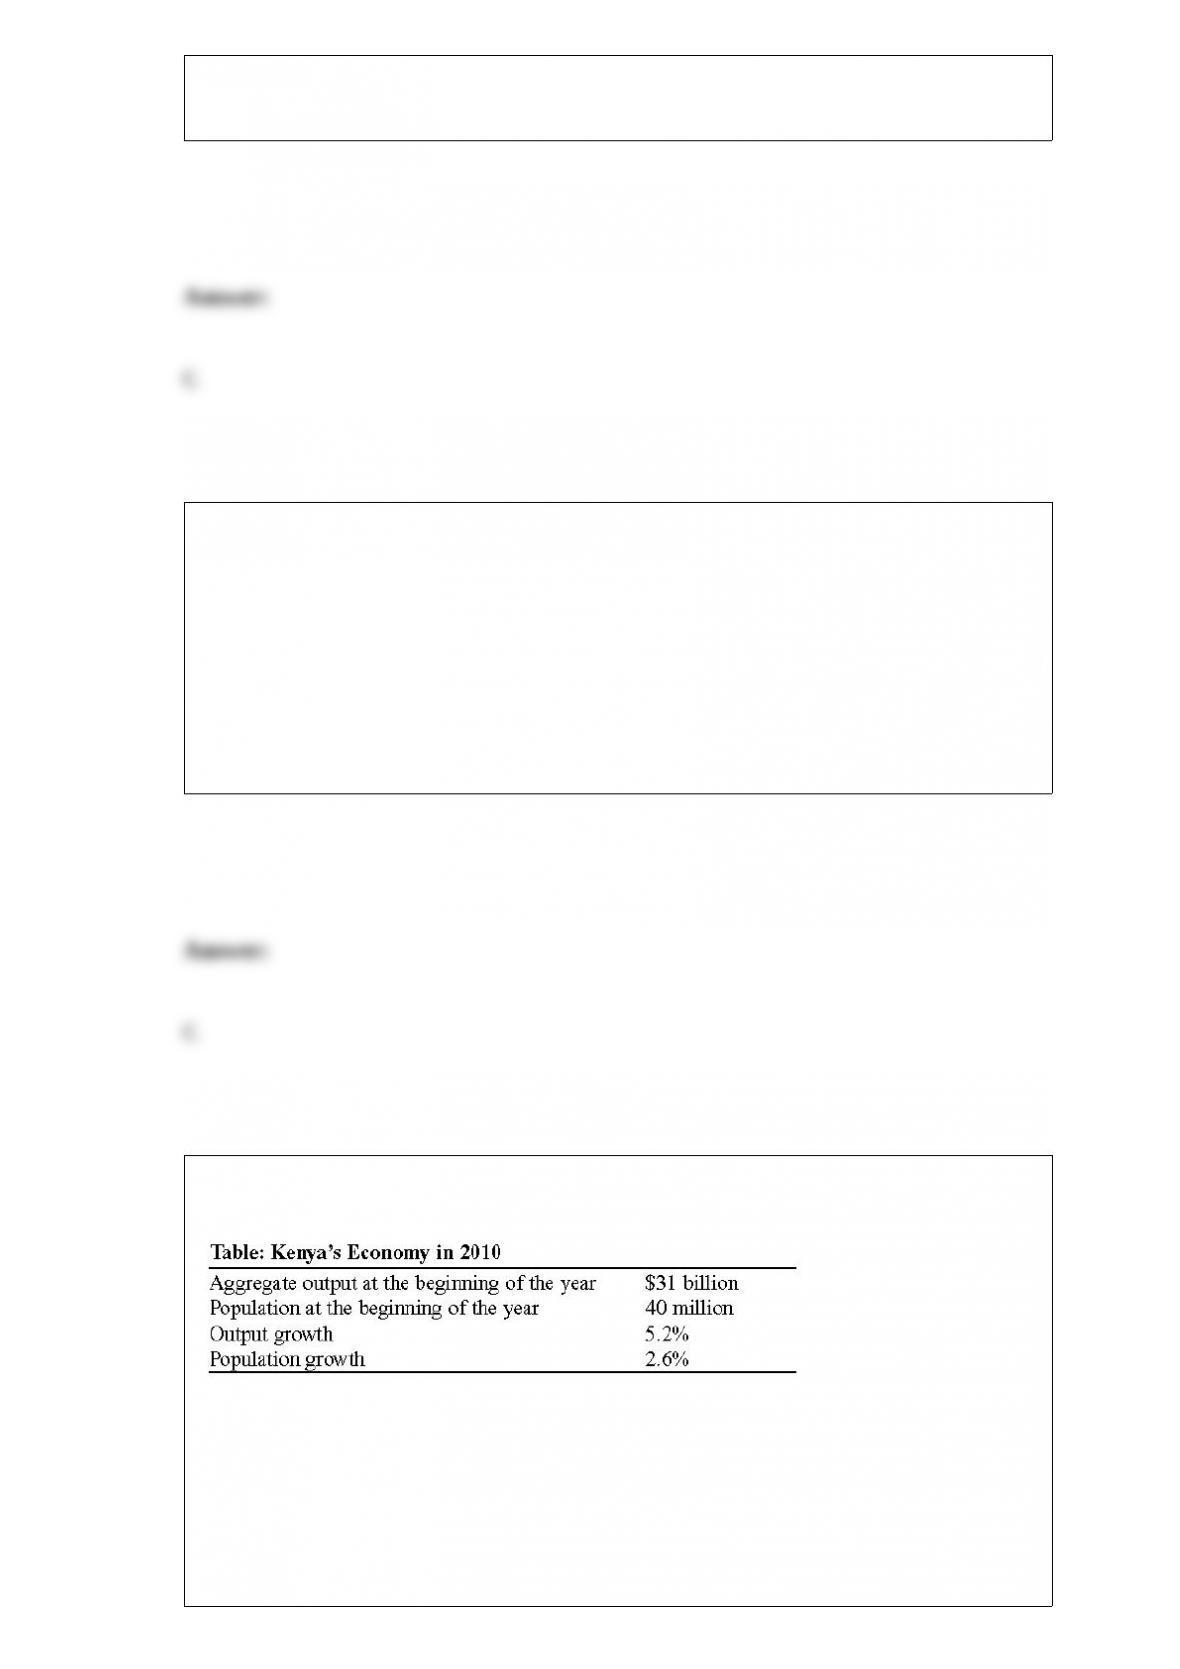
Look at the table Kenya’s Economy in 2010. Aggregate output per capita at the
beginning of 2010 was:
A) $5,000.
B) $10,000.

C) $775.
D) $7,750.
Which of the following will NOT increase the productivity of labor?
A) technological improvements
B) an increase in the capital stock
C) improvements in education
D) an increase in the size of the labor force
Which of the following is an example of a tariff?
A) A regulation specifying that each imported Yamaha motorcycle must meet certain
emission exhaust guidelines.
B) A limit on the total number of Yamaha motorcycles imported from Japan.
C) A tax of 5% of the value of each Yamaha motorcycle imported from Japan.
D) A tax of $250 on each Yamaha motorcycle produced in the United States.

Sustainable long-run economic growth is long-run growth that can continue in the face
of decreases in the growth rate of the world’s population.
A) True
B) False
An increase in real aggregate spending will shift the money:
A) demand curve rightward.
B) demand curve leftward.
C) supply curve rightward.
D) supply curve leftward.
Figure: The Market for MP3 Players
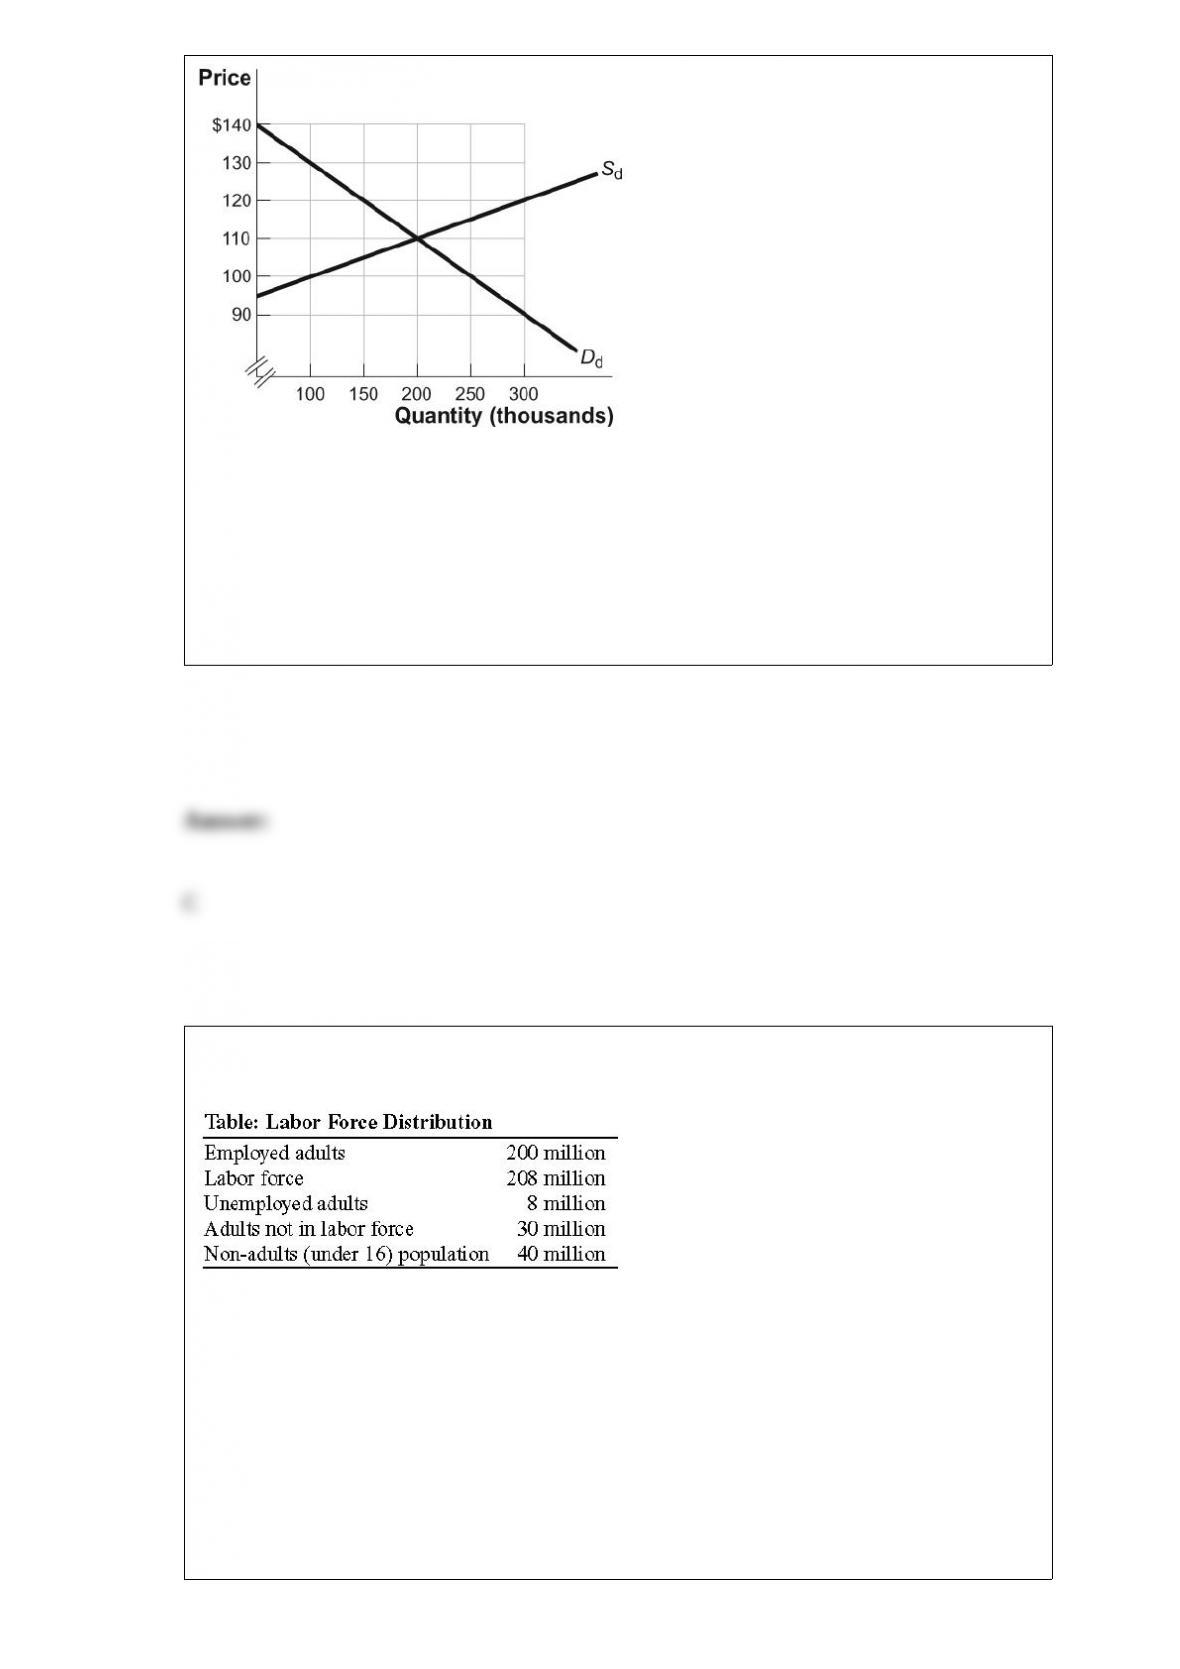
Look at the figure The Market for MP3 Players. Assume that Sdrepresents the domestic
supply curve and Ddrepresents the domestic demand curve. In the market for MP3
players, the autarky price equals:
A) $140.
B) $120.
C) $110.
D) $100.
Look at the table Labor Force Distribution. The total population is:
A) 486 million.
B) 253 million.
C) 278 million.
D) 283 million.

Economies with high growth rates tend to be those that increase their:
A) government regulation.
B) human capital.
C) consumption.
D) resources.
If the exchange rate is 8 yuan per U.S. dollar, the U.S. price index is 145, and the
Chinese price index is 206, the real exchange rate is _____ yuan.
A) 11.36
B) 7.62
C) 5.63
D) 0.08

Shares of stock are:
A) shares of ownership in the issuing company.
B) a tax liability for the issuing company.
C) a tax deduction for the investor.
D) a debt of the issuing company to the investors who purchase the stock.
Scenario: Growth Rates
Suppose that real GDP per capita of the United States is $32,000 and its growth rate is
2% per year. Real GDP per capita of China is $4,000, and its annual growth rate is 7%.
Look at the scenario Growth Rates. How many years will it take for China’s real GDP
per capita to be larger than real GDP per capita in the United States?
A) 70 to 75 years
B) 40 to 45 years
C) 15 to 20 years
D) 5 to 10 years
If the labor force includes 100 million workers and 5 million people are unemployed
but actively seeking work, then the unemployment rate is:
A) 1%.
B) 5%.
C) 10%.
D) 95%.
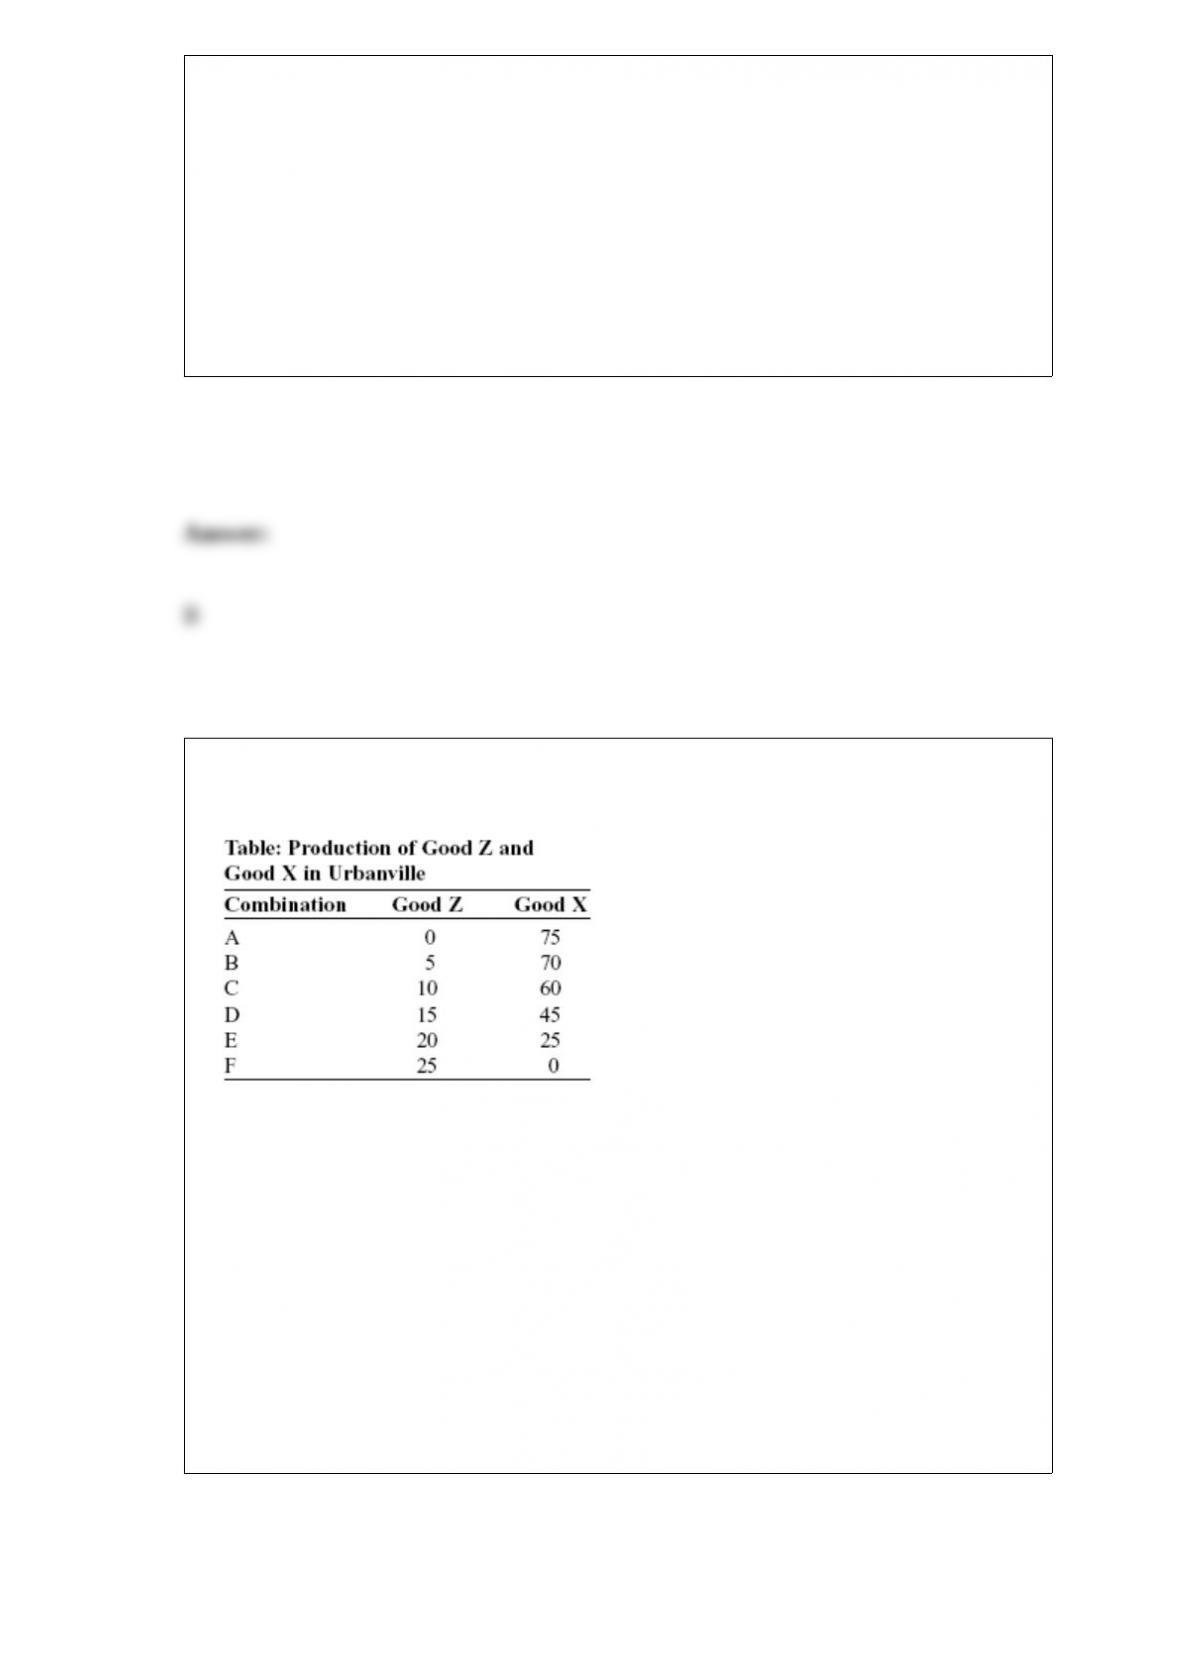
Look at the table Production of Good Z and Good X in Urbanville. If this table shows
the production possibility frontier and if Urbanville is producing 5 of Z and 50 of X,
this combination is:
A) feasible but inefficient.
B) feasible and efficient.
C) not feasible but efficient.
D) neither feasible nor efficient.

If policy makers want to decrease real GDP by $100 billion and the marginal propensity
to consume is 0.6, they should increase taxes by more than $40 billion.
A) True
B) False
Changing the reserve requirement is the main tool of monetary policy.
A) True
B) False
Table: South Korea’s Real GDP per Capita
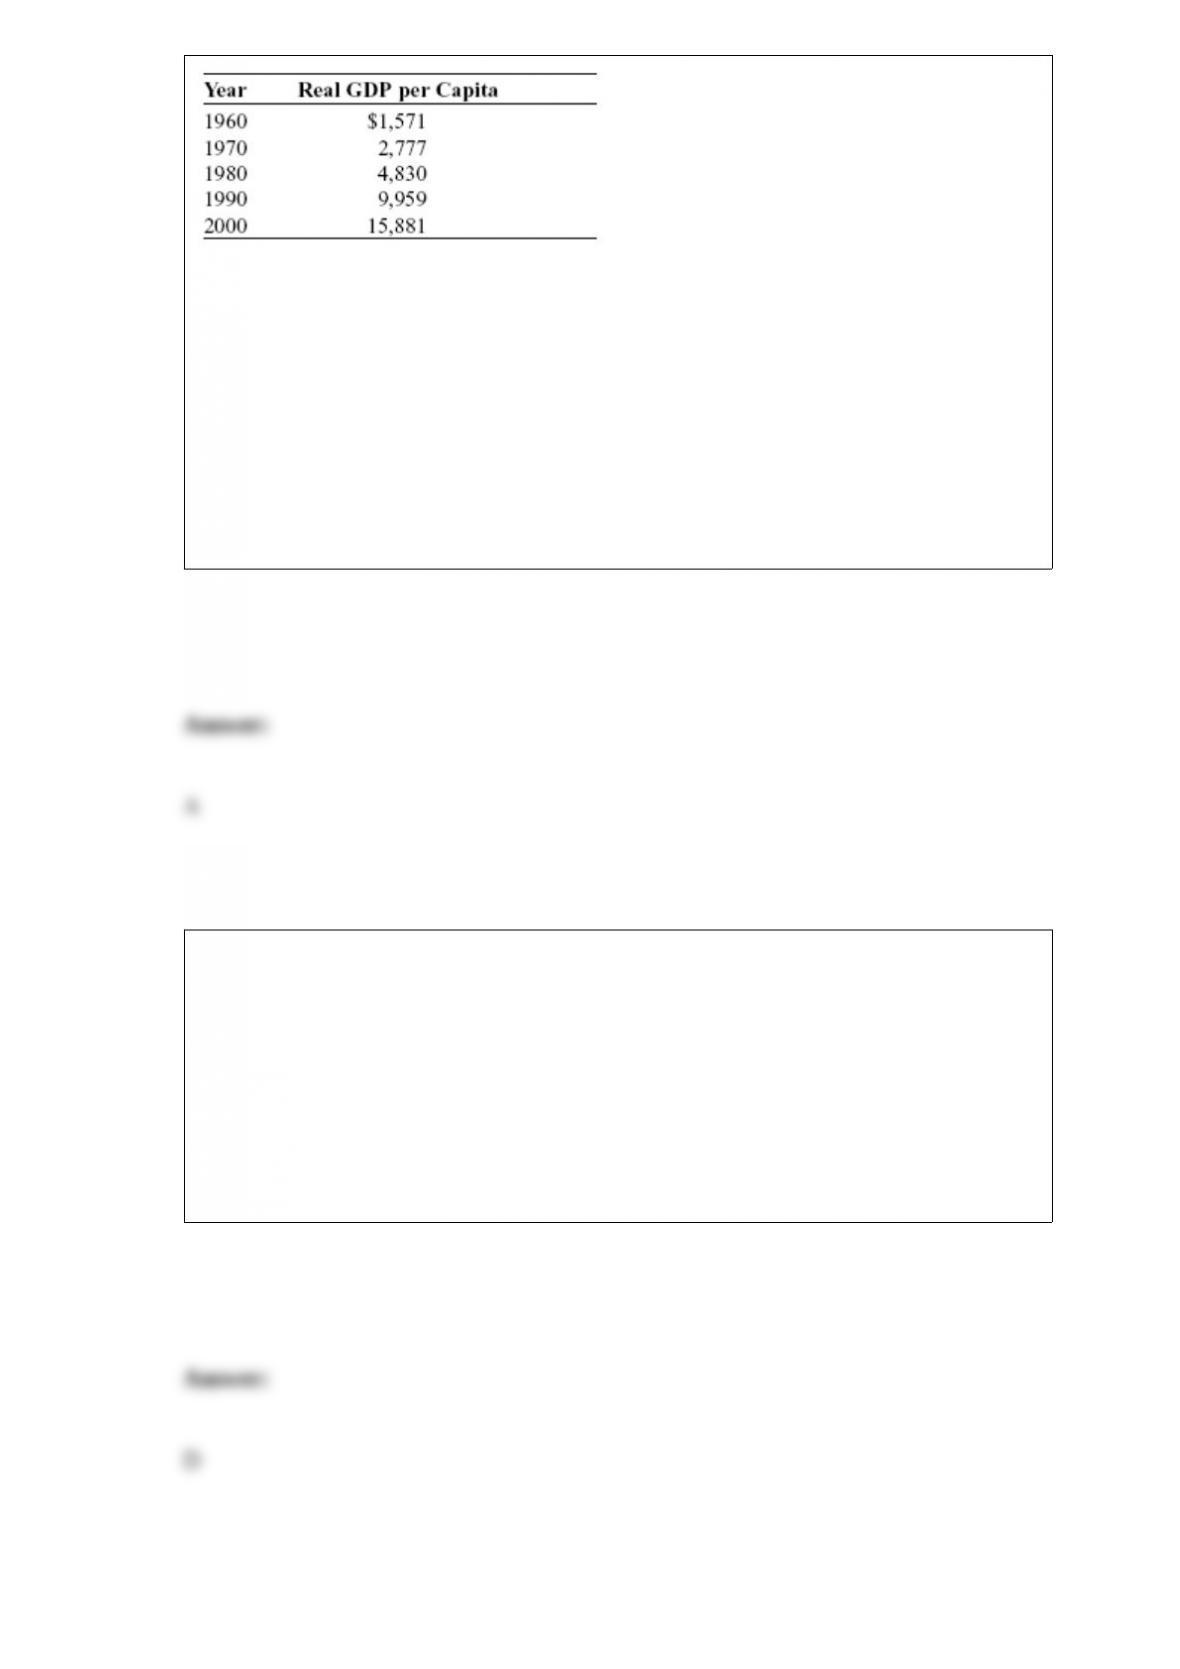
Look at the table South Korea’s Real GDP
per Capita. As a percentage of real GDP per capita in 2000, approximately how much
did South Korea produce in 1960?
A) 10%
B) 15%
C) 151%
D) 1,011%
GDP excludes all of the following EXCEPT:
A) the value of leisure.
B) damage to the environment.
C) the value of housework.
D) the value of owner-occupied housing.

When economists measure economic growth, they often use:
A) the inflation rate.
B) the unemployment rate.
C) nominal GDP.
D) real GDP.
Most economists oppose a constitutional amendment requiring the federal budget to be
balanced annually.
A) True
B) False
Economists use the term long-term growth to indicate:
A) the expansion phase of the business cycle.
B) growth of the economy over several decades.
C) growth of the economy over one to five years.
D) long-run growth of the value of a company.

Although freshwater is very abundant in most places, it is scarce because:
A) it has no alternative uses.
B) there is not enough of it to meet all needs.
C) it is a free good.
D) scarce goods in general are not all that costly.
Economists who are asked to choose between two government policies may disagree
because:
A) they make the same value judgments about the desirability of the policies.
B) they base their conclusions on models that make different assumptions.
C) as a matter of course, economists often take opposing points of view so that all sides
of a question may be discussed.
D) economists are trained ignore facts and focus on theory.
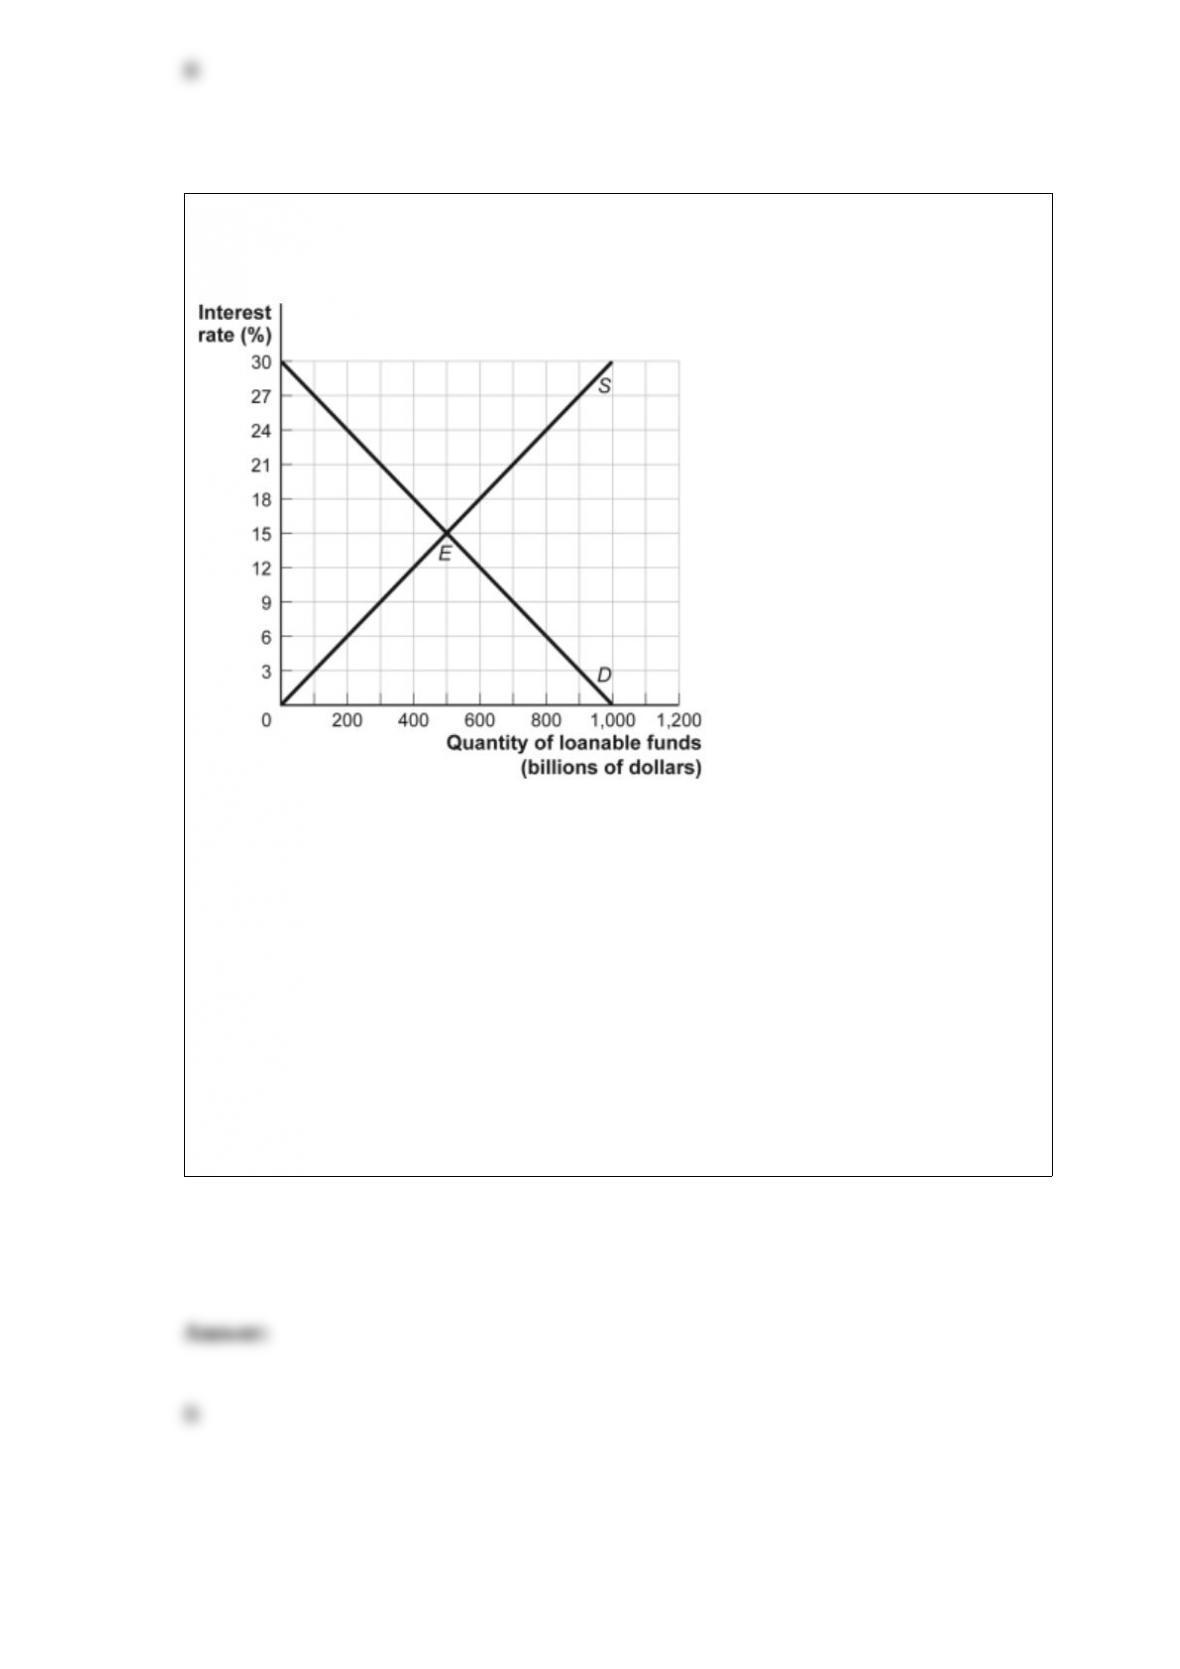
Figure: The Market for Loanable Funds III
Look at the figure The Market for Loanable Funds III. If the government in a closed
economy is running a budget balance of zero when it decides to increase defense
spending by $200 billion and then finances the spending by selling bonds, the
government will crowd out a maximum of _____ in private investment spending.
A) $200 billion
B) $100 billion
C) $50 billion
D) $10 billion