
Workers in China earn low wages relative to world standards. A person who believes
trade must be bad for workers in China because of this adheres to the:
A) sweatshop labor fallacy.
B) Heckscher”Ohlin theory.
C) pauper labor fallacy.
D) theory of absolute advantage.
(Table: Total Utility of Income After College Expenses) Look at the table Total Utility
of Income After College Expenses. What certain income after tuition leaves Mr. and
Mrs. Smith just as well off as their uncertain income after tuition?
A) $37,500
B) $38,000
C) $40,500
D) $42,500

If the price of a commodity increases, you can expect the:
A) supply to increase.
B) quantity supplied to increase.
C) quantity supplied to decrease.
D) supply curve to shift to the right.
The demand curve facing a monopolist is:
A) vertical, the same as that facing a perfectly competitive firm.
B) perfectly inelastic, the same as that facing a perfectly competitive firm.
C) upward-sloping, the same as that facing a perfectly competitive firm.
D) downward-sloping, like the industry demand curve in perfect competition.
The publisher of an economics textbook finds that when the book’s price is lowered
from $70 to $60, sales rise from 10,000 to 15,000. By the midpoint method, the price
elasticity of demand is:
A) 500.
B) 50.
C) 3.5.
D) 2.6.
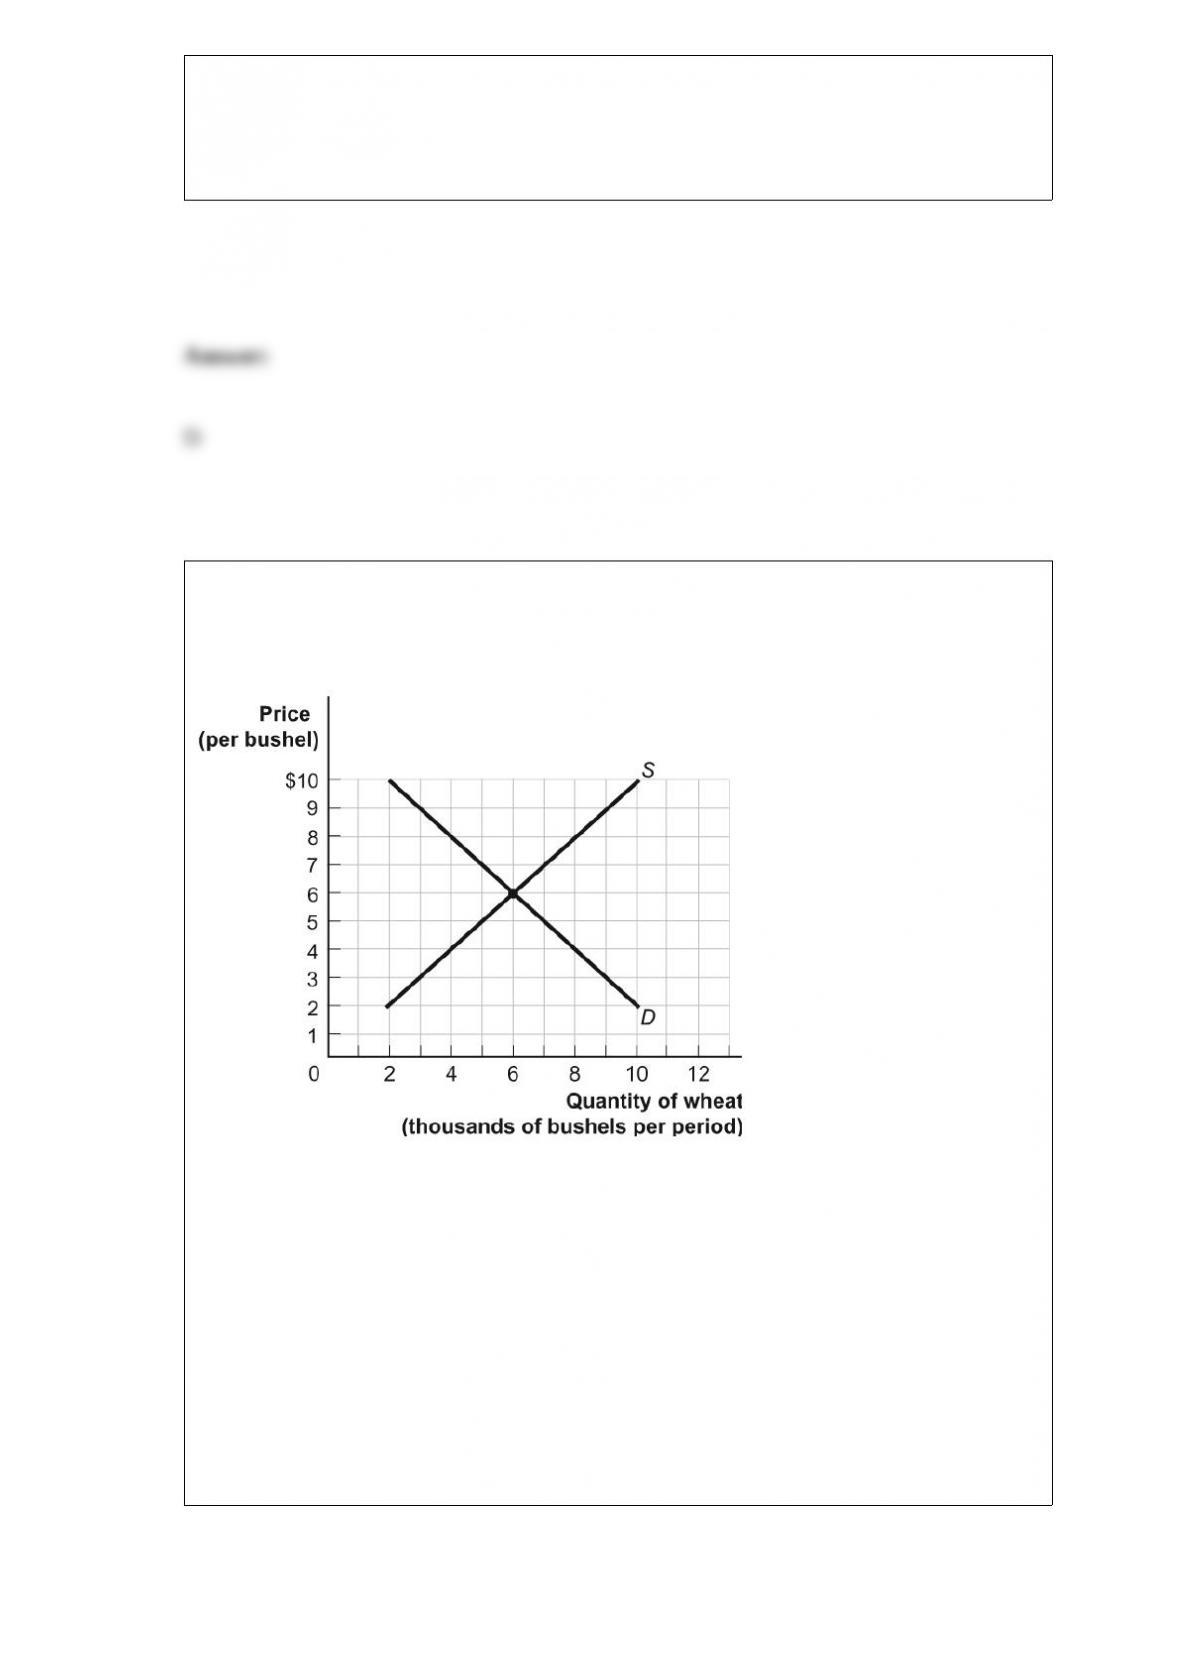
Figure: The Demand and Supply of Wheat
(Figure: The Demand and Supply of Wheat) Look at the figure The Demand and
Supply of Wheat. If a price of $10 temporarily exists in this market, a _____ of _____
bushels will result.
A) shortage; 10,000
B) shortage; 8,000
C) surplus; 8,000
D) surplus; 4,000

If a stock analyst believes there is a 10% probability that the stock price of Dymonatis
will be $30 at the end of the year, a 50% probability that it will be $40, and a 40%
probability that it will be $50, then the expected value of the stock at the end of the year
is:
A) $32.
B) $38.
C) $40.
D) $43.
Mr. Porter sells 10 bottles of champagne per week at $50 per bottle. He can sell 11
bottles per week if he lowers the price to $45 per bottle. The quantity and the price
effects on total revenue would be, respectively, an increase of _____ and a decrease of
_____.
A) $450; $500
B) $495; $550
C) $45; $5
D) $45; $50
Economic policy is _____ in consumption and _____.
A) rival; nonexcludable
B) nonrival; nonexcludable
C) nonrival; excludable
D) rival; excludable
The total cost curve for a snowmobile dealership shows how _____ cost depends on the
quantity of _____.
A) total; fixed inputs

B) average; variable inputs
C) total; output
D) marginal; output
The income effect will play a greater role in a consumer’s spending if the good:
A) accounts for a substantial share of the consumer’s spending.
B) accounts for a small share of the consumer’s spending.
C) is not subject to a budget constraint.
D) is not something the consumer needs.
Figure: Consumer Equilibrium IV
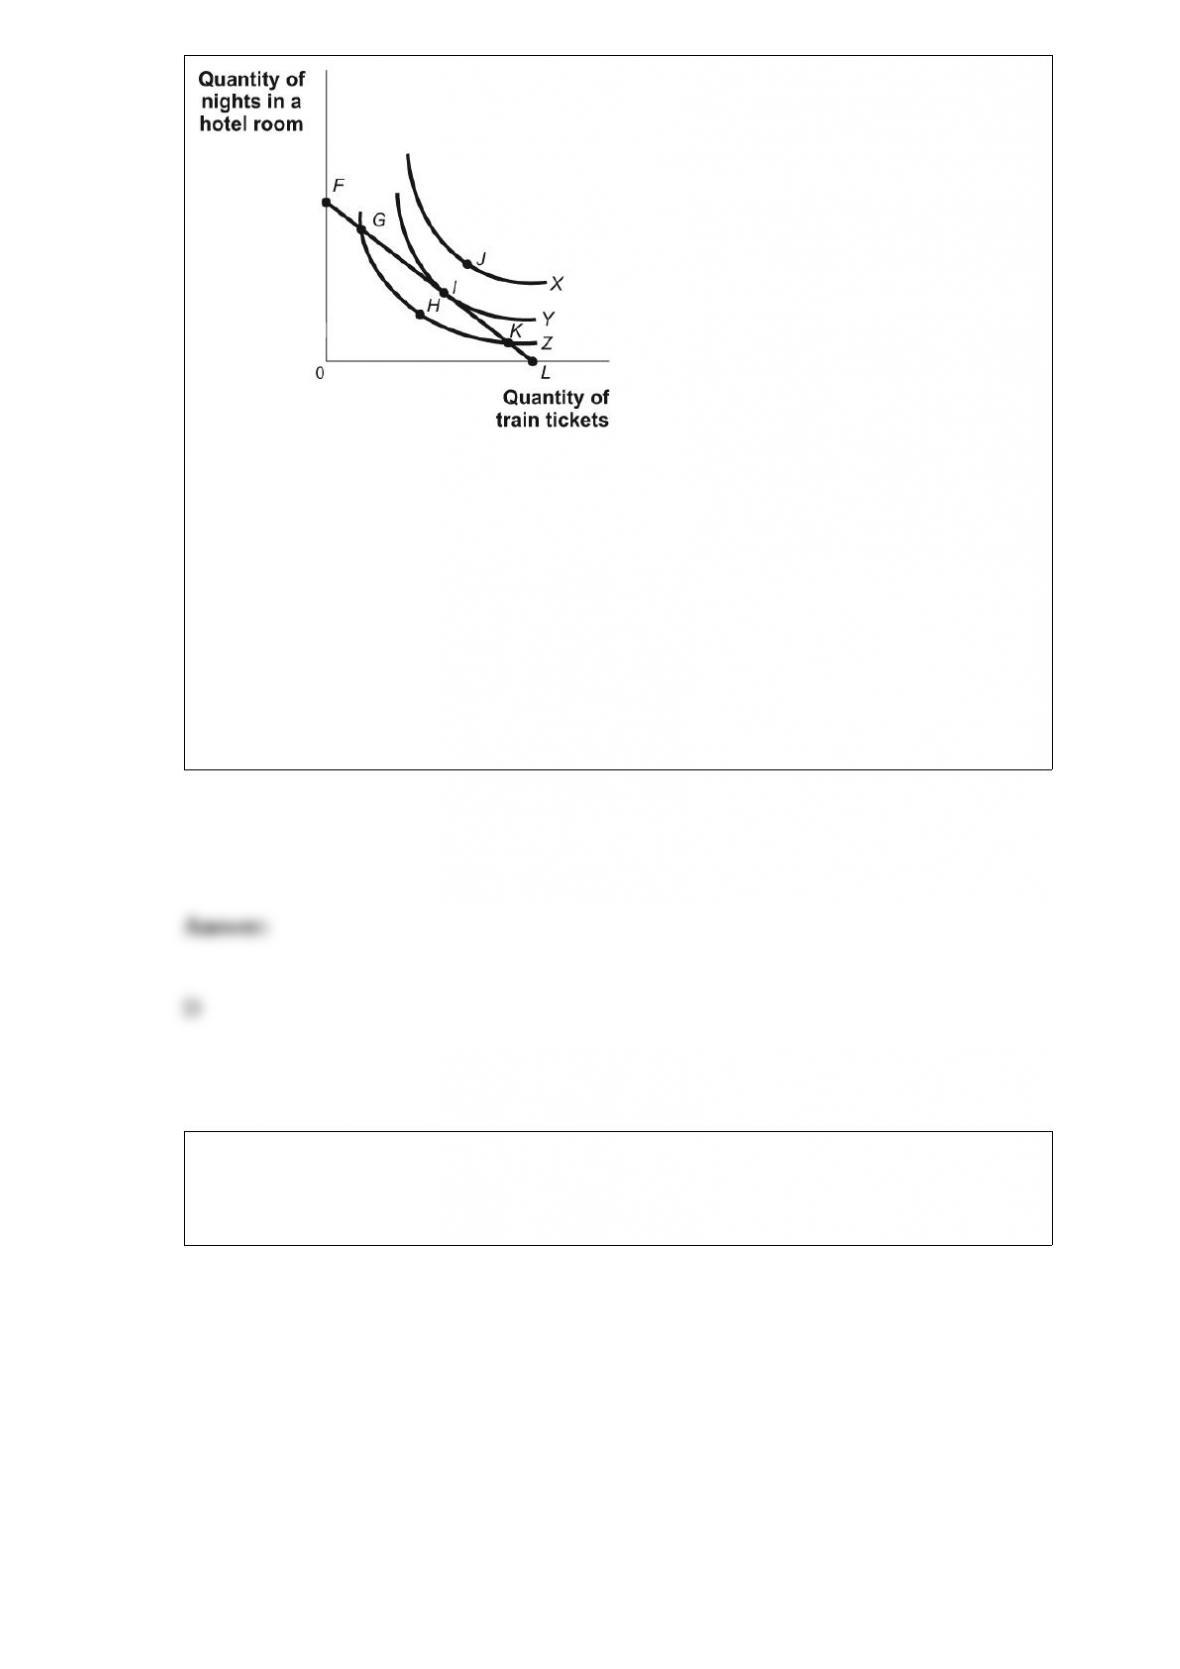
(Figure: Consumer Equilibrium IV) Look at the figure Consumer Equilibrium IV. An
unattainable level of utility, given budget constraint FL, is at point:
A) G.
B) H.
C) I.
D) J.
Figure: Shifts in Demand and Supply III
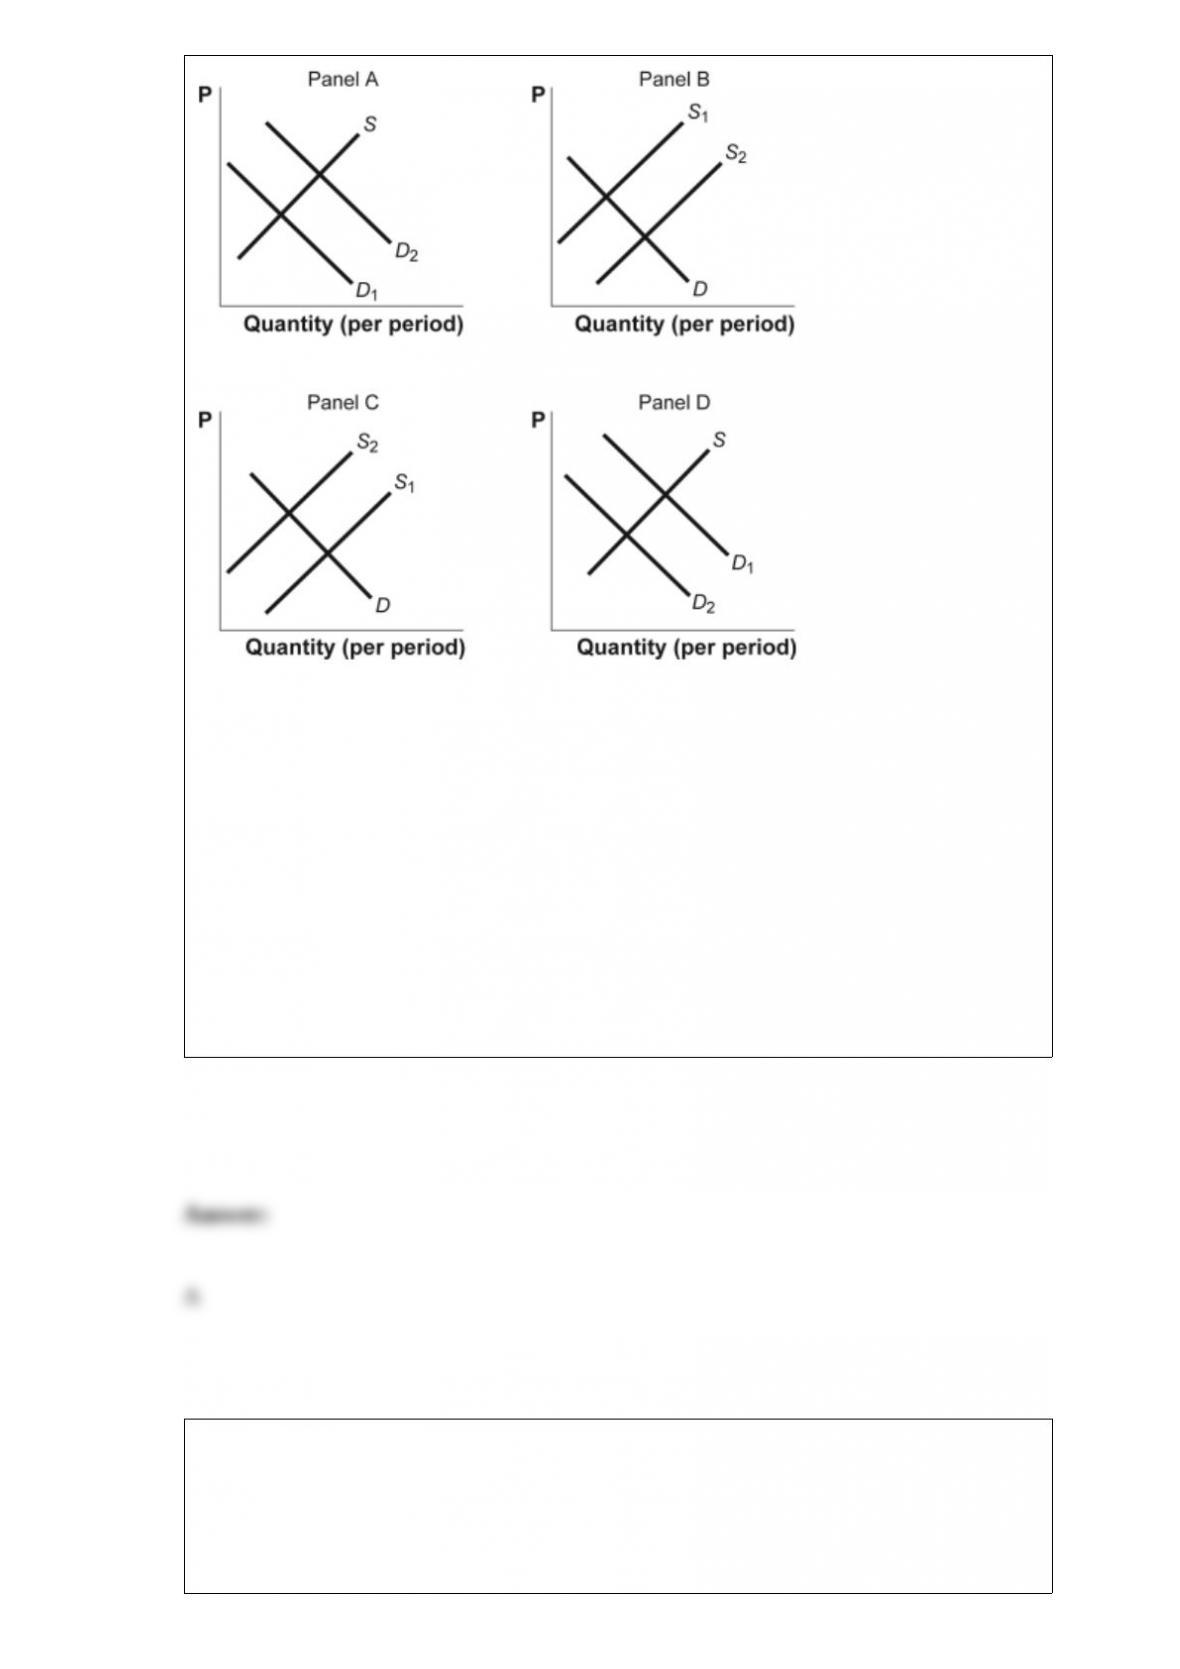
(Figure: Shifts in Demand and Supply III) Look at the figure Shifts in Demand and
Supply III. The figure shows how supply and demand might shift in response to specific
events. Suppose consumer incomes increase. Which panel BEST describes how this
will affect the market for designer boots, a normal good?
A) panel A
B) panel B
C) panel C
D) panel D
Which of the following best describes a “how much” decision?
A) Should I drive to work or ride my bicycle?
B) Should I rent a movie or watch a baseball game on television?
C) Should I attend graduate school or immediately enter the labor force?
D) Should I buy a third hot dog?
Of the following statements, which reflect(s) a normative view? I. The United States
should increase the minimum wage to $10 per hour. II. There is a federal minimum
wage in the United States. III. The federal minimum wage in the United States is less
than $10 per hour.
A) I, II, and III
B) None is normative.
C) I and II
D) I

Whatever the relevant time, Molly’s spending will be _____ by her _____.
A) unlimited; marginal utility
B) limited; marginal utility
C) limited; budget
D) unlimited; budget
(Table: Total Utility of Income After College Expenses) Look at the table Total Utility
of Income After College Expenses. The Smith family has _____ marginal utility as
income increases. The marginal utility of income between $32,500 and $35,000 is
_____ utils per dollar, while it is _____ utils per dollar between $45,000 and $47,500.
A) increasing; 0.48; 0.64
B) increasing; 0.12; 0.36
C) diminishing; 0.28; 0.08
D) diminishing; 0.40; 0.10
If the quantity supplied responds substantially to a relatively small change in price,
supply is:
A) price-elastic.
B) price-inelastic.
C) negatively sloped.
D) insensitive to changes in price.
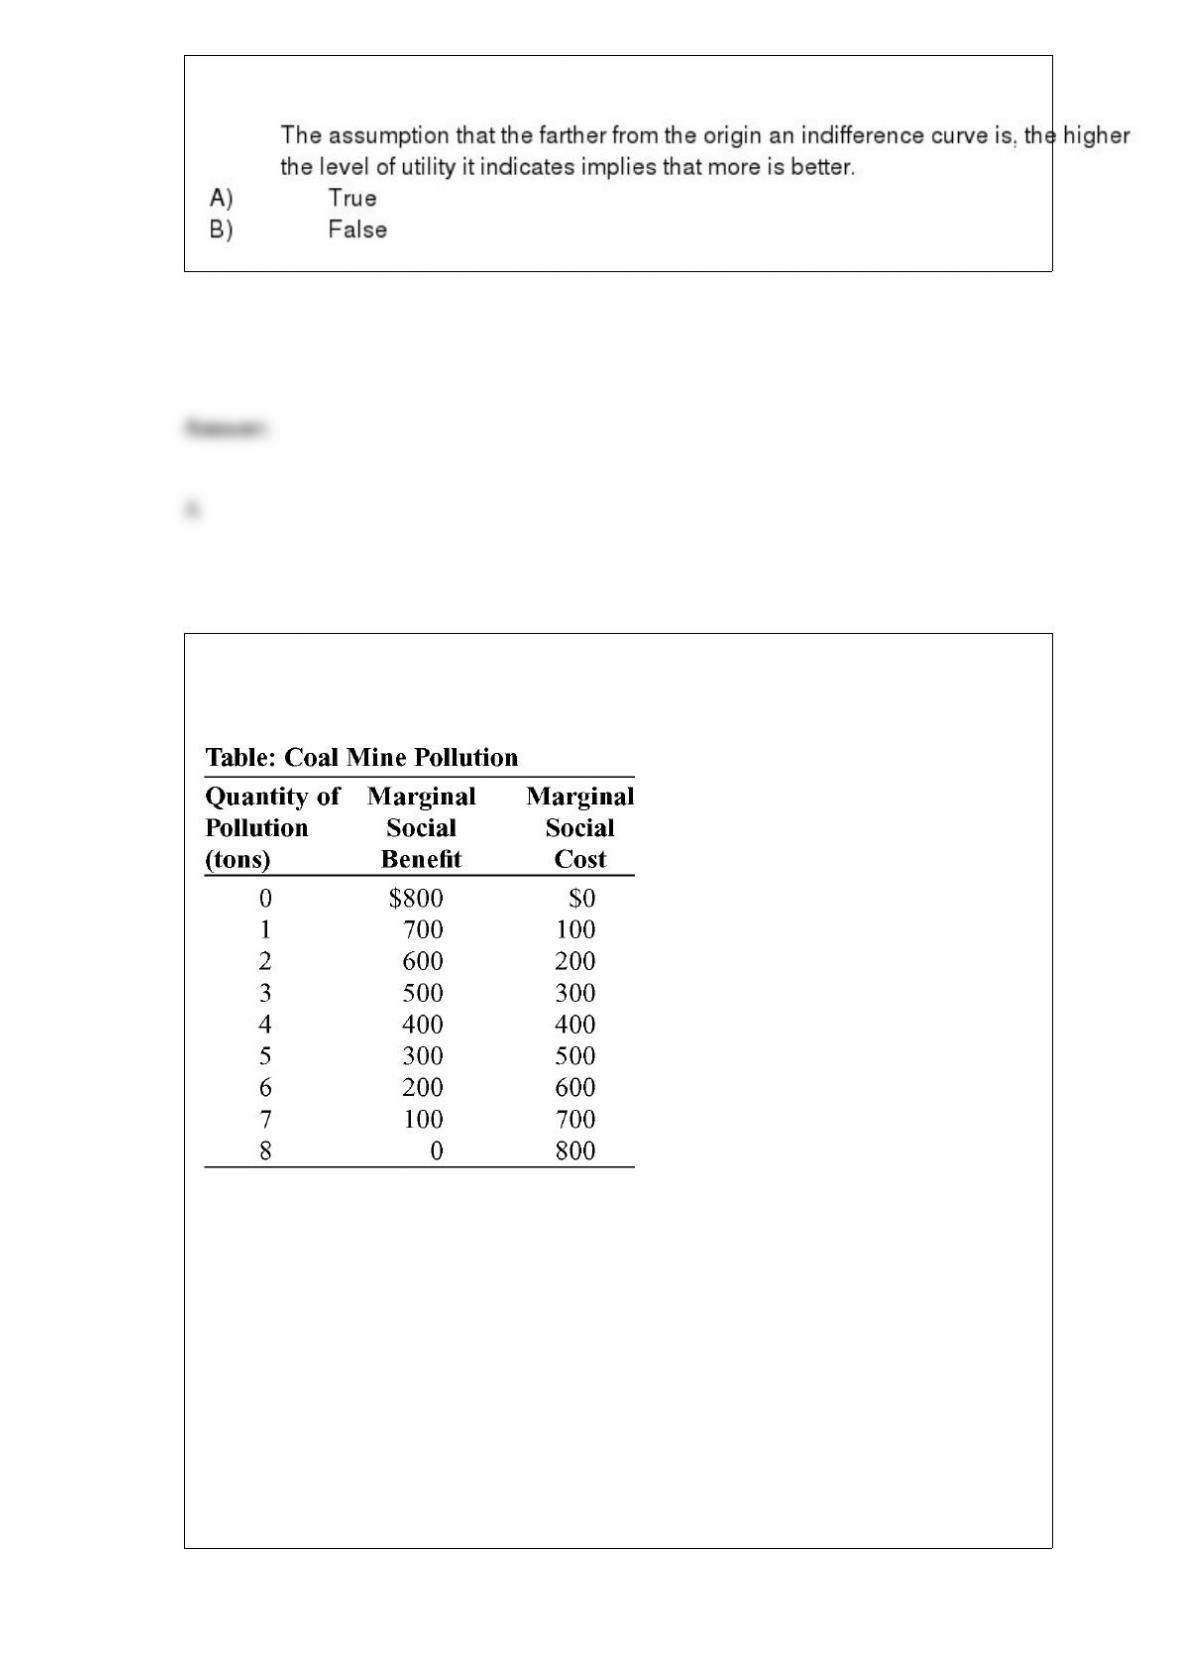
(Table: Coal Mine Pollution) The table Coal Mine Pollution shows the marginal social
benefit and cost of various amounts of pollution from a coal mine. At the
market-determined quantity of pollution, the marginal social cost of pollution is:
A) $800.
B) $400.
C) $200.
D) $0.

Approximately _____ of Americans have no health insurance.
A) 1% to 10%
B) 11% to 20%
C) 21% to 50%
D) over 50%
Progress in medical science has contributed to _____ health care costs.
A) increasing
B) decreasing
C) constant
D) randomly fluctuating
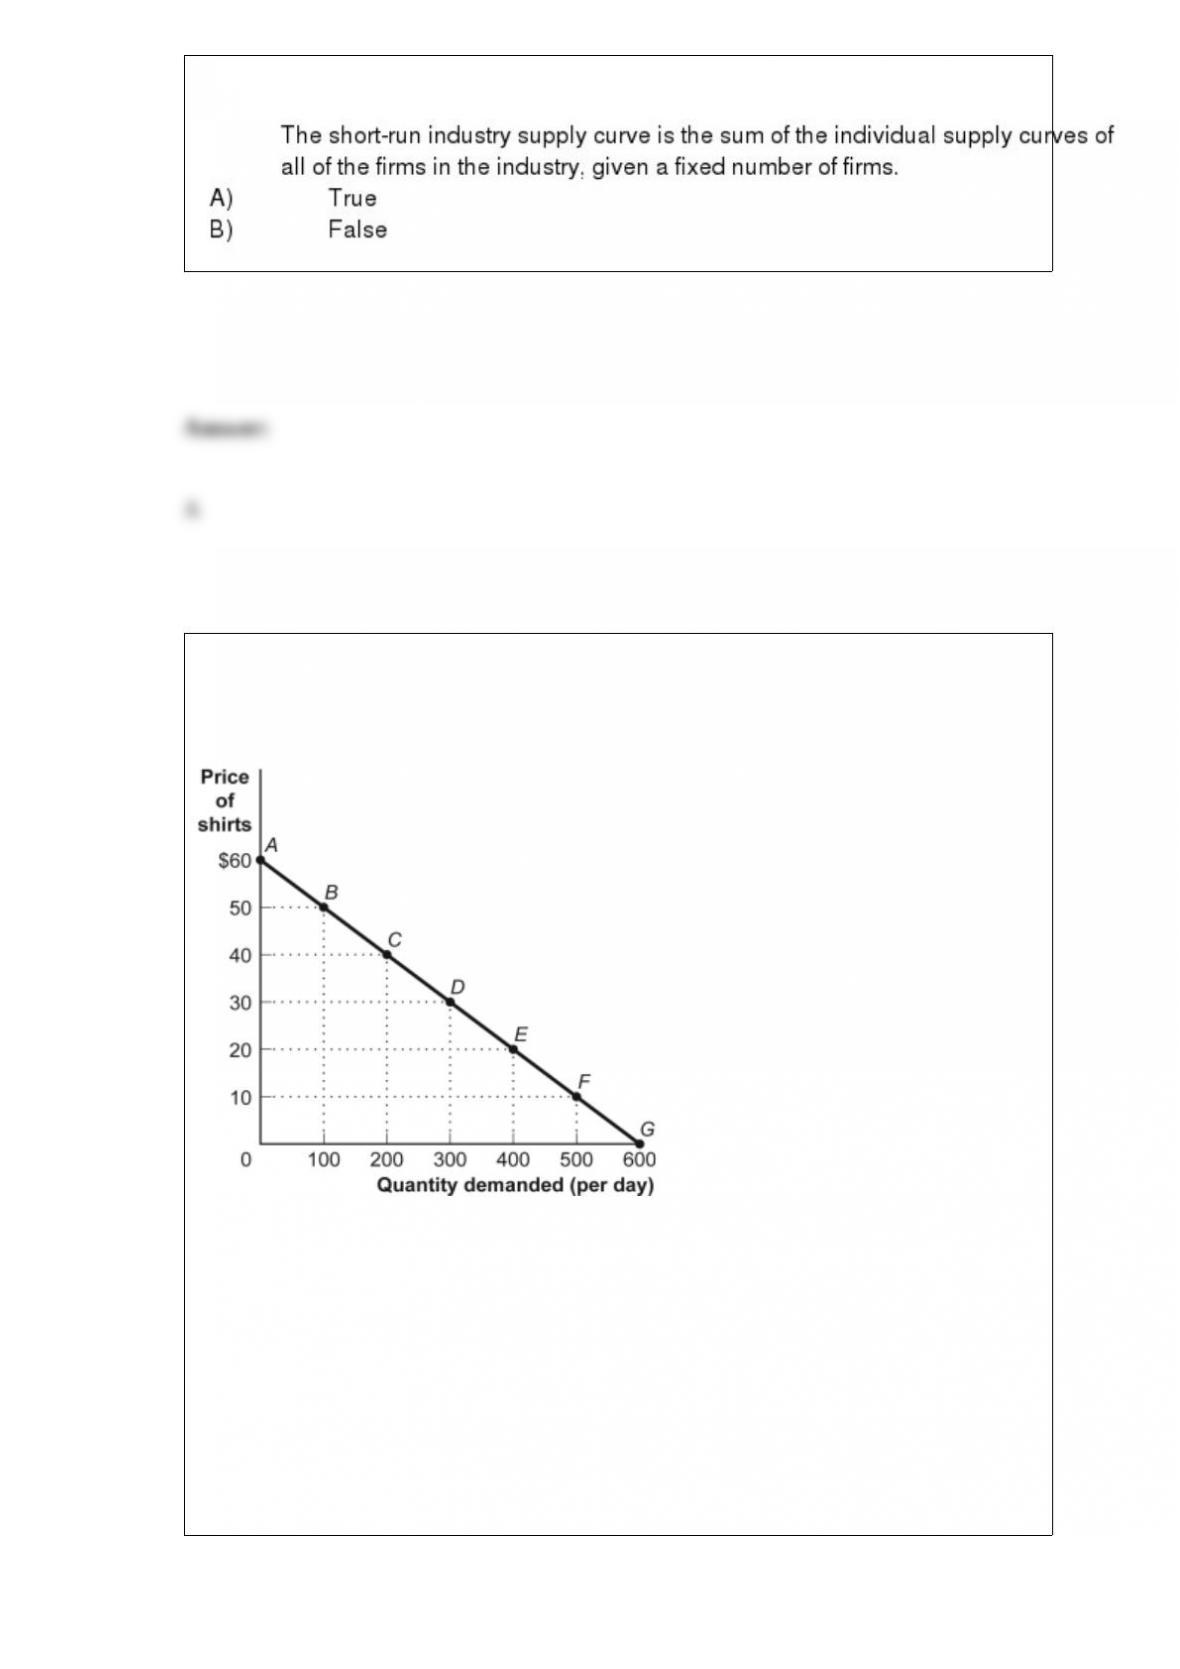
Figure: The Demand for Shirts
(Figure: The Demand for Shirts) Look at the figure The Demand for Shirts. If the price
is below _____, demand is inelastic.
A) $10
B) $20
C) $30
D) $40

A pie chart is used to depict information about:
A) the relative shares of categories of data.
B) the changes of a particular variable over time.
C) positive, not negative, relationships among variables.
D) the changes of a particular variable over time and positive relationships.
The pair of items that is most likely to have a negative cross-price elasticity of demand
is:
A) aspirin and hamburgers.
B) hot dogs and mustard.
C) margarine and butter.
D) ketchup and coffee.
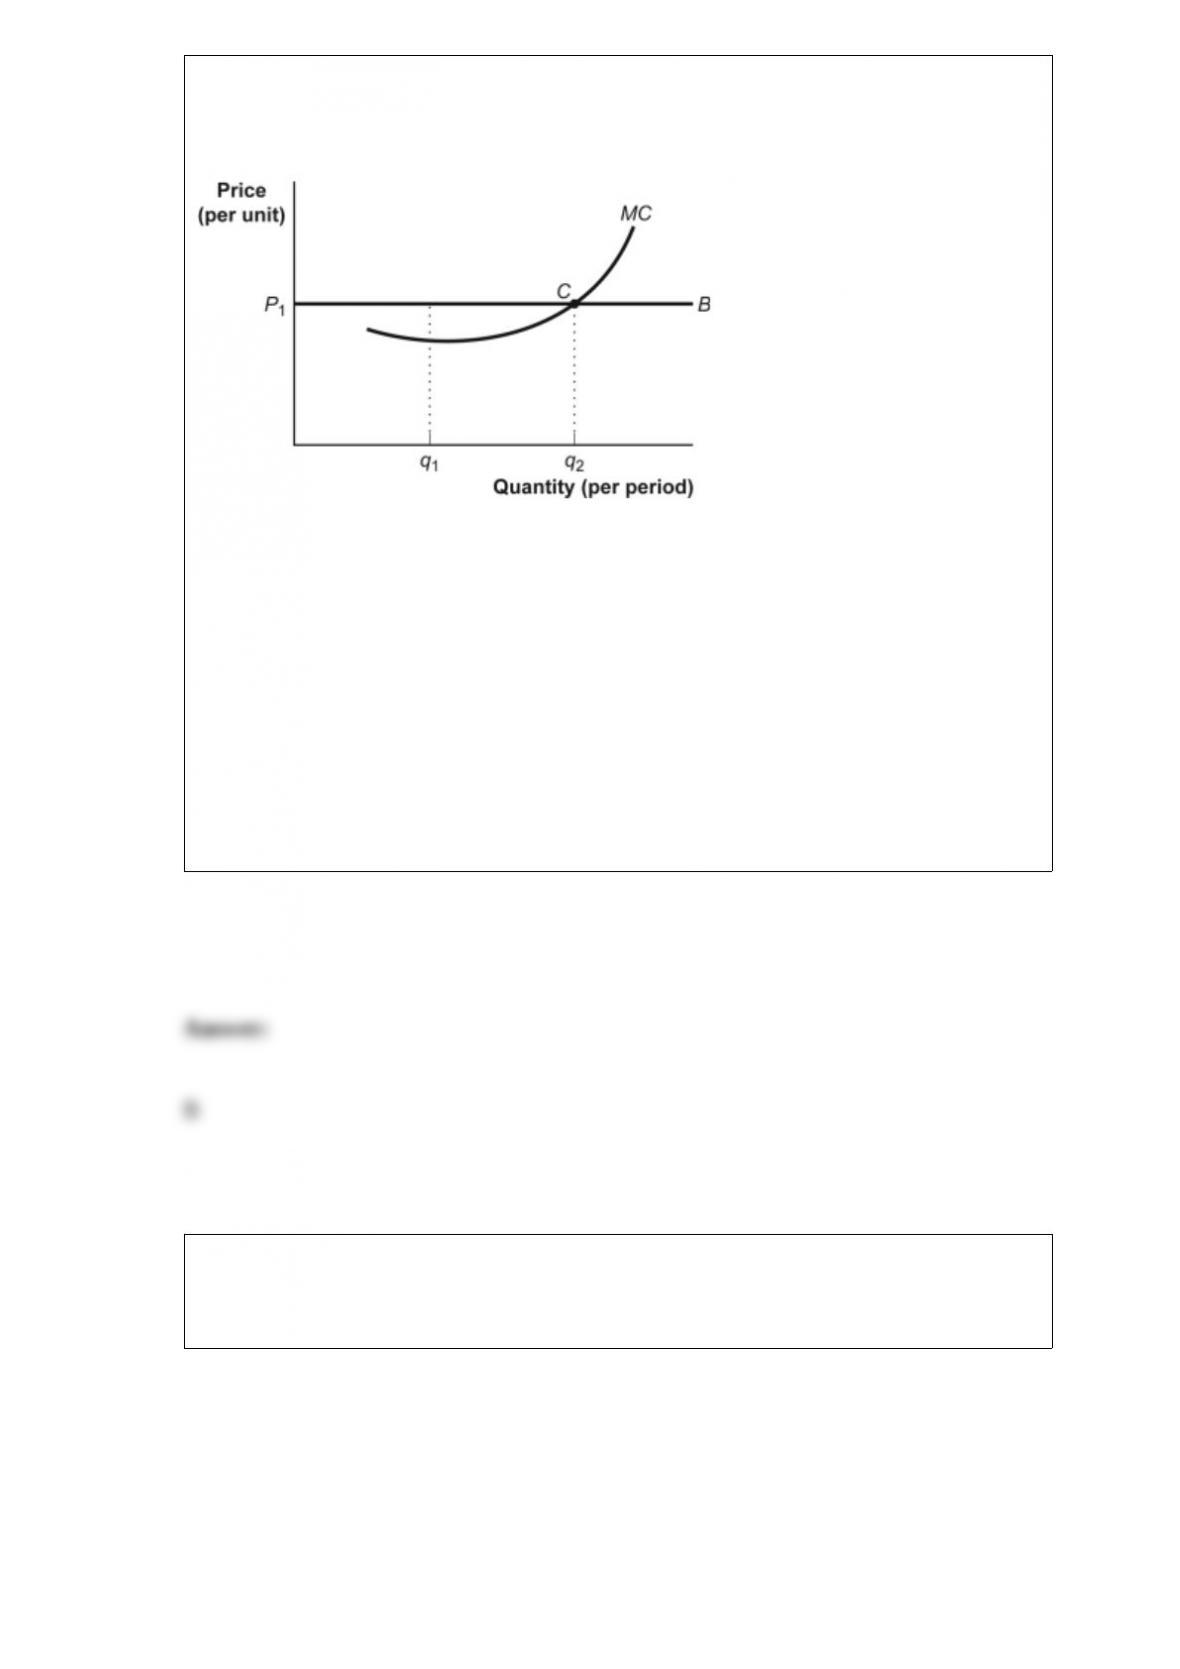
Figure: The Marginal Decision Rule
(Figure: Marginal Decision Rule) Look at the figure The Marginal Decision Rule. If P1
is the market price and if this firm is maximizing profit, it should produce:
A) where MR > MC.
B) at quantity q2.
C) at quantity q1, where MR > MC.
D) a quantity greater than q1 but less than q2.
Figure: The Market for Calculators
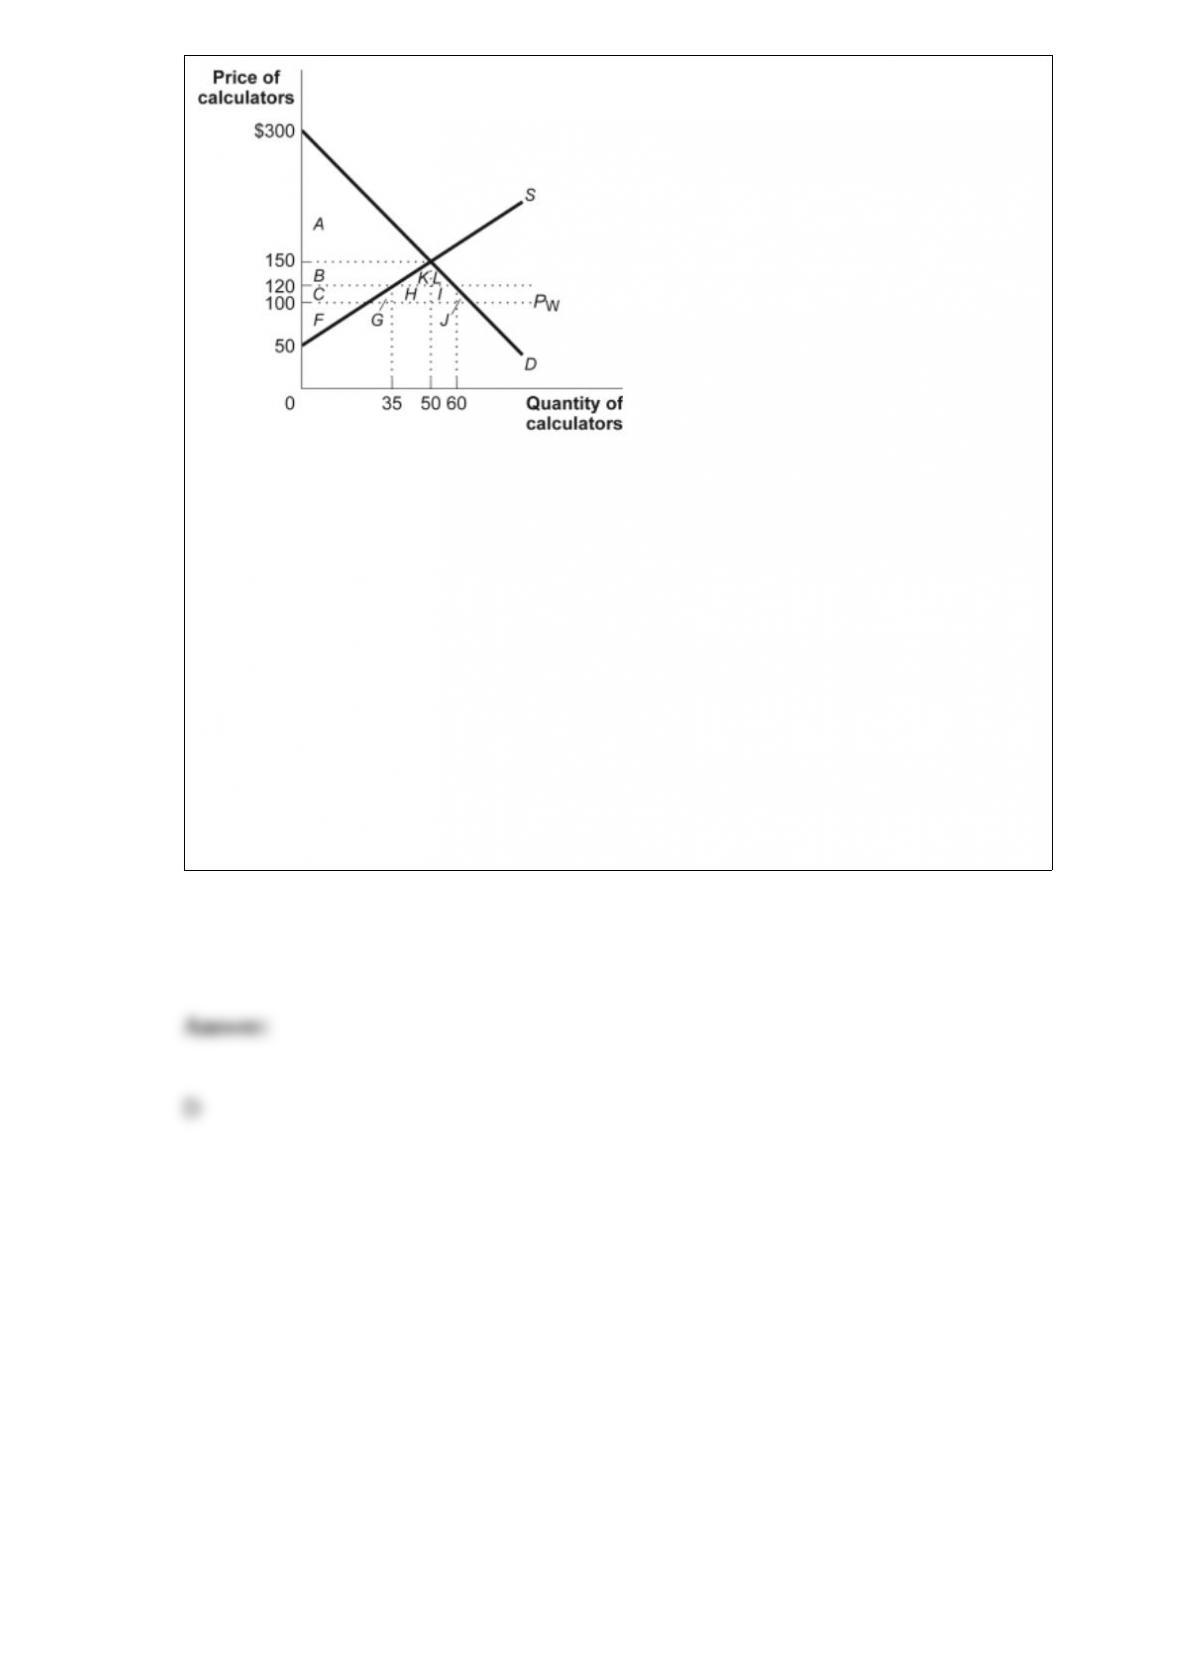
(Figure: The Market for Calculators) Look at the figure The Market for Calculators.
Assume that S and D represent the domestic demand and supply of calculators. The
world price, PW, equals $100. When the economy moves from autarky, under which the
price is $150, to free trade, consumer surplus rises by area _____ and producer surplus
falls by _____.
A) B + K + L; B
B) B + C + K + L; B + C + K + L
C) B + C+ H + I + K + L; B + C + H + I
D) B + C + G + H + I + J + K + L; B + C