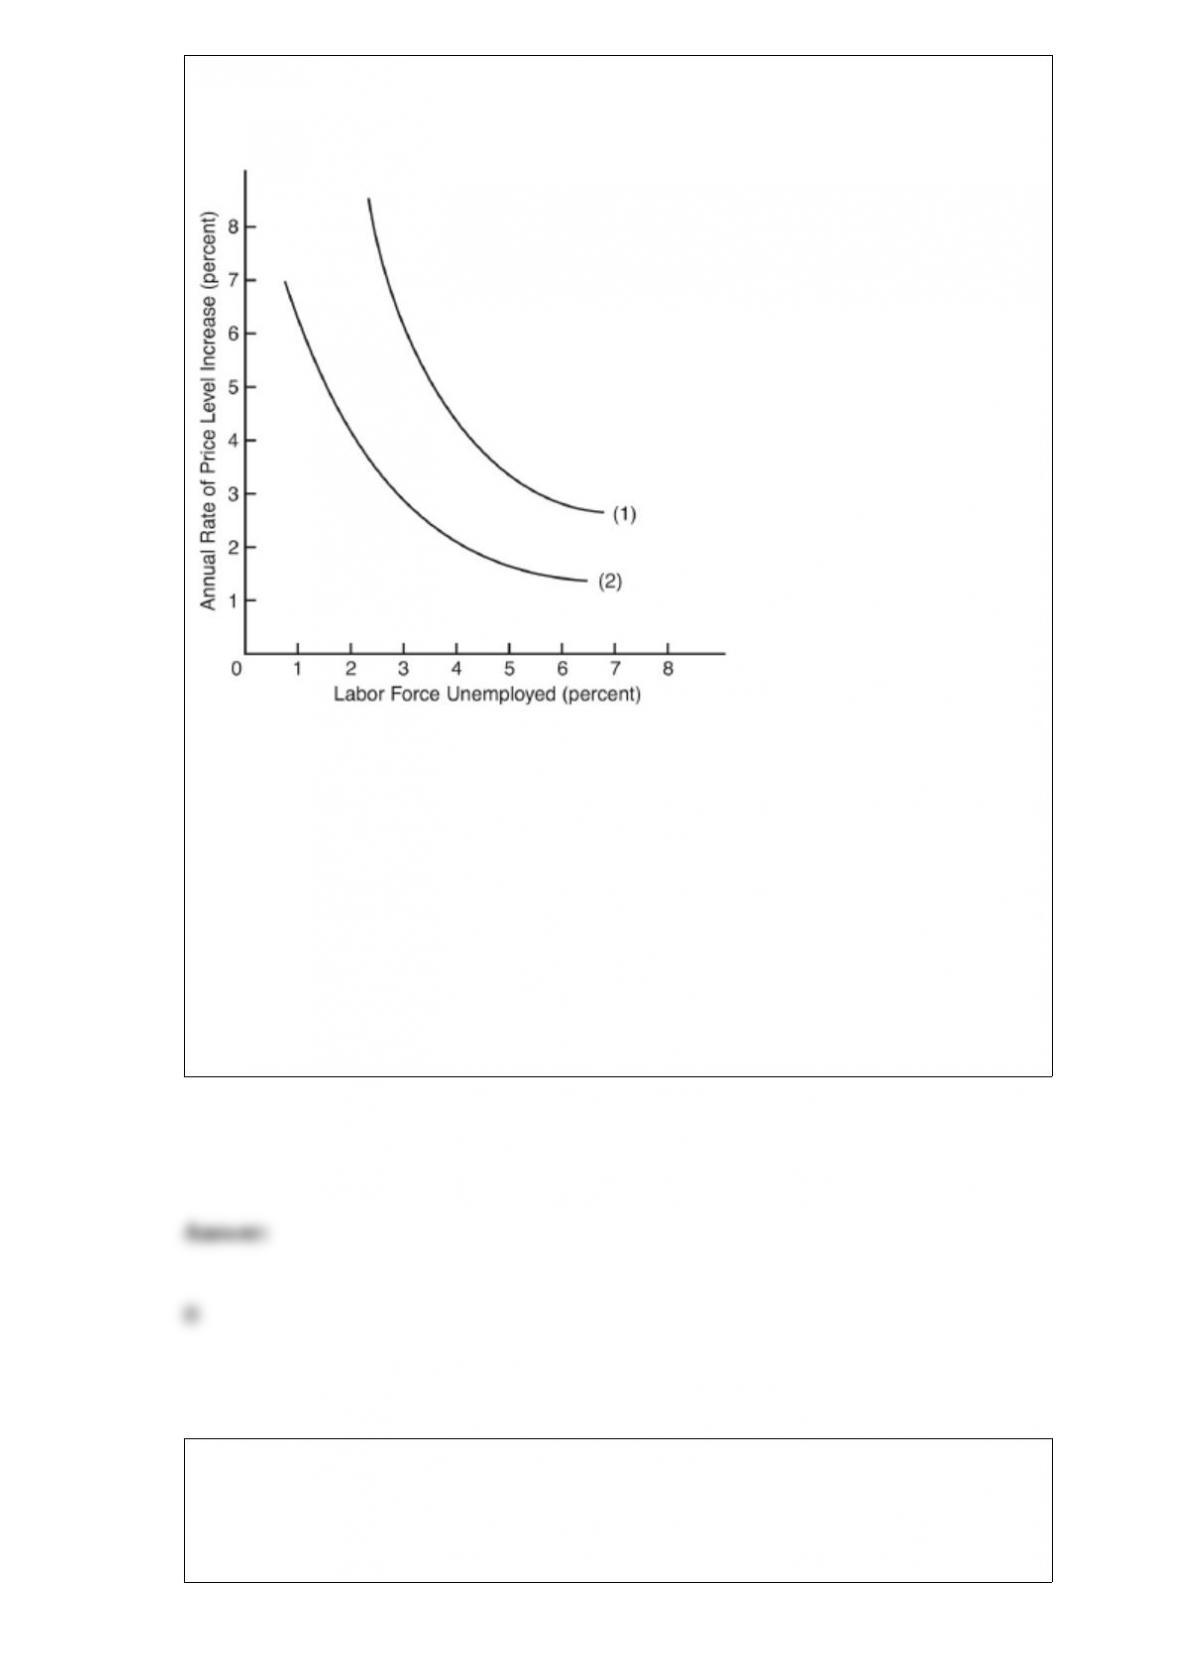
The following questions are based on the following graph, which shows two different
Phillips curves, labeled (1) and (2):
Phillips curve (2) could shift up to curve (1) as a result of
a. the decreased bargaining power of unions.
b. expectations of a higher rate of inflation.
c. a higher level of training of the labor force.
d. increased labor productivity.
e. decreased government spending.
A change in investment spending NOT caused by a change in income or GDP is a(n)
________ change.
a. induced

b. obscure
c. identical
d. autonomous
e. hypothetical
Profits as a reward to innovation is a concept most associated with
a. Karl Marx.
b. Henry George.
c. Frank Knight.
d. Thomas Malthus.
e. Joseph Schumpeter.
The following question is based on the following table:

Using the table above, 82 percent of the households in 2009 had annual incomes of
a. less than $15,000.
b. more than $25,000.
c. between $35,000 and $50,000.
d. at least $75,000.
e. more than $100,000.
The following questions are based on the following graph:
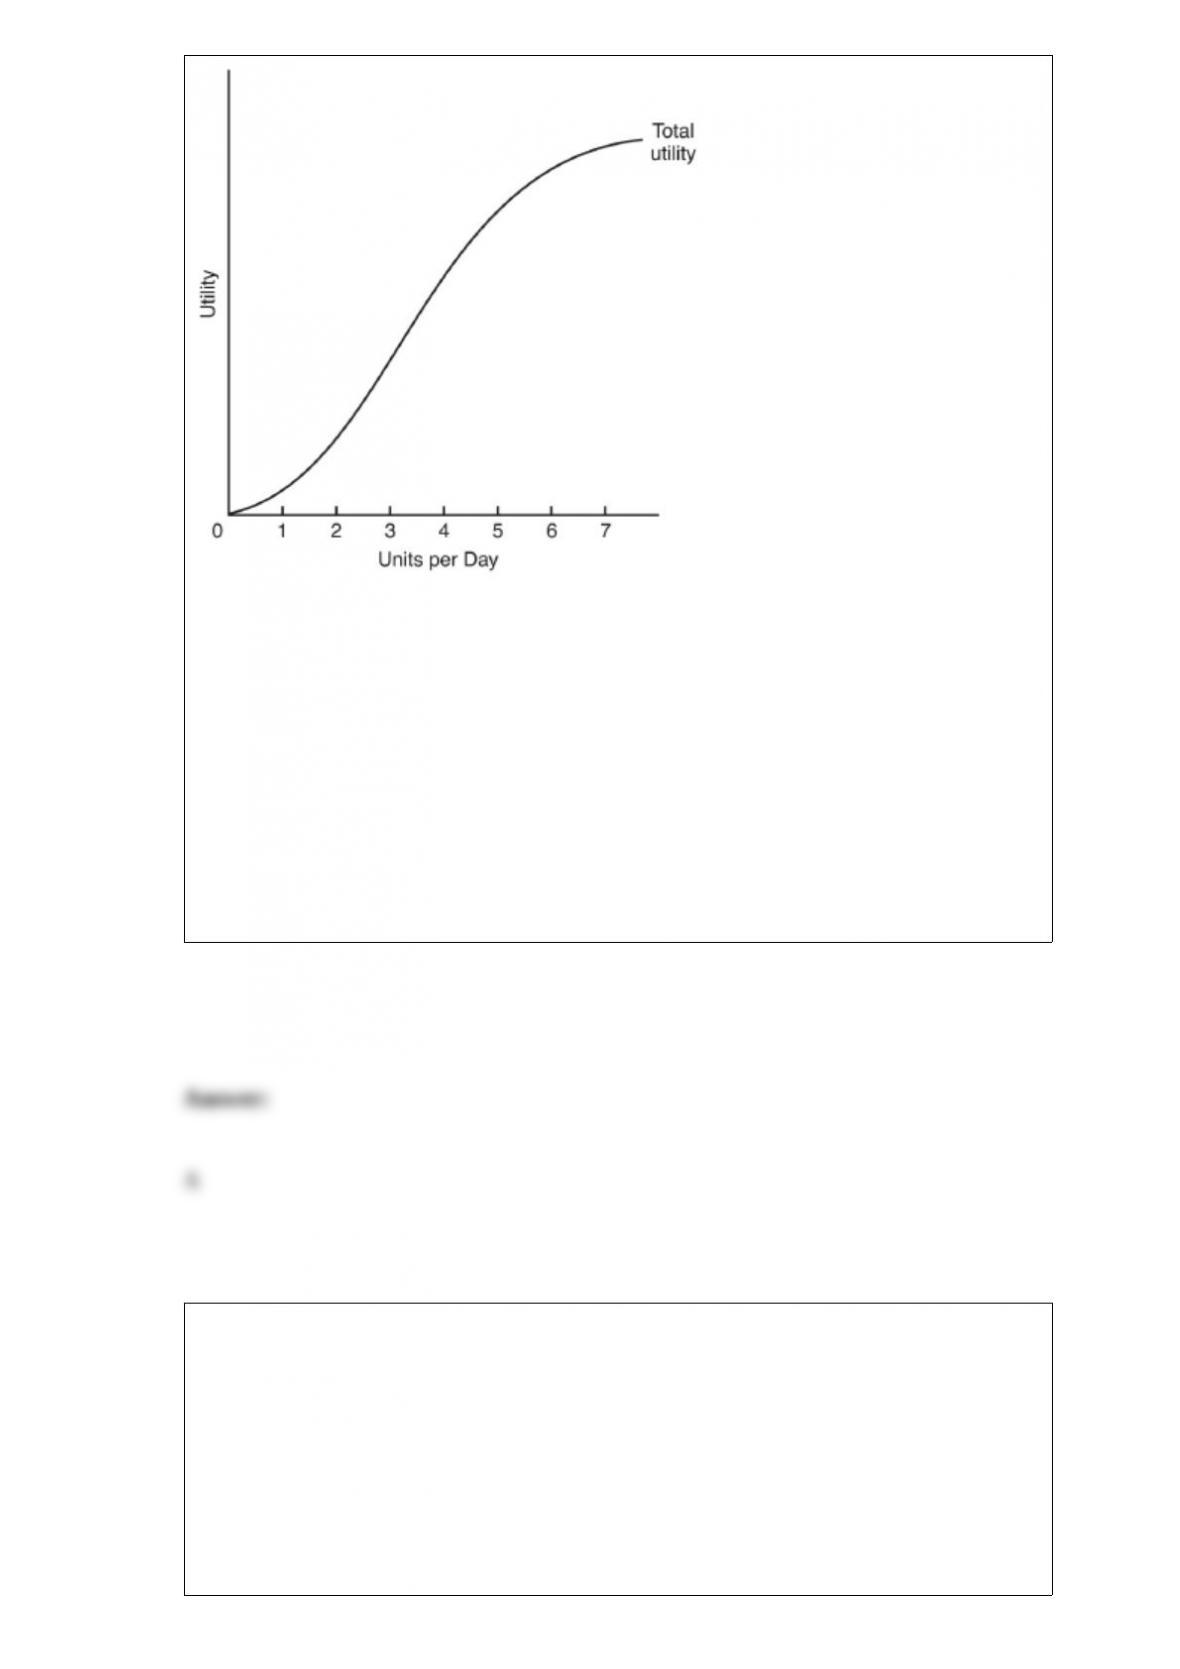
As consumption is increased from 1 to 3 units, marginal utility is
a. rising.
b. falling.
c. constant.
d. zero.
e. negative.
In the Stagflation video, economist Laffer argued that
a. a penny saved is a penny earned.
b. people do not work to pay taxes.
c. demand creates its own supply.
d. output per worker is a poor measure of productivity.

e. expected rates of return on R&D are positively correlated with the rate of inflation.
In the circular flow model, income to the household is, from the point of view of the
firm that pays this income, the same things as
a. investment.
b. savings.
c. revenue.
d. production costs.
e. working capital.
The value of money
a. rises during periods of inflation.
b. is inversely related to the price level.
c. is unaffected by creeping inflation.
d. has remained relatively constant in the United States over the past 25 years.
e. falls as real income rises.

A fall in which of the following increases the demand for large automobiles?
a. the price of small automobiles
b. the price of gasoline
c. the price of large automobiles
d. buyers’ incomes
e. consumers’ preferences for driving large automobiles
One function of the National Labor Relations Board is to
a. sanction strikes.
b. set wages and working conditions.
c. control the composition of the AFL-CIO.
d. hold elections to determine which, if any, union would represent various groups of
employees.
e. enforce compliance with the so-called American Labor Plan.
In economic analysis, the long run
a. is a period of time during which a firm may vary one or two of its inputs.
b. represents a planning horizon for a firm currently making an investment decision.
c. exists when all inputs are frozen.
d. is never realized.
e. is the time a firm needs to vary output to respond to changes in demand.
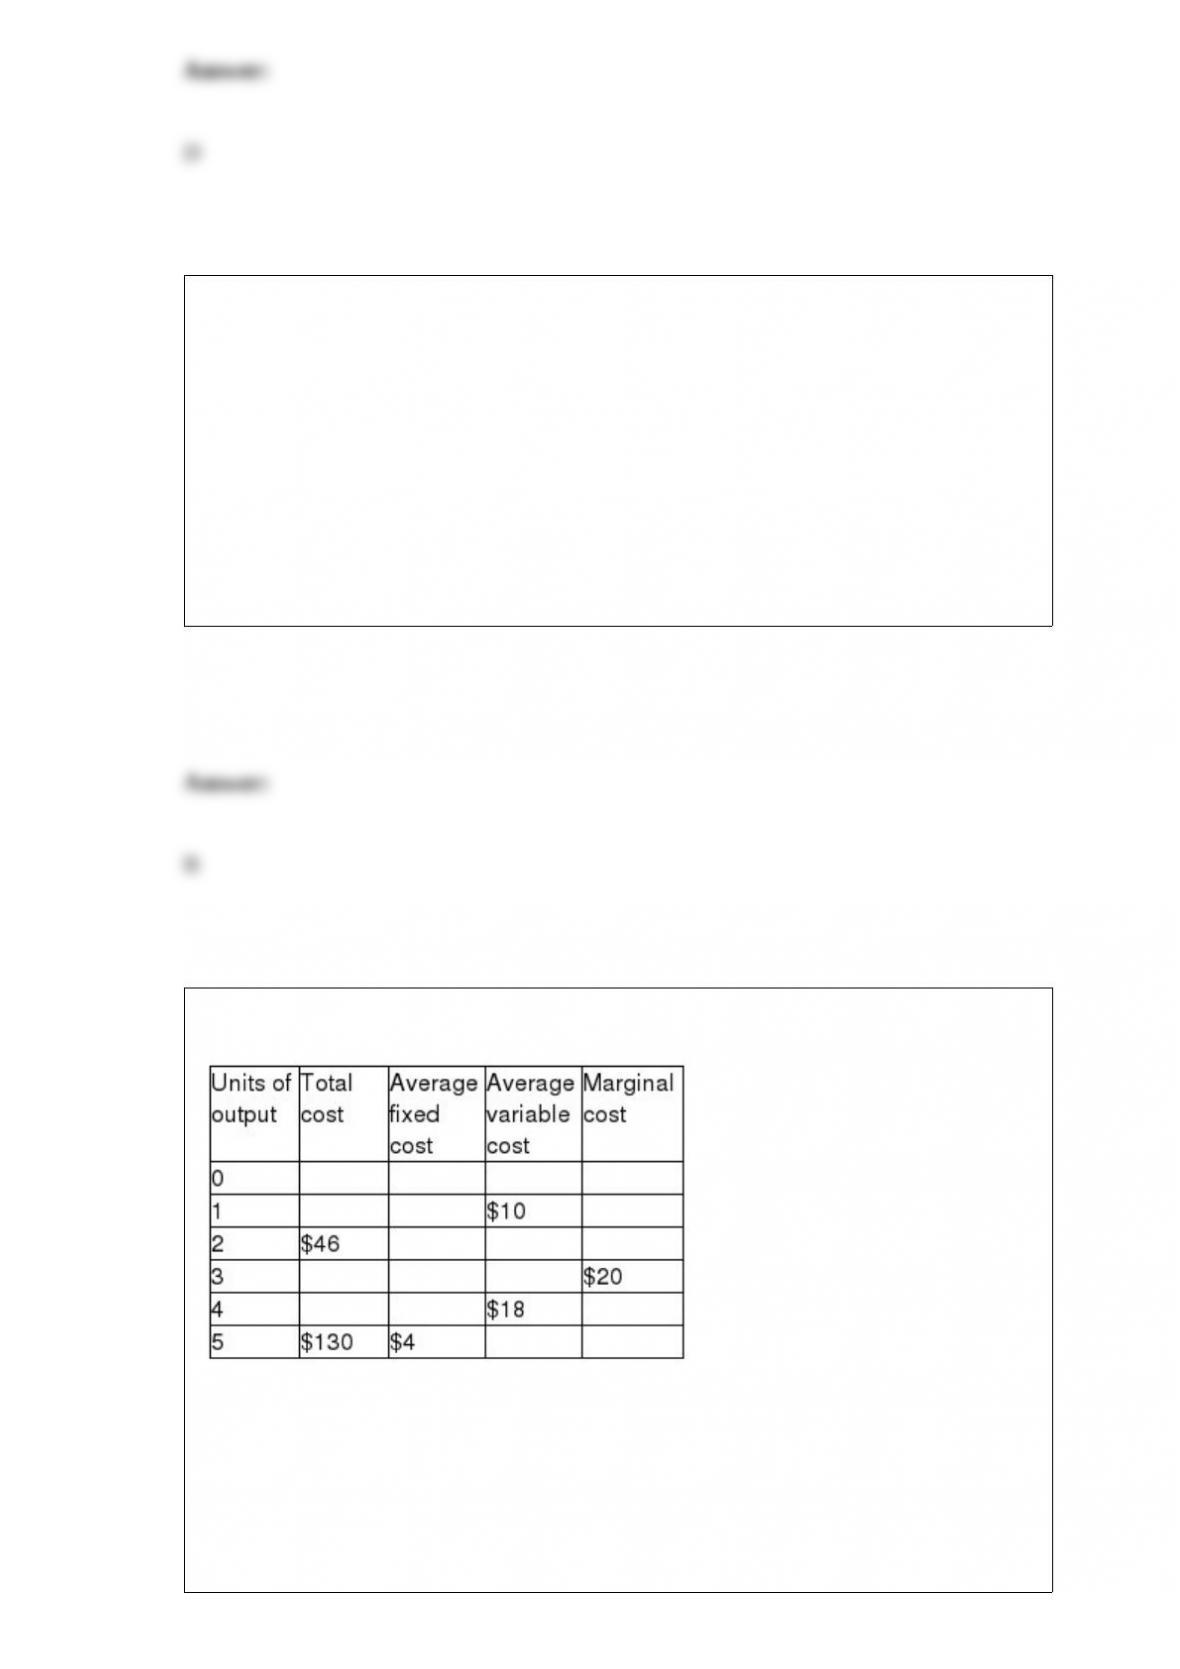
The following questions are based on the following table:
The average variable cost of producing 2 units is
a. $13.
b. $23.

c. $26.
d. $33.
e. $66.
The rate of economic growth and the rate of technological change are linked by the
a. rate of substitution of labor for capital.
b. diminishing marginal product of labor that induces greater capital investment.
c. rate of inflation, since rapid price changes induce the application of new techniques.
d. gap between actual and potential output, since massive unemployment can induce
labor-utilizing technological changes.
e. rate of innovation, since technological change must be applied to have an effect on
economic growth.
The following questions are based on the following graph:
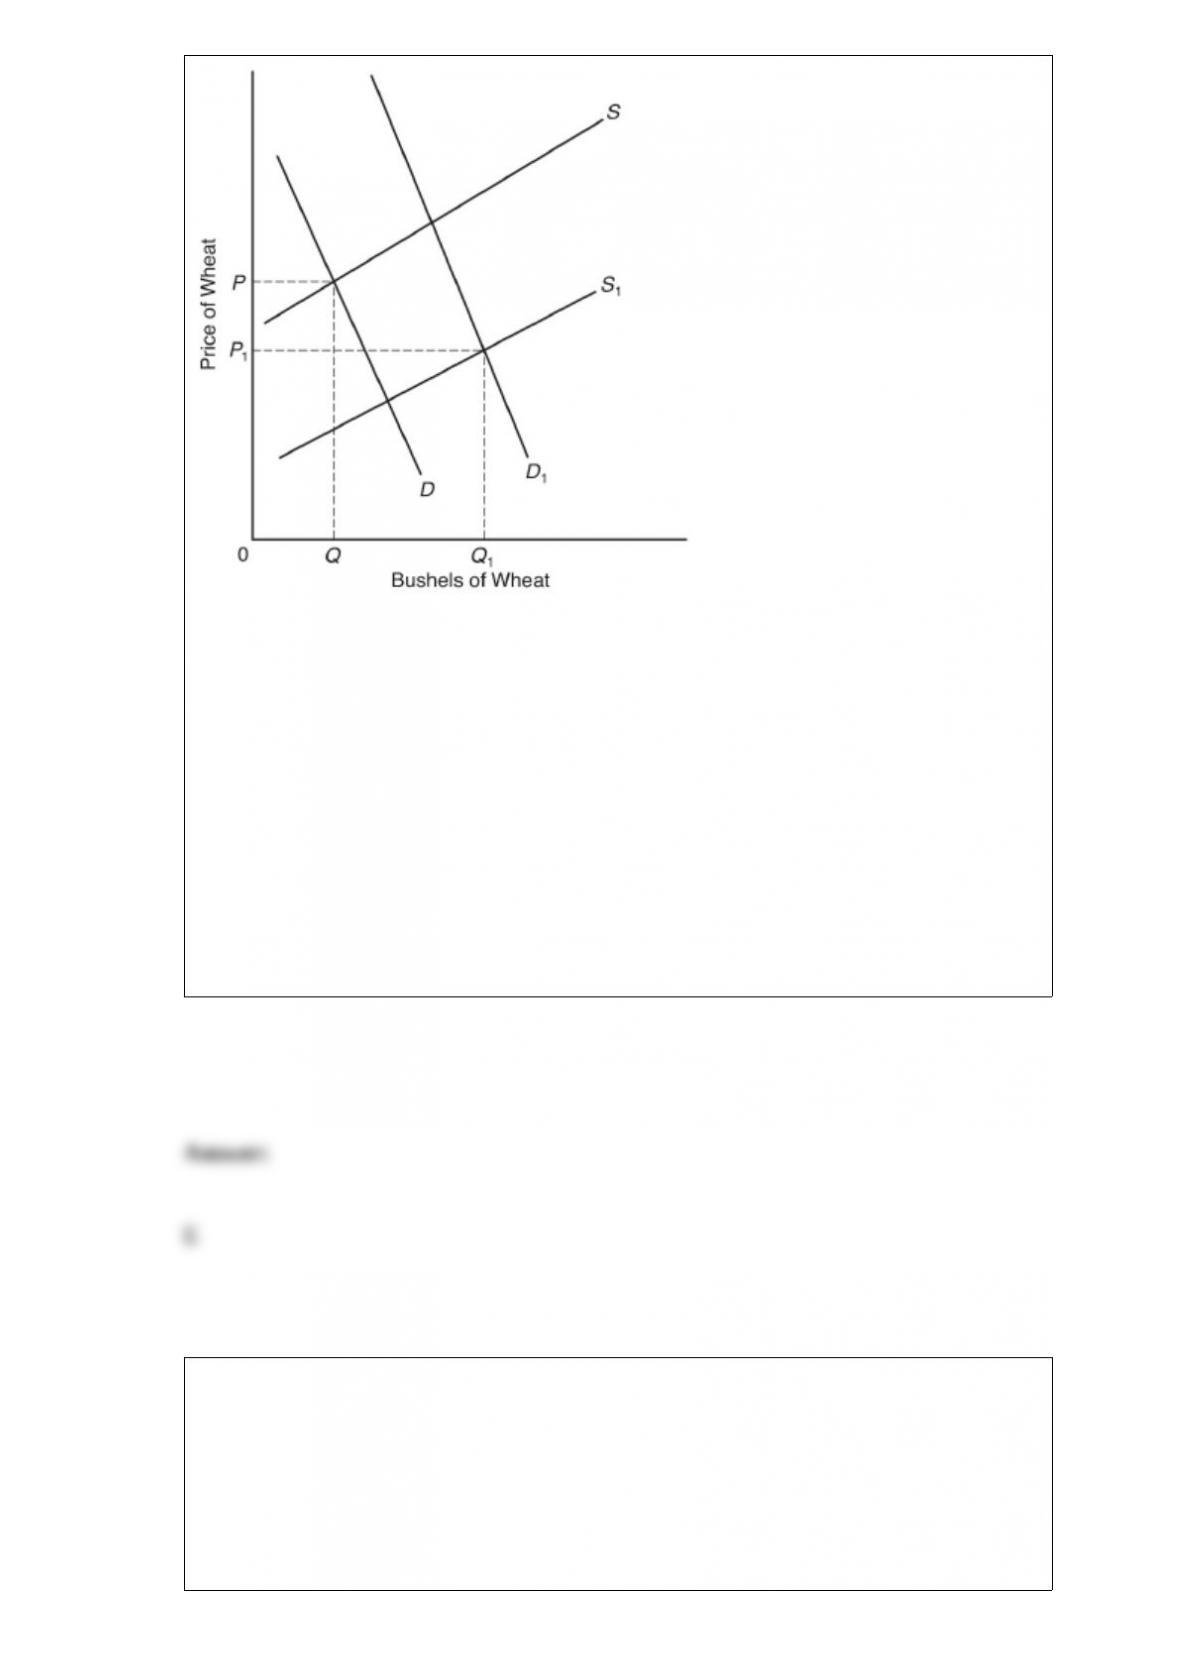
The curves D and S represent the market demand and supply curves for wheat in 1960.
The curves D1 and S1 represent the market demand and supply curves in 2000. Assume
there were no support programs in either year.
From the event depicted in the graph, one can conclude that, over the period in
question, wheat
a. prices and output fell. d. output and income fell.
b. prices and output rose. e. prices fell and output rose.
c. prices and income rose.
The patent system is based on the theory that
a. innovation is risky and those who take risks deserve rewards.
b. a monopoly’s lifespan should be controlled and limited.
c. technological advances should be shared throughout an industry.

d. monopoly is the most socially desirable market structure and should be supported.
e. patents create incentives to keep prices at competitive levels.
The consumption function expresses the relationship between consumption spending
and
a. investment spending.
b. aggregate supply.
c. disposable income.
d. savings.
e. the 45-degree line.
The following questions are based on the following graph:
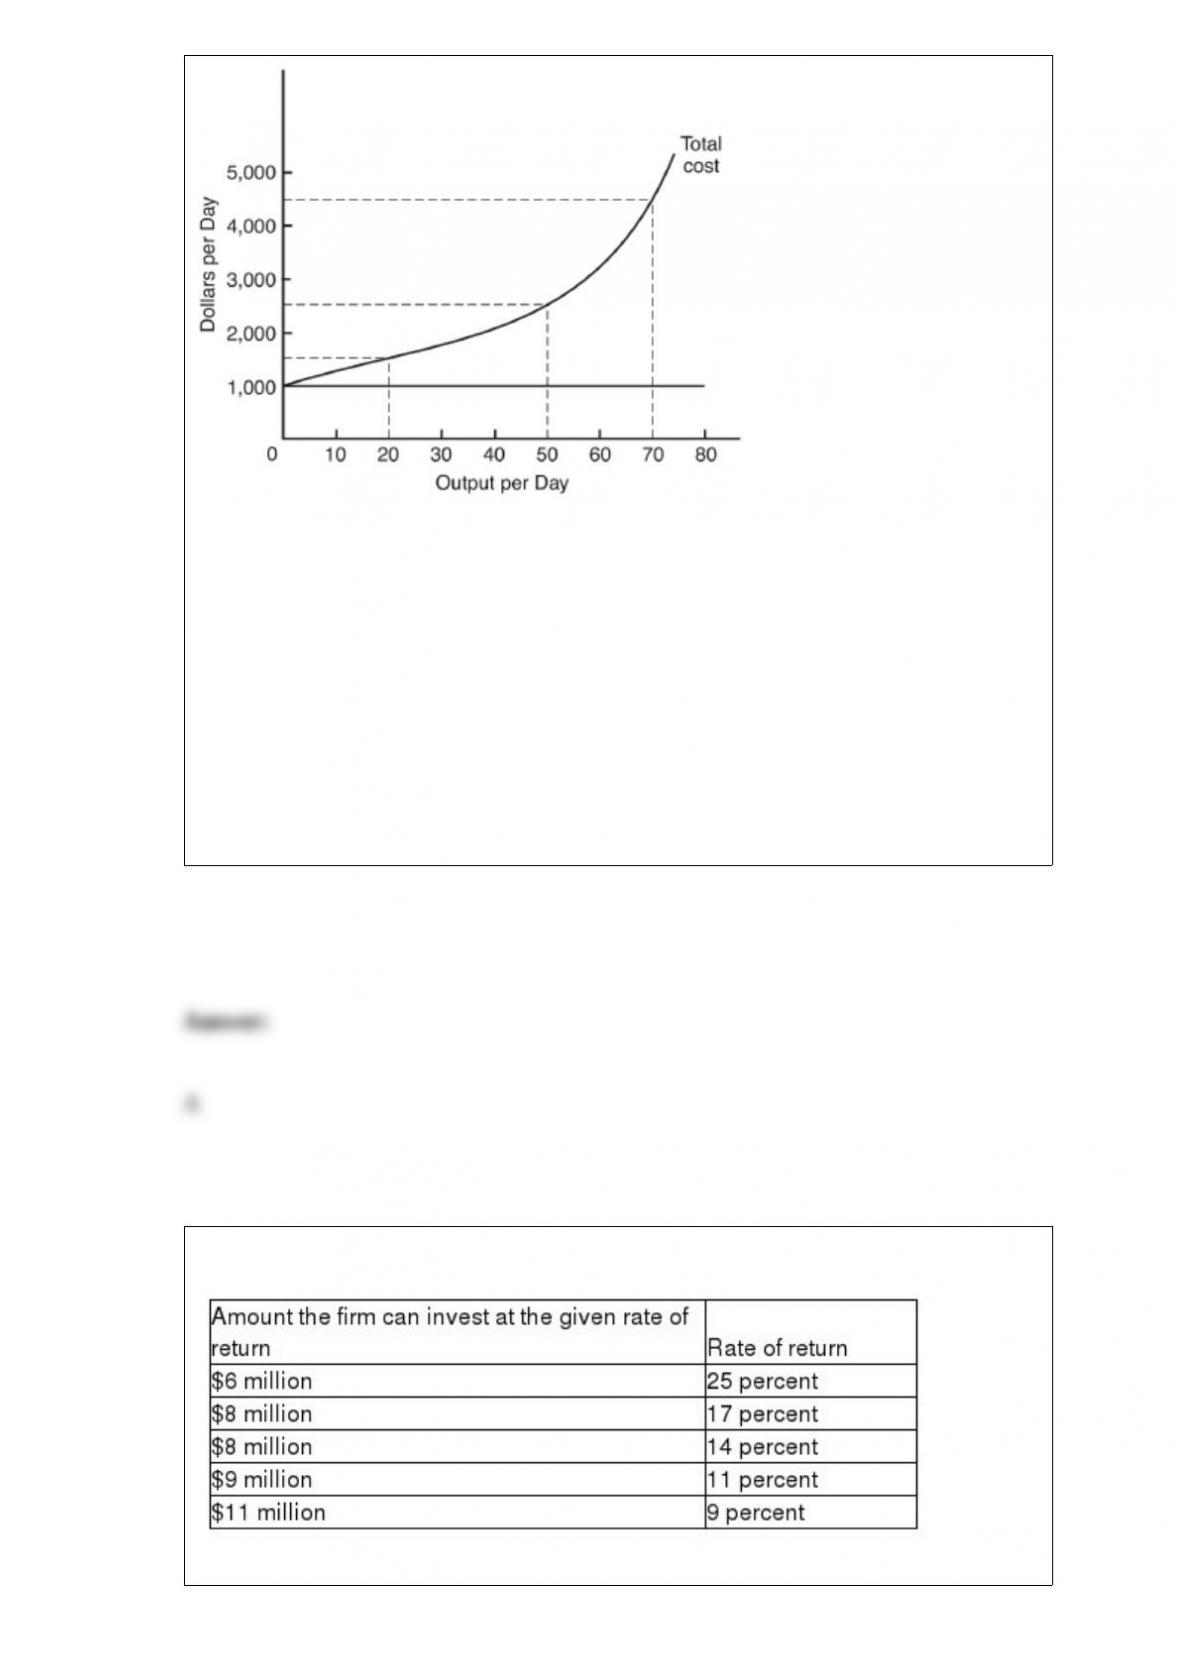
In the short run, when output is zero, ________ costs are zero.
a. total variable
b. total fixed
c. total
d. opportunity
e. market entry
The following questions are based on the following schedule:

If the interest rate is 12 percent, the firm will invest ________ million.
a. $8
b. $9
c. $20
d. $22
e. $28
An argument against income transfer programs is that they
a. do not work in the short run when help is needed.
b. provide incentives to work hard only for those who pay the taxes.
c. affect only the causes and not the symptoms of poverty.
d. discourage immigration of industrious foreigners.
e. provide economic disincentives to work, both to those who pay the taxes and those
who receive the transfers.
Which of the following policies would be LEAST desirable in helping to control
pollution?
a. tax credits for pollution control equipment
b. federal grants-in-aid to municipal and regional agencies for waste cleanup
c. zero economic growth
d. direct regulation
e. effluent fees
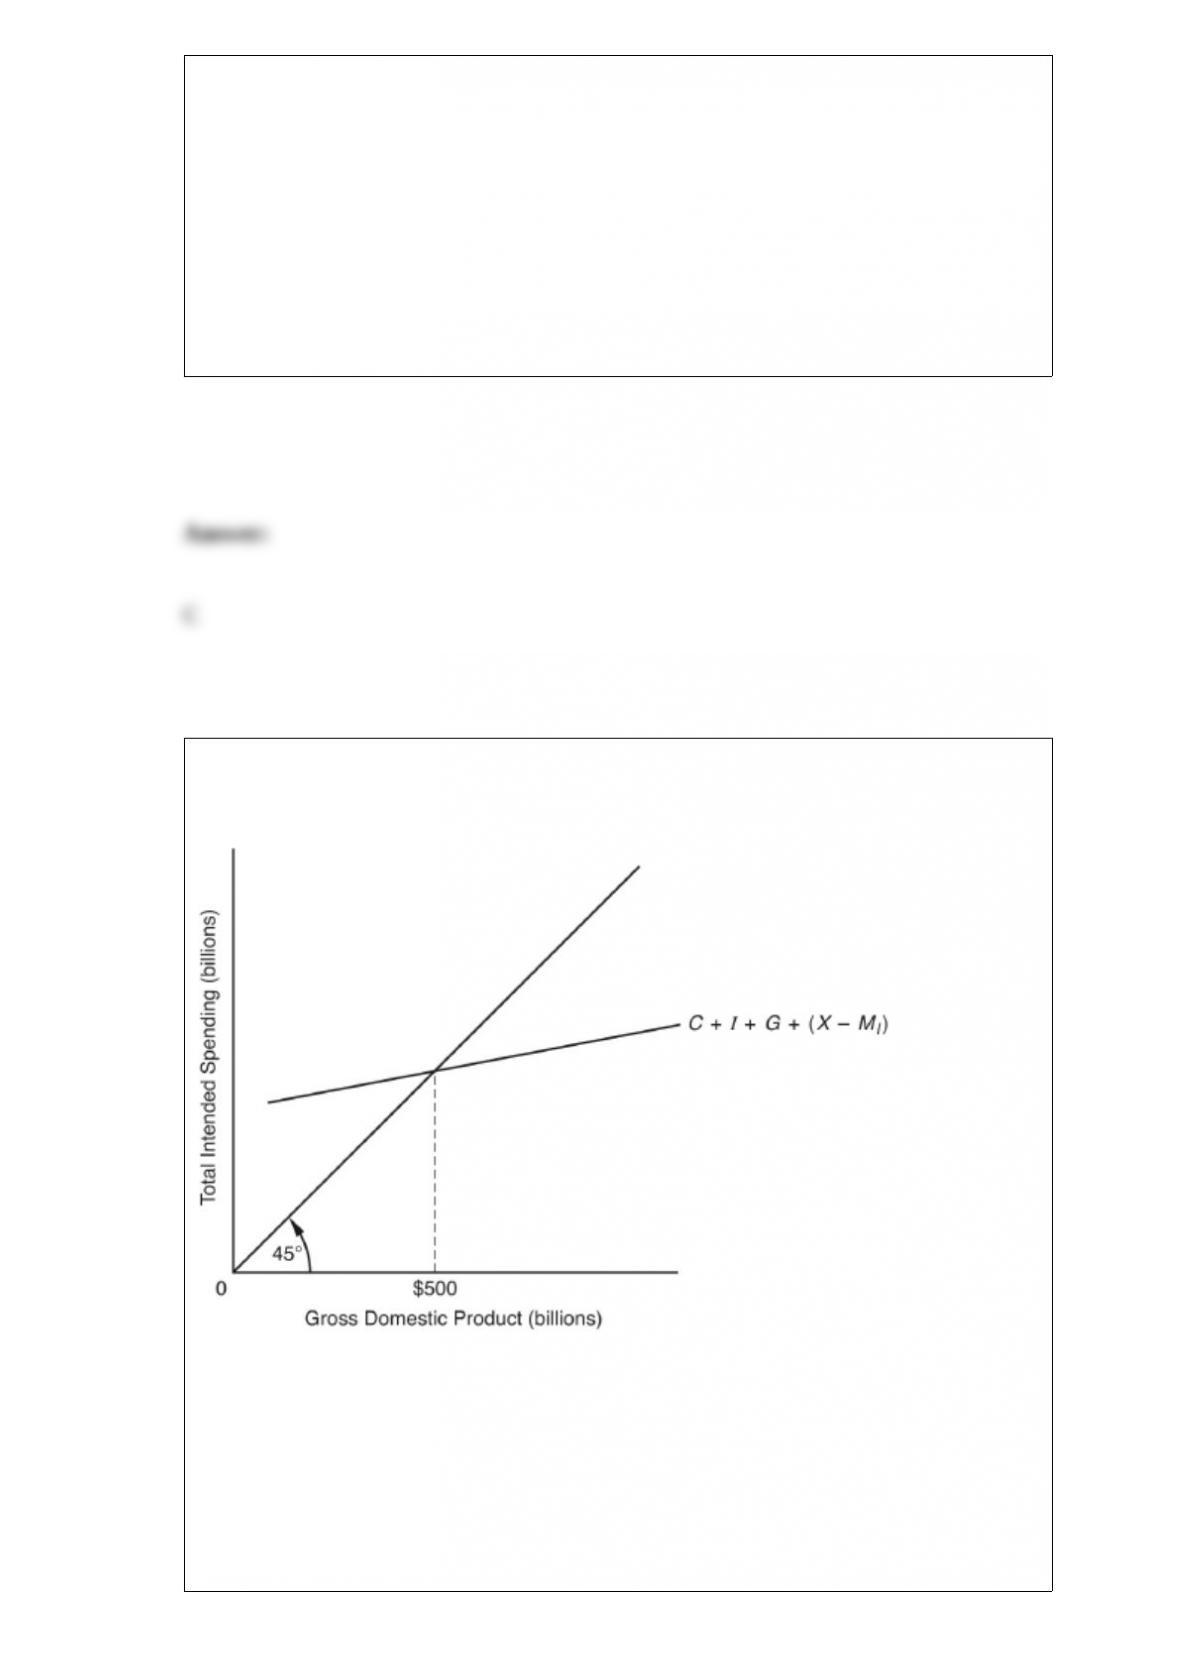
The following questions are based on the following diagram showing the equilibrium
level of GDP. Exports are currently $60 billion and imports are $40 billion.
If exports rise to $65 billion and imports rise to $50 billion, the C + I + G + (X ” MI)
line moves ________ billion.
a. up by $5
b. up by $15

c. down by $15
d. down by $10
e. down by $5
When the United States passed the Marine Mammals Act in the early 1990s because of
pressure from environmental groups, it
a. significantly increased the U.S. imports of Mexican tuna.
b. increased the demand for fish, while reducing the demand for seals.
c. violated World Trade Organization multilateral trade agreements.
d. prohibited the marine “ranching” of dolphins.
e. illustrated that significant environmental improvement can be achieved with no
additional costs to individuals and firms.
A cartel is
a. a formal collusive arrangement among firms.
b. found most of the time in monopolistic competition.
c. usually exempt from antitrust laws in the United States.

d. easier to maintain as the number of firms involved increases.
e. unlikely to occur in international markets.
The law of diminishing marginal returns does NOT apply to cases where
a. at least one input is fixed in quantity.
b. there is only one variable input.
c. technology changes.
d. average product is falling.
e. total product is rising.
Simultaneous high rates of inflation and unemployment are referred to as
a. push-pull inflation.
b. demand-pull inflation.
c. stagflation.
d. reflation.

e. prosperity.
One recent criticism of the airline industry deregulation that took place in the late 1970s
and early 1980s is that it led to
a. higher airline fares.
b. a reduction in air travel by the general public.
c. reduced airline efficiency.
d. packed airplanes and overcrowded airports.
e. reduced worker productivity in the industry.
If a perfectly competitive firm in the short run can sell its output at $2.50 per bushel and
it has an average variable cost of $1.75 per bushel and a marginal cost of $0.85 per
bushel, it should
a. expand output.
b. raise its price.
c. cut output to zero.
d. advertise.

e. do nothing at all; it is currently maximizing profits.
A perfectly competitive firm faces a demand curve that is
a. downward sloping.
b. horizontal.
c. greater than the market price.
d. equal to the total costs of production for each level of output.
e. nonexistent.
Empirical evidence from industrialized countries on the relationship between
population growth and output
a. clearly supports the Malthusian conclusions.
b. suggests little or no relationship between the rates of population growth and output
per person per year.
c. refutes the law of diminishing returns.
d. indicates that labor-intensive production techniques are more efficient.
e. suggests that technology has had a minimal impact on economic growth.

If the price level were to rise, people would find that to purchase the same goods and
services as before, they would need
a. higher interest rates.
b. consumer surpluses.
c. greater money balances.
d. functional finance.
e. special drawing rights.