
Assume a hypothetical case where an industry begins as perfectly competitive and then
becomes a monopoly. Which of the following statements comparing the conditions in
the industry under both market structures is true?
A) A monopoly will produce more and charge a higher price than would a perfectly
competitive industry producing the same good.
B) A monopoly will produce more and advertise more than would a perfectly
competitive industry producing the same good.
C) A monopoly will produce less and charge a higher price than would a perfectly
competitive industry producing the same good.
D) A monopoly will produce less and charge a lower price than would a perfectly
competitive industry producing the same good.
Competition among sellers generates
A) productive efficiency.
B) allocative efficiency.
C) equity.
D) scarcity.
If the long-run average cost curve is U-shaped, the optimal scale of production from
society’s viewpoint is
A) the minimum efficient scale.

B) where maximum economic profit is earned by producers.
C) where firm profit is large enough to finance research and development.
D) one which guarantees economic profit.
If productive efficiency characterizes a market
A) the marginal cost of production is minimized.
B) firms produce the goods that consumers desire most.
C) the output is being produced at the lowest possible cost.
D) firms use the best technology available to produce the good.
Equations for C, I, G, and NX are given below. If the equilibrium level of GDP is
$21,500, what is the marginal propensity to consume? C = 1,500 + (MPC)Y
I = 1,000
G = 2,000
NX = -200 A) 0.67
B) 0.75
C) 0.8
D) 0.9
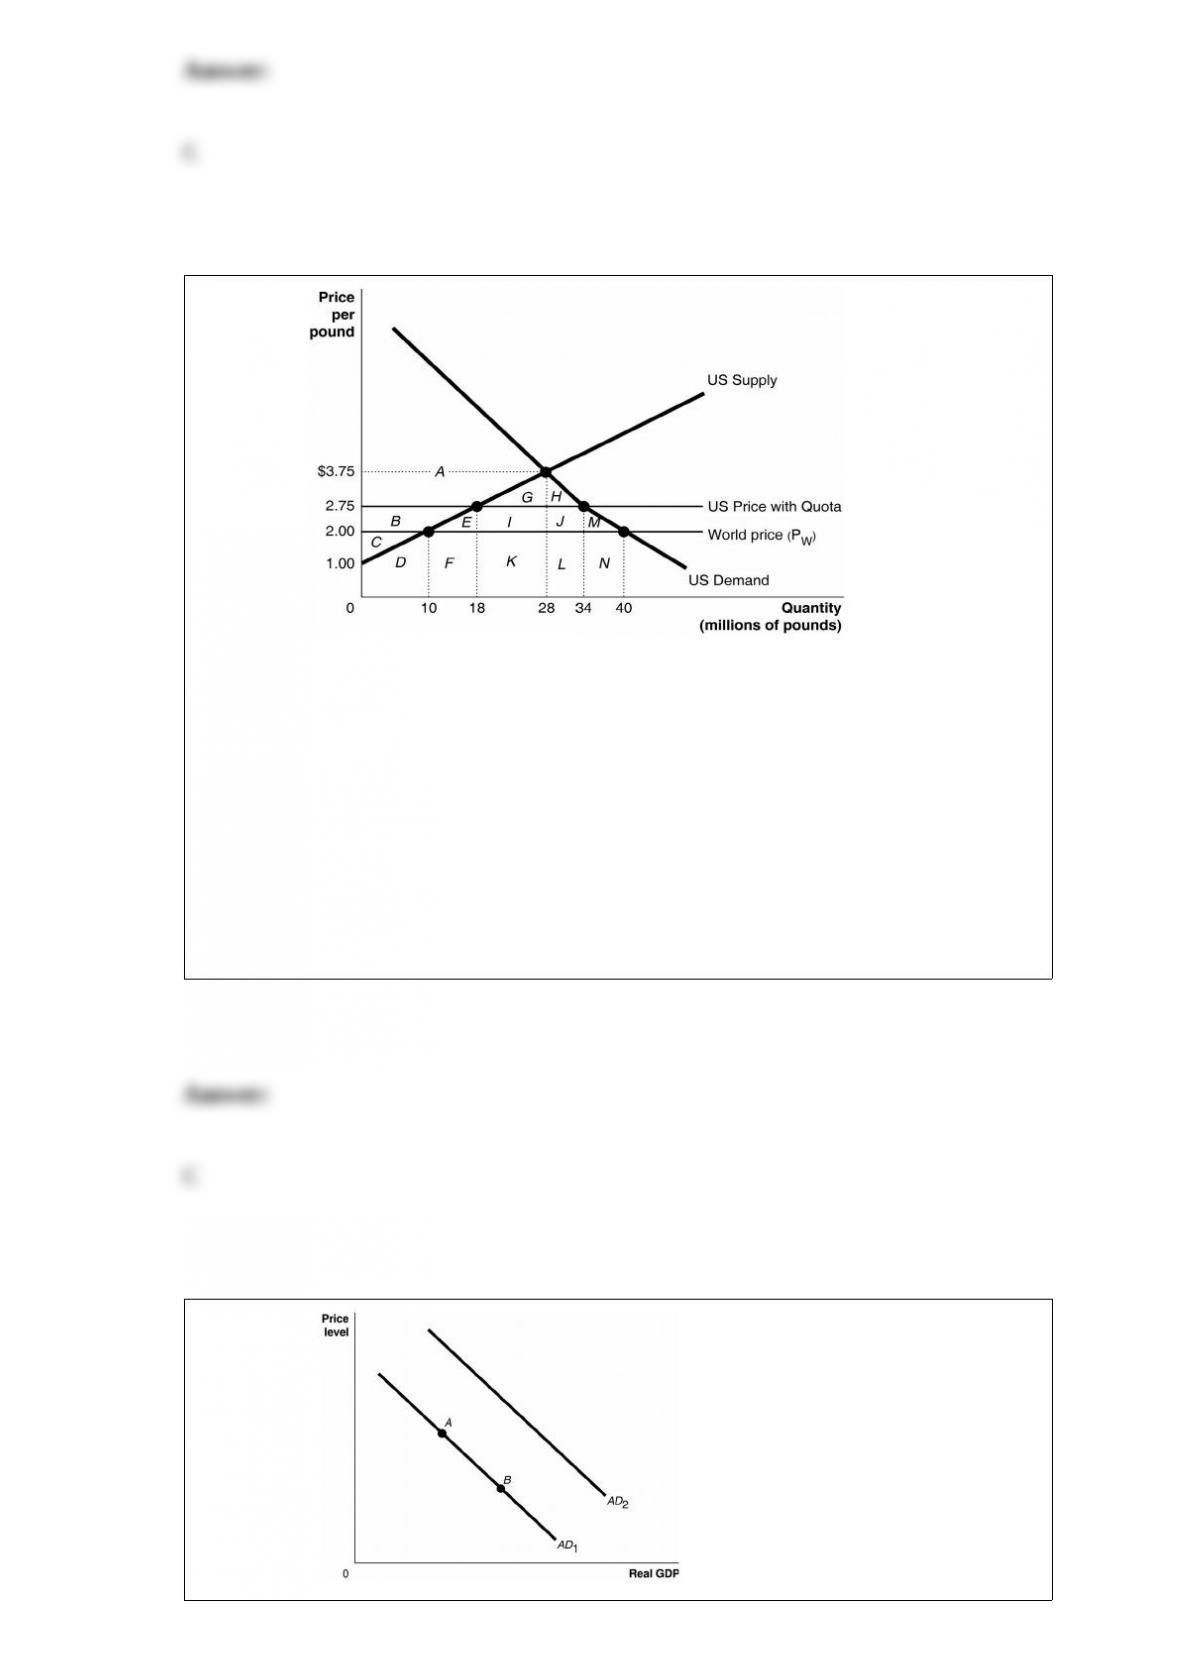
Figure 7-3 Since 1953 the
United States has imposed a quota to limit the imports of peanuts. Figure 7-3 illustrates
the impact of the quota. If there was no quota, how many pounds of peanuts would be
imported?
A) 16 million
B) 28 million
C) 30 million
D) 40 million
Figure 13-1

Ceteris paribus, a decrease in the price level would be represented by a movement from
A) AD1 to AD2.
B) AD2 to AD1.
C) point A to point B.
D) point B to point A.
What is a network externality?
A) It refers to having a network of suppliers and buyers for a good or service.
B) It refers to lobbying to form a public enterprise.
C) It refers to a situation in which a product’s usefulness increases with the number of
people using it.
D) It refers to a product that requires connection to a network for it to be useful.
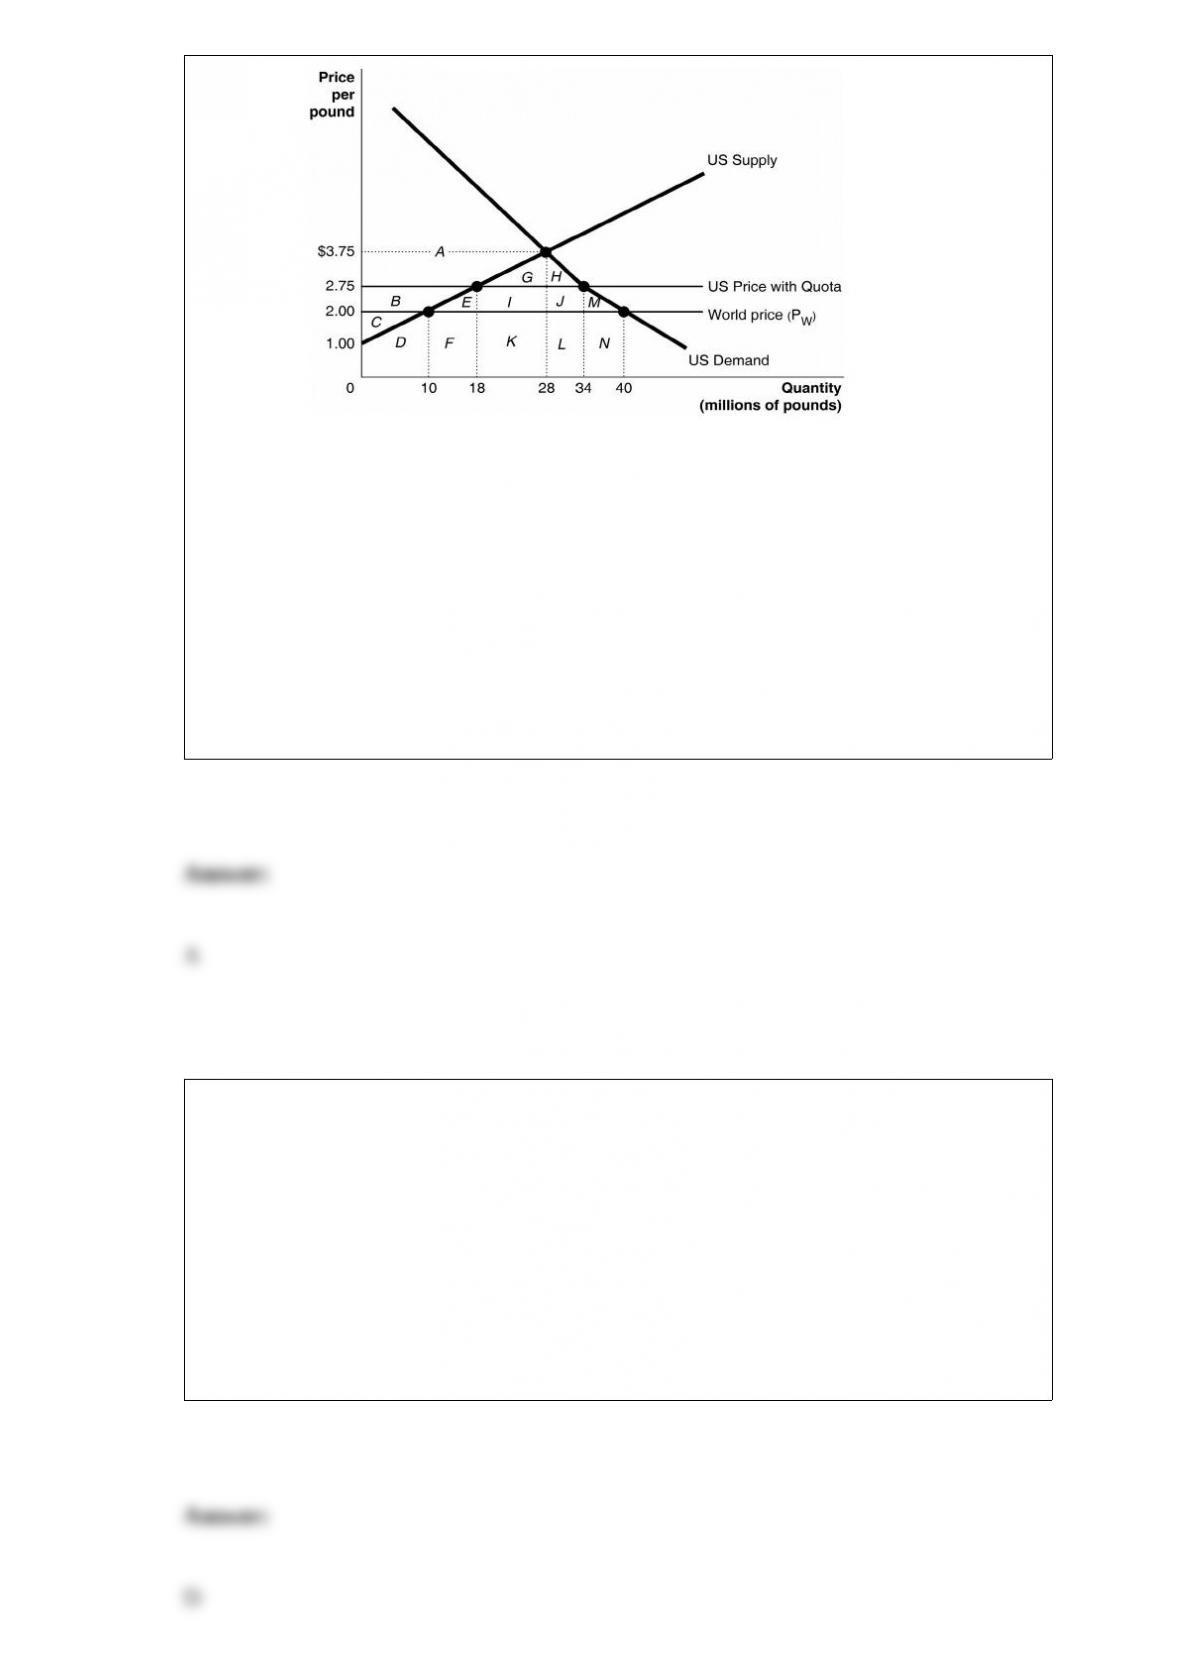
Figure 9-3 Since 1953 the
United States has imposed a quota to limit the imports of peanuts. Figure 9-3 illustrates
the impact of the quota. What is the value of domestic producer surplus without a
quota?
A) $5 million
B) $15.75 million
C) $38.5 million
D) $53.5 million
If a 35 percent increase in price of golf balls led to an 42 percent decrease in quantity
demanded, then the demand for golf balls is
A) unit-elastic.
B) perfectly elastic.
C) relatively inelastic.
D) relatively elastic.
A constant cost, perfectly competitive market is in long-run equilibrium. At present,
there are 1,000 firms each producing 400 units of output. The price of the good is $60.
Now suppose there is a sudden increase in demand for the industry’s product which
causes the price of the good to rise to $64. In the new long-run equilibrium, how will
the average total cost of producing the good compare to what it was before the price of
the good rose?
A) The average total cost will be higher than it was before the price increase since the
increase in demand will drive up input prices.
B) The average total cost will be lower than it was before the price increase because of
economies of scale.
C) The average total cost will be higher than it was before the price increase because of
diseconomies of scale arising from the increased demand.
D) The average total cost will be the same as it was before the price increase.
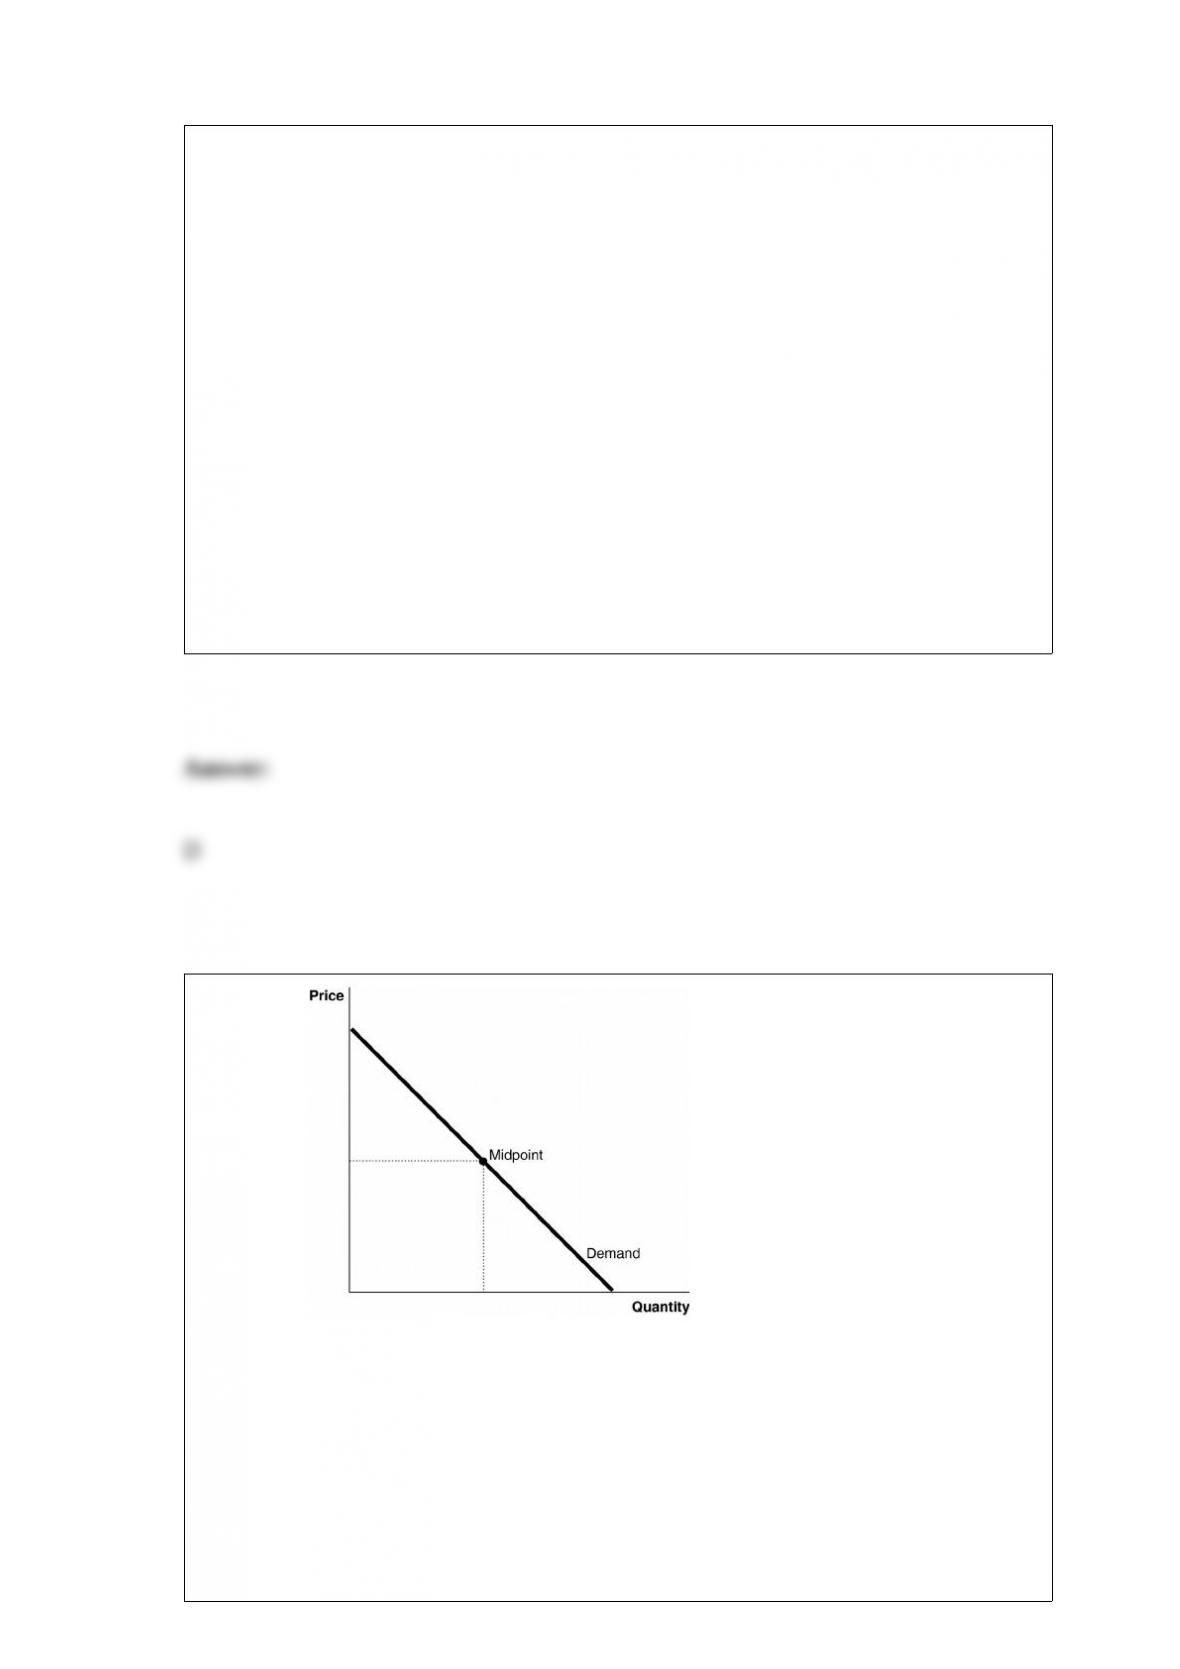
Figure 6-4
At the midpoint of the demand curve, in absolute value,
A) the price elasticity coefficient is at a maximum.
B) the price elasticity coefficient is at a minimum.
C) the price elasticity coefficient is zero.

D) the price elasticity coefficient is one.
The demand curve for the monopoly’s product is
A) the market demand for the product.
B) more elastic than the market demand for the product.
C) more inelastic than the market demand for the product.
D) undefined.
In the mid-1990s, cattle ranchers in the United States kept raising cattle even though
prices were at a ten-year low and below average total cost. What is the likely
explanation for this?
A) Continuing to operate resulted in smaller losses than would have been incurred by
shutting down.
B) The ranchers were hoping to receive government subsidies.
C) The exit costs were too high.
D) Cattle is an important source of protein and its production is essential for the United
States.