
Under autarky, domestic producer surplus is represented by the area
A) above the supply curve and below the equilibrium price.
B) above the supply curve and below the demand curve.
C) below the demand curve and above the equilibrium price.
D) above the demand curve and below the supply curve.
An increase in the price level results in a(n) ________ in household consumption
spending and a(n) ________ in investment spending.
A) increase; decrease
B) increase; increase
C) decrease; decrease
D) decrease; increase
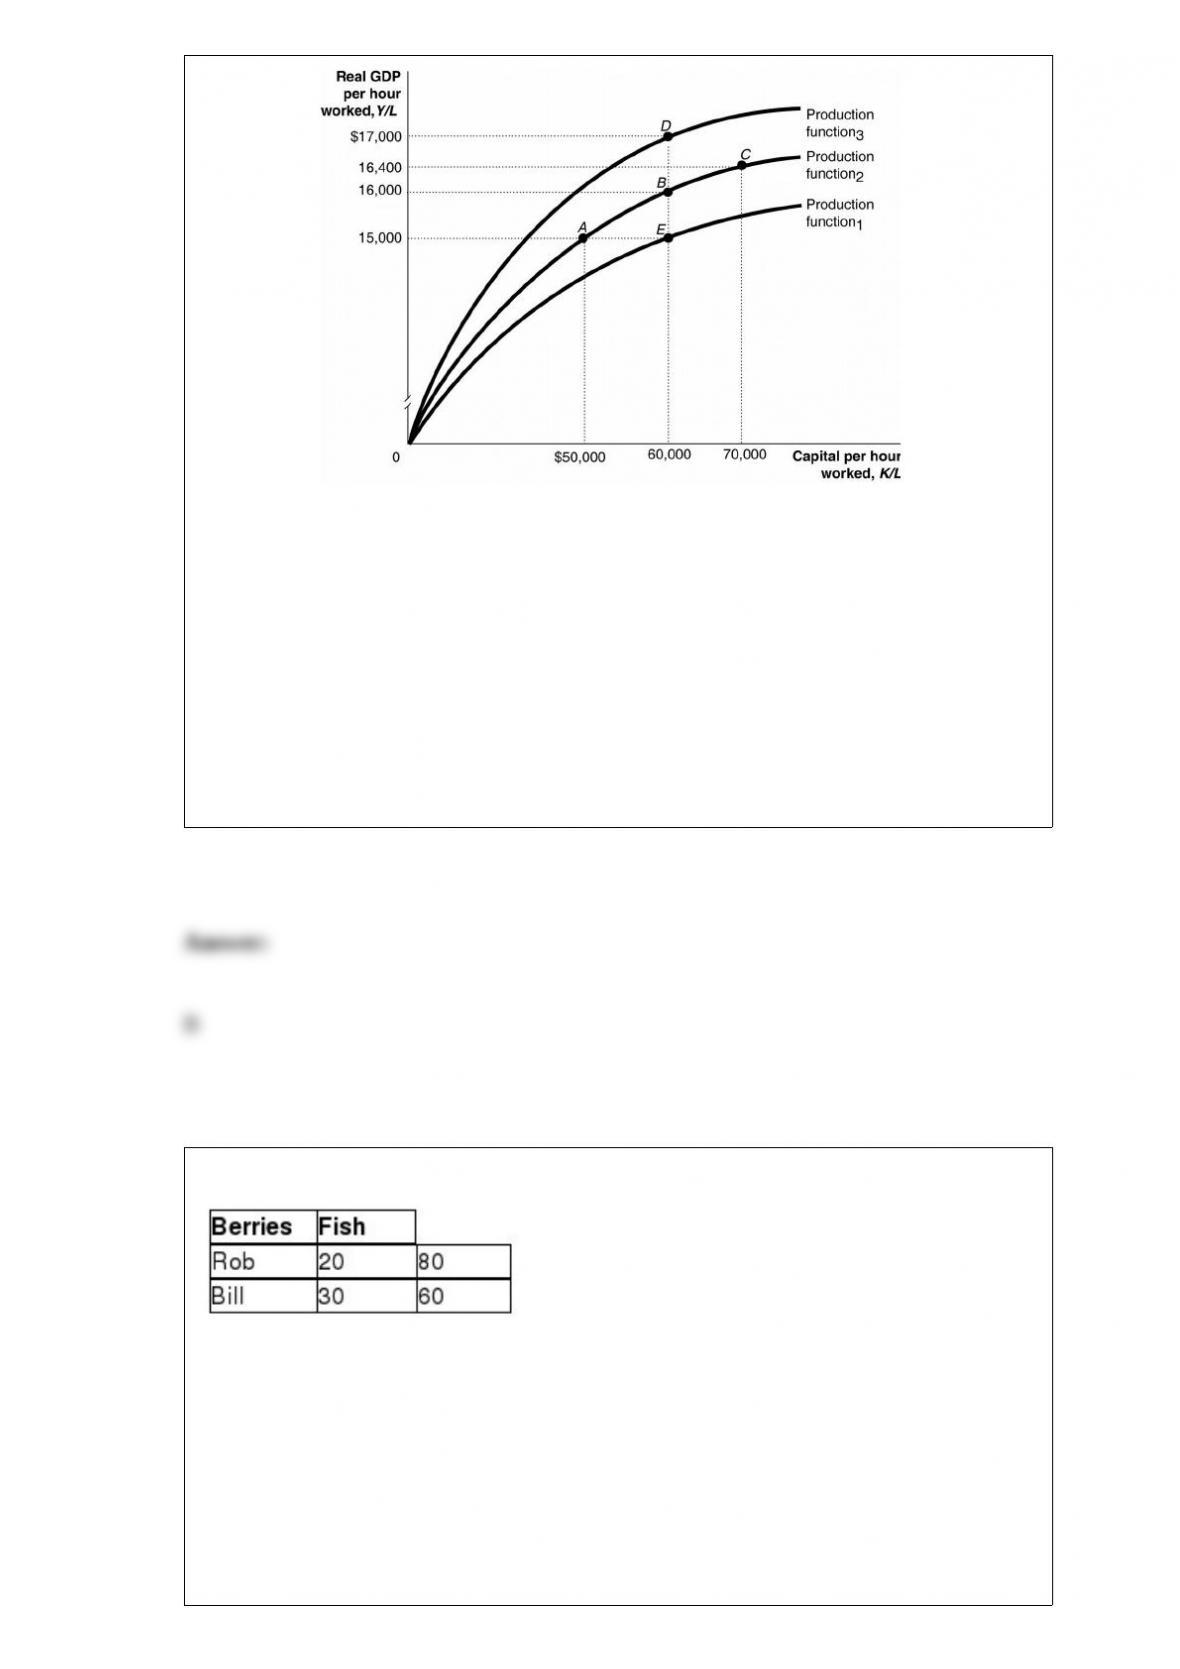
Figure 22-4
Using the per-worker production function in the figure above, the largest changes in an
economy’s standard of living would be achieved by a movement from
A) A to B to C.
B) E to B to D.
C) C to B to A.
D) D to B to E.
Table 9-4
Rob Crusoe and Bill Friday spent their week-long vacation on a desert island where
they had to find and make their own food. Rob and Bill spent one day each fishing and
picking berries. The table lists the pounds of output Rob and Bill produced. Use the
table above to select the statement that accurately interprets the data in the table.
A) Rob has an absolute advantage in picking berries and Bill has an absolute advantage
in catching fish.
B) Bill has an absolute advantage in picking berries and Rob has an absolute advantage

in catching fish.
C) Bill has an absolute advantage in picking berries and catching fish.
D) Rob has an absolute advantage in picking berries and catching fish.
In the long run, most economists agree that a permanent increase in government
spending leads to
A) no decrease in private spending.
B) a decrease in private spending by less than the amount that government spending
increased.
C) a decrease in private spending by the same amount that government spending
increased.
D) a decrease in private spending by more than the amount that government spending
increased.
Article Summary. Since 2008, the United States has been involved in trade
negotiations over the Trans-Pacific Partnership (TPP), a free trade agreement with
11 other countries on both sides of the Pacific Ocean. One area of the negotiations
involves patents and intellectual property rights in the pharmaceutical industry. A
number of developing countries have ignored international agreements concerning
patents and intellectual property rights as a way to benefit their domestic
pharmaceutical industries, to the detriment of those companies which have spent
considerable time and money developing new medicines. For every 5,000 to 10,000
experimental drugs contemplated, only one will typically gain FDA approval, and
this occurs only after up to 15 years of research at an average cost of more than $1

billion. Also, 30 percent of the U.S. workforce is either directly or indirectly
employed in the pharmaceutical industry, so protection of these intellectual
property rights is very important for the U.S. economy. Source: Doug Schoen,
“Intellectual Property Rights Matter,” Forbes, September 24, 2013.
If these developing countries continue to ignore the international agreements which
protect intellectual property rights, all of the following would most likely occur except
A) pharmaceutical companies would decrease investment in the development of more
experimental drugs.
B) pharmaceutical companies would consider expanding operations to these developing
countries.
C) fewer patents would be issued to pharmaceutical companies.
D) fewer dollars would be spent on the development of new medicines.
The quantity equation states that
A) the money supply (M) divided by the velocity of money (V) equals the price level
(P) divided by real output (Y), i.e., M/V = P/Y.
B) M V = P Y.
C) M + V = P + Y.
D) M – V = P – Y.
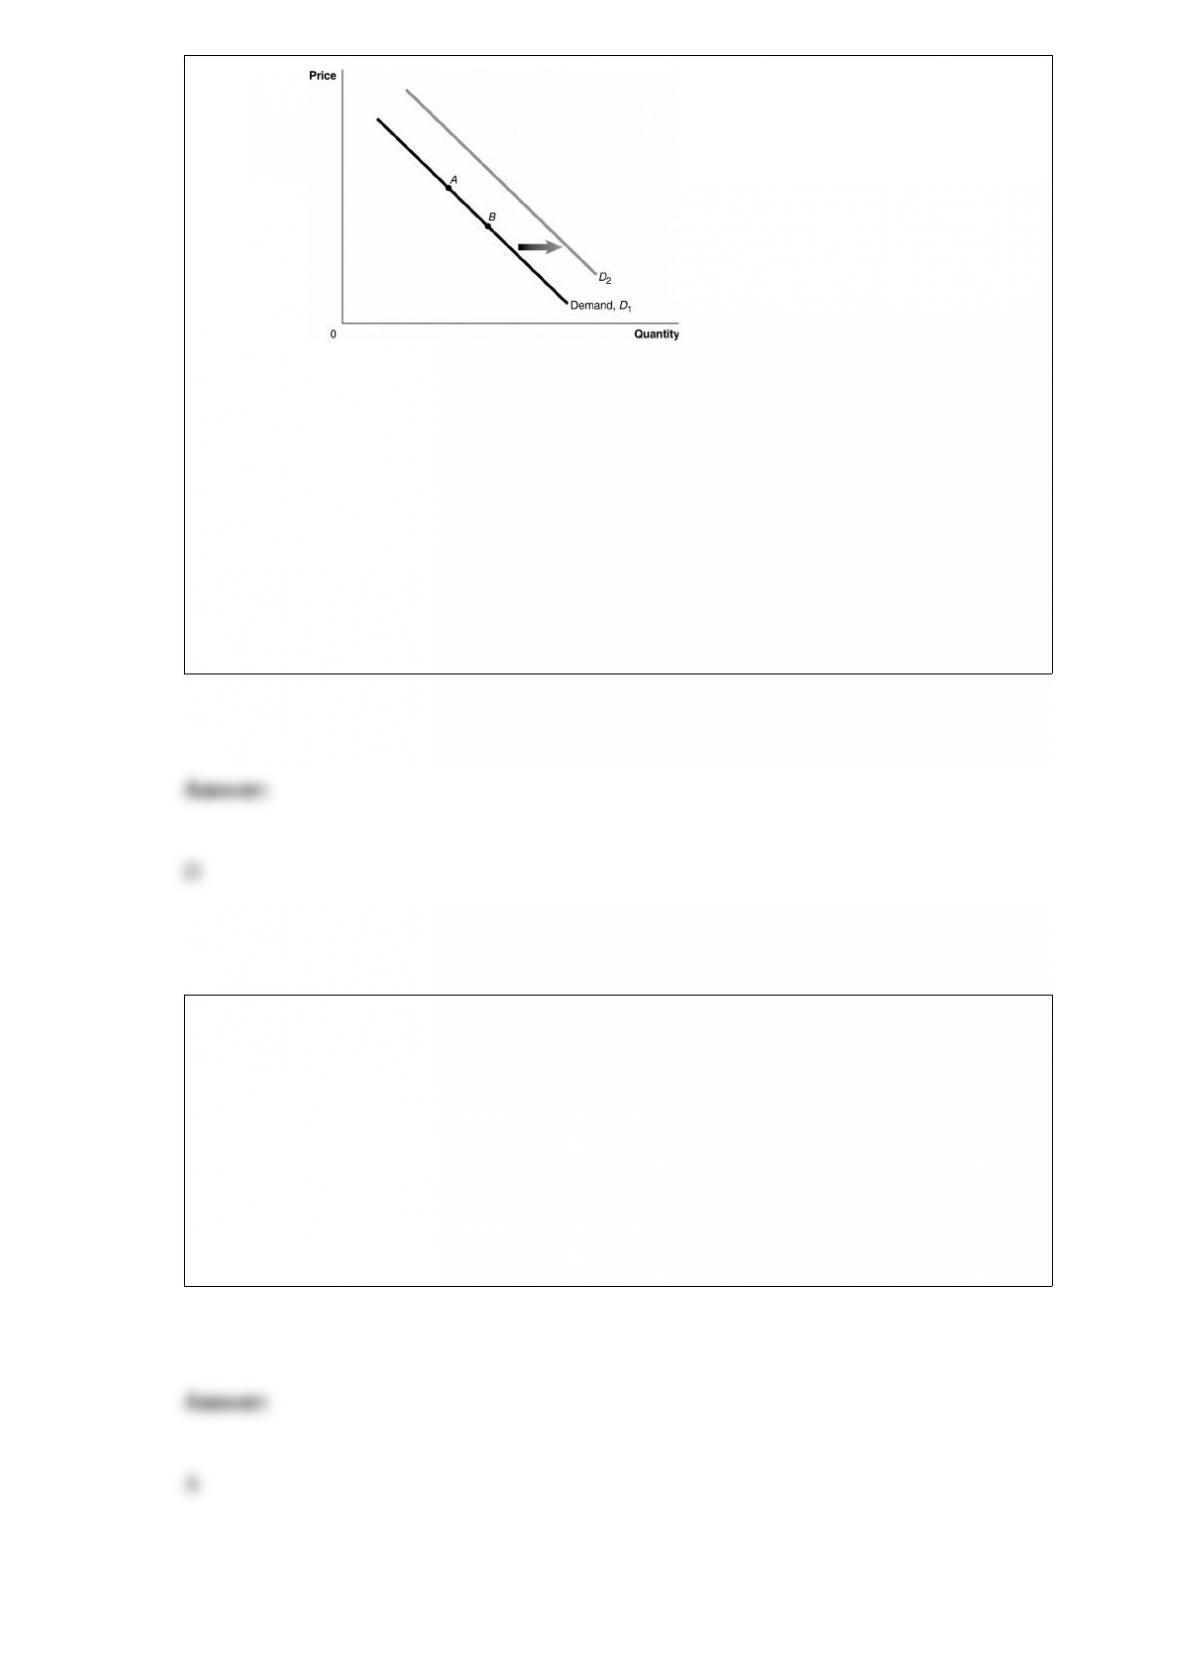
Figure 3-1
A decrease population would be represented by a movement from
A) A to B.
B) B to A.
C) D1 to D2.
D) D2 to D1.
An increase in the value of the U.S. dollar will
A) reduce Canadian demand for winter homes in Florida.
B) increase Canadian demand for winter homes in Florida.
C) reduce the cost of homes in Florida for Canadian buyers.
D) increase the cost of homes in Florida for American buyers.

Table 11-4
The table above shows the following relationship between hours spent fishing and the
quantity of fish caught for Juan, a commercial fisherman.
a. Complete the Marginal Product column in Table 11-4.
b. Characterize the production function, i.e. does the production function display
increasing marginal returns, diminishing marginal returns, etc.
c. Using the data above, graph Juan’s marginal product curve. Be sure to label the
horizontal and vertical axes. Is your graph consistent with your answer to part (b)?
Explain.
d. Juan uses the following inputs for fishing € a small wooden boat (B), a fishing pole
(P) and of course, his labor (L). Treating the boat and the fishing pole as fixed inputs
and using the data above, graph Juan’s Total Product of Labor curve. Be sure to label
the horizontal and vertical axes.
e. (Extra Credit) The opportunity cost of Juan’s time is $8 per hour. If Juan receives $2
per pound for his fish, what is the optimal number of hours he should spend fishing?
Explain how you arrived at your answer. Hint: Recall marginal benefit and marginal
cost analysis.
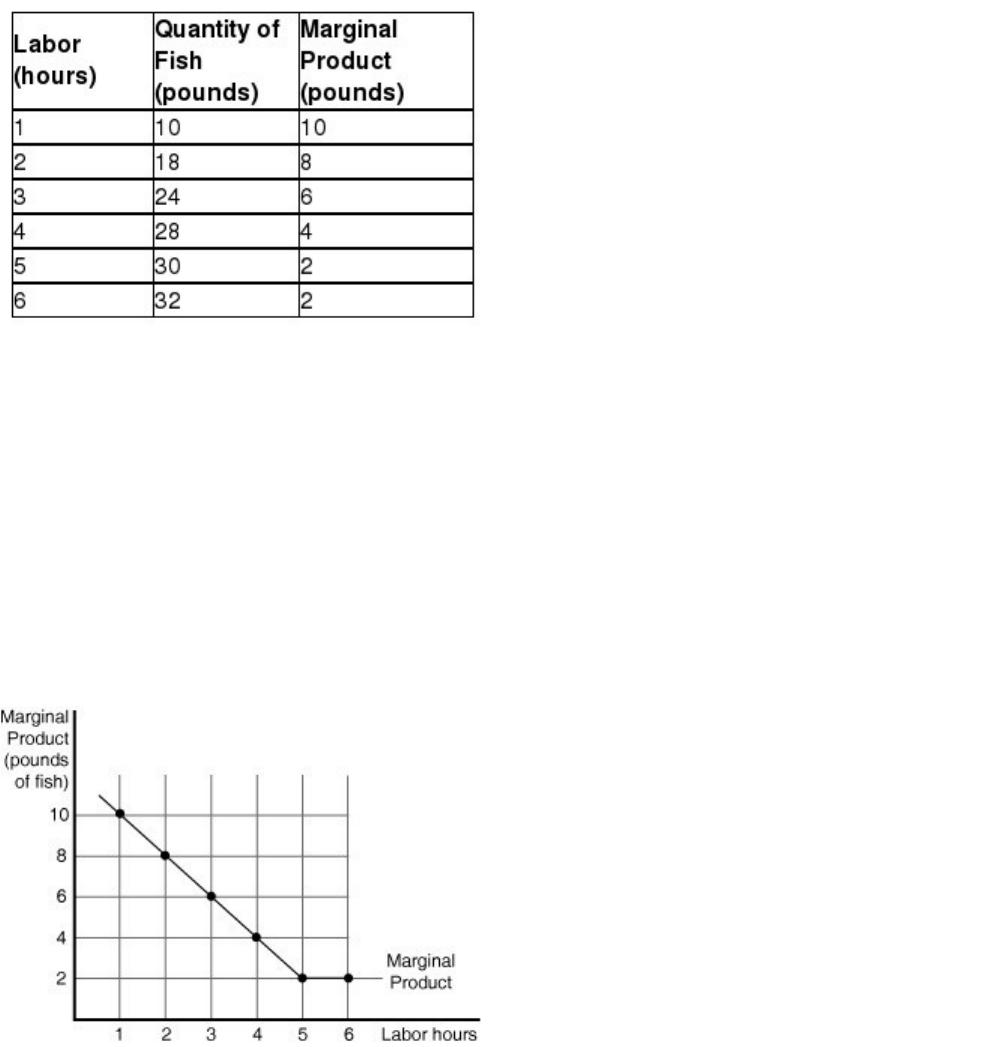
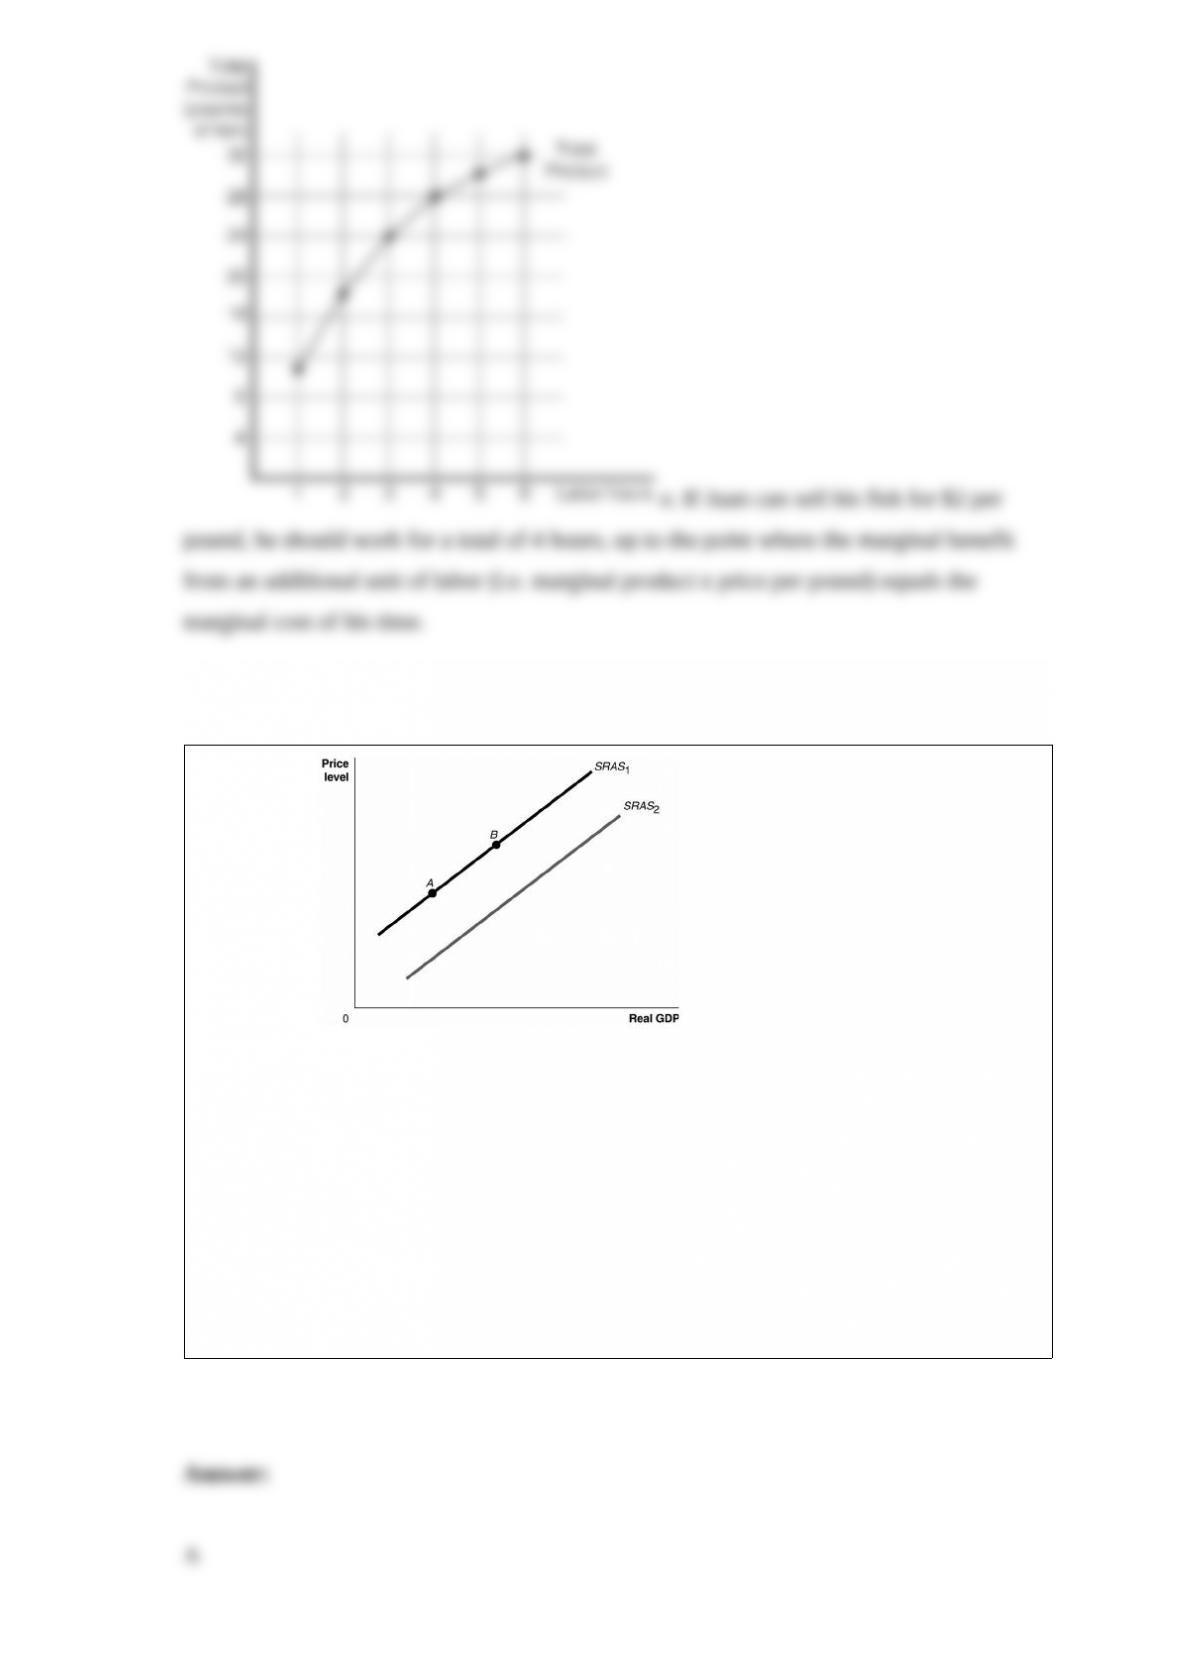
Figure 24-2
Ceteris paribus, a decrease in the expected future price level would be represented by a
movement from
A) SRAS1 to SRAS2.
B) SRAS2 to SRAS1.
C) point A to point B.
D) point B to point A.

Limits on the flow of foreign exchange and financial investment across countries are
called
A) capital controls.
B) fixed exchange rates.
C) credit constraints.
D) currency restrictions.
A local electricity-generating company has a monopoly that is protected by an entry
barrier that takes the form of
A) control of a key raw material.
B) network externalities.
C) economies of scale.
D) perfectly inelastic demand curve.
Some markets have many buyers and sellers but fall into the category of monopolistic
competition rather than perfect competition. The most common reason for this is
A) there are high barriers to entering these markets.
B) firms in these markets sell identical products.
C) firms in these markets make high profits.
D) firms in these markets do not sell identical products.
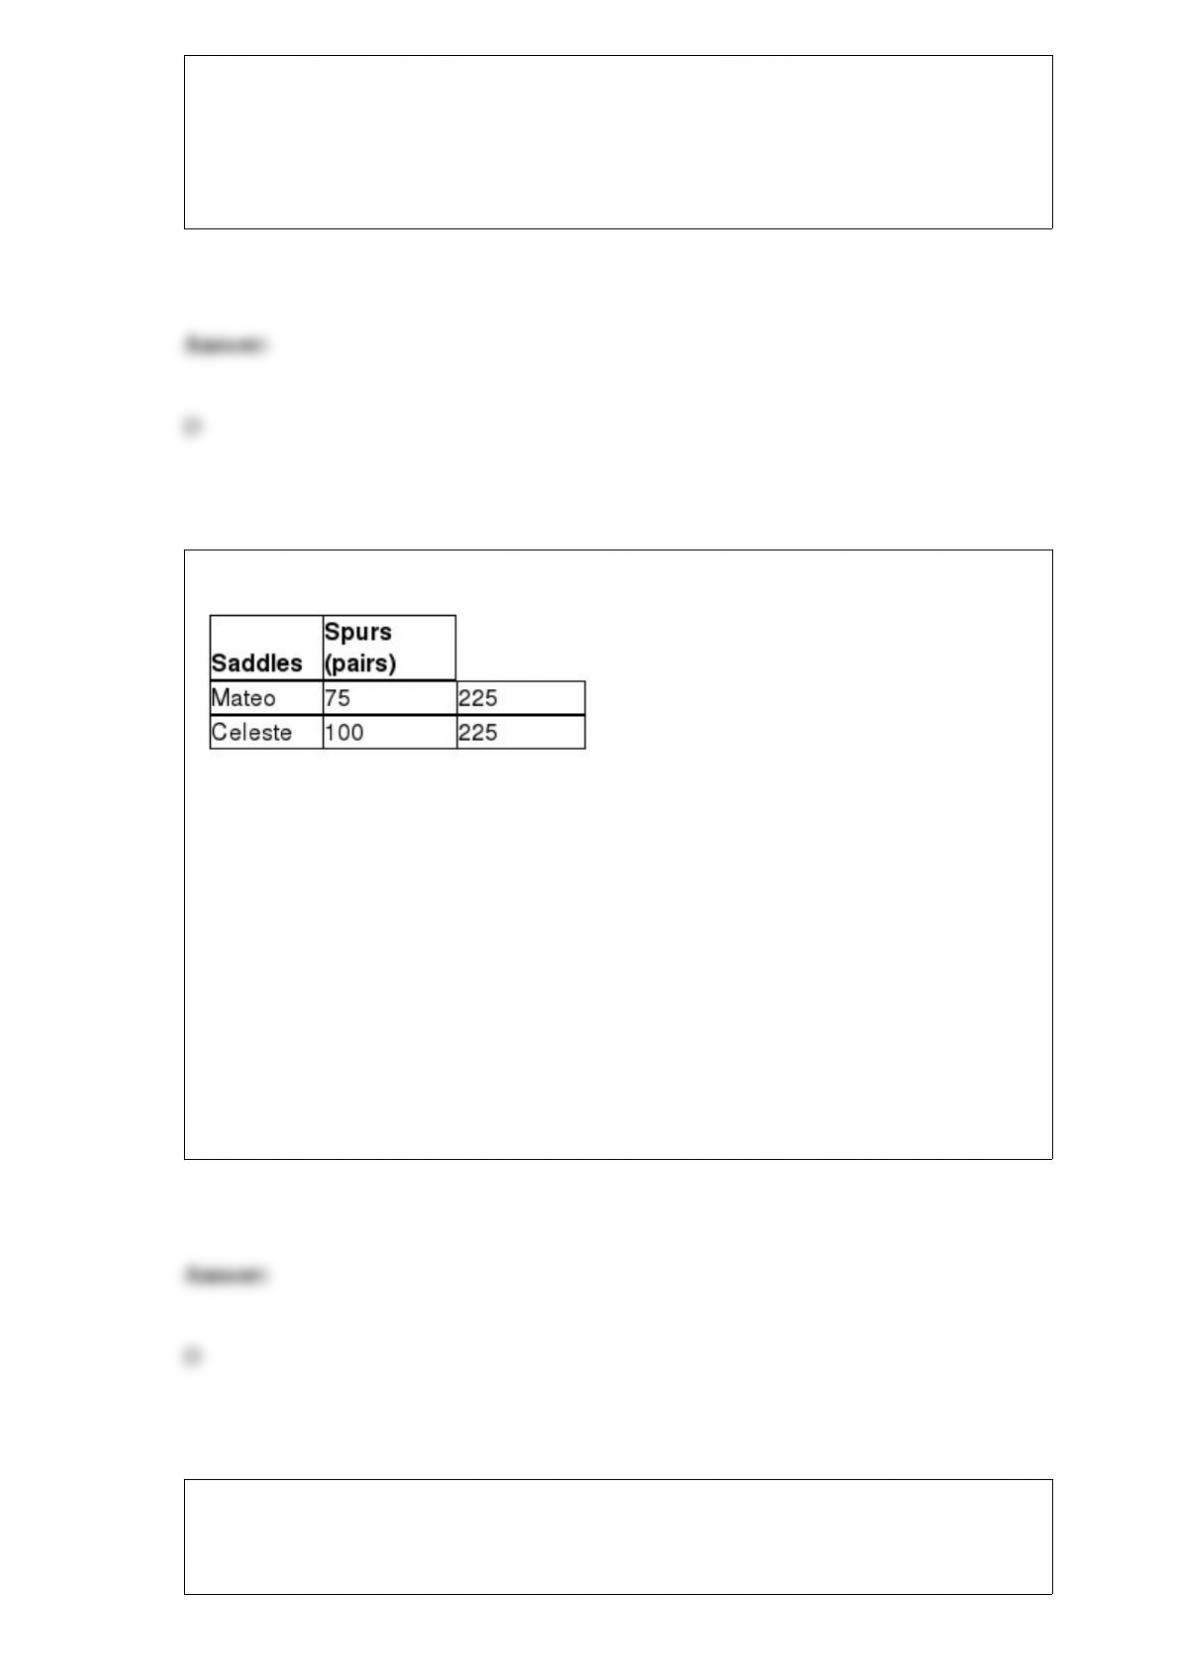
Table 9-6
Mateo and Celeste produce custom saddles and spurs. Table 9-6 lists the number of
saddles and pairs of spurs Mateo and Celeste can each produce in one month. Select the
statement that accurately interprets the data in the table.
A) Mateo has an absolute advantage in making saddles and Celeste has an absolute
advantage in making spurs.
B) Mateo has an absolute advantage in making spurs and Celeste has an absolute
advantage in making saddles.
C) Mateo has an absolute advantage in making spurs.
D) Celeste has an absolute advantage in making saddles.
A decrease in individual income taxes ________ disposable income, which ________
consumption spending.

A) increases; increases
B) increases; decreases
C) decreases; increases
D) decreases; decreases
Dividends are
A) financial securities which represent ownership in a corporation.
B) the yearly payments associated with bonds.
C) the interest rate paid on shares of stock.
D) payments by a corporation to its shareholders.
Which of the following is considered contractionary fiscal policy?
A) Congress increases the income tax rate.
B) Congress increases defense spending.
C) Legislation removes a college tuition deduction from federal income taxes.
D) The New Jersey legislature cuts highway spending to balance its budget.