Dawn’s bridal boutique is having a sale on evening dresses. The increase in consumer
surplus comes from the benefit of the lower prices to
a. only existing customers who now get lower prices on the gowns they were already
planning to purchase.
b. only new customers who enter the market because of the lower prices.
c. both existing customers who now get lower prices on the gowns they were already
planning to purchase and new customers who enter the market because of the lower
prices.
d. Consumer surplus does not increase; it decreases.
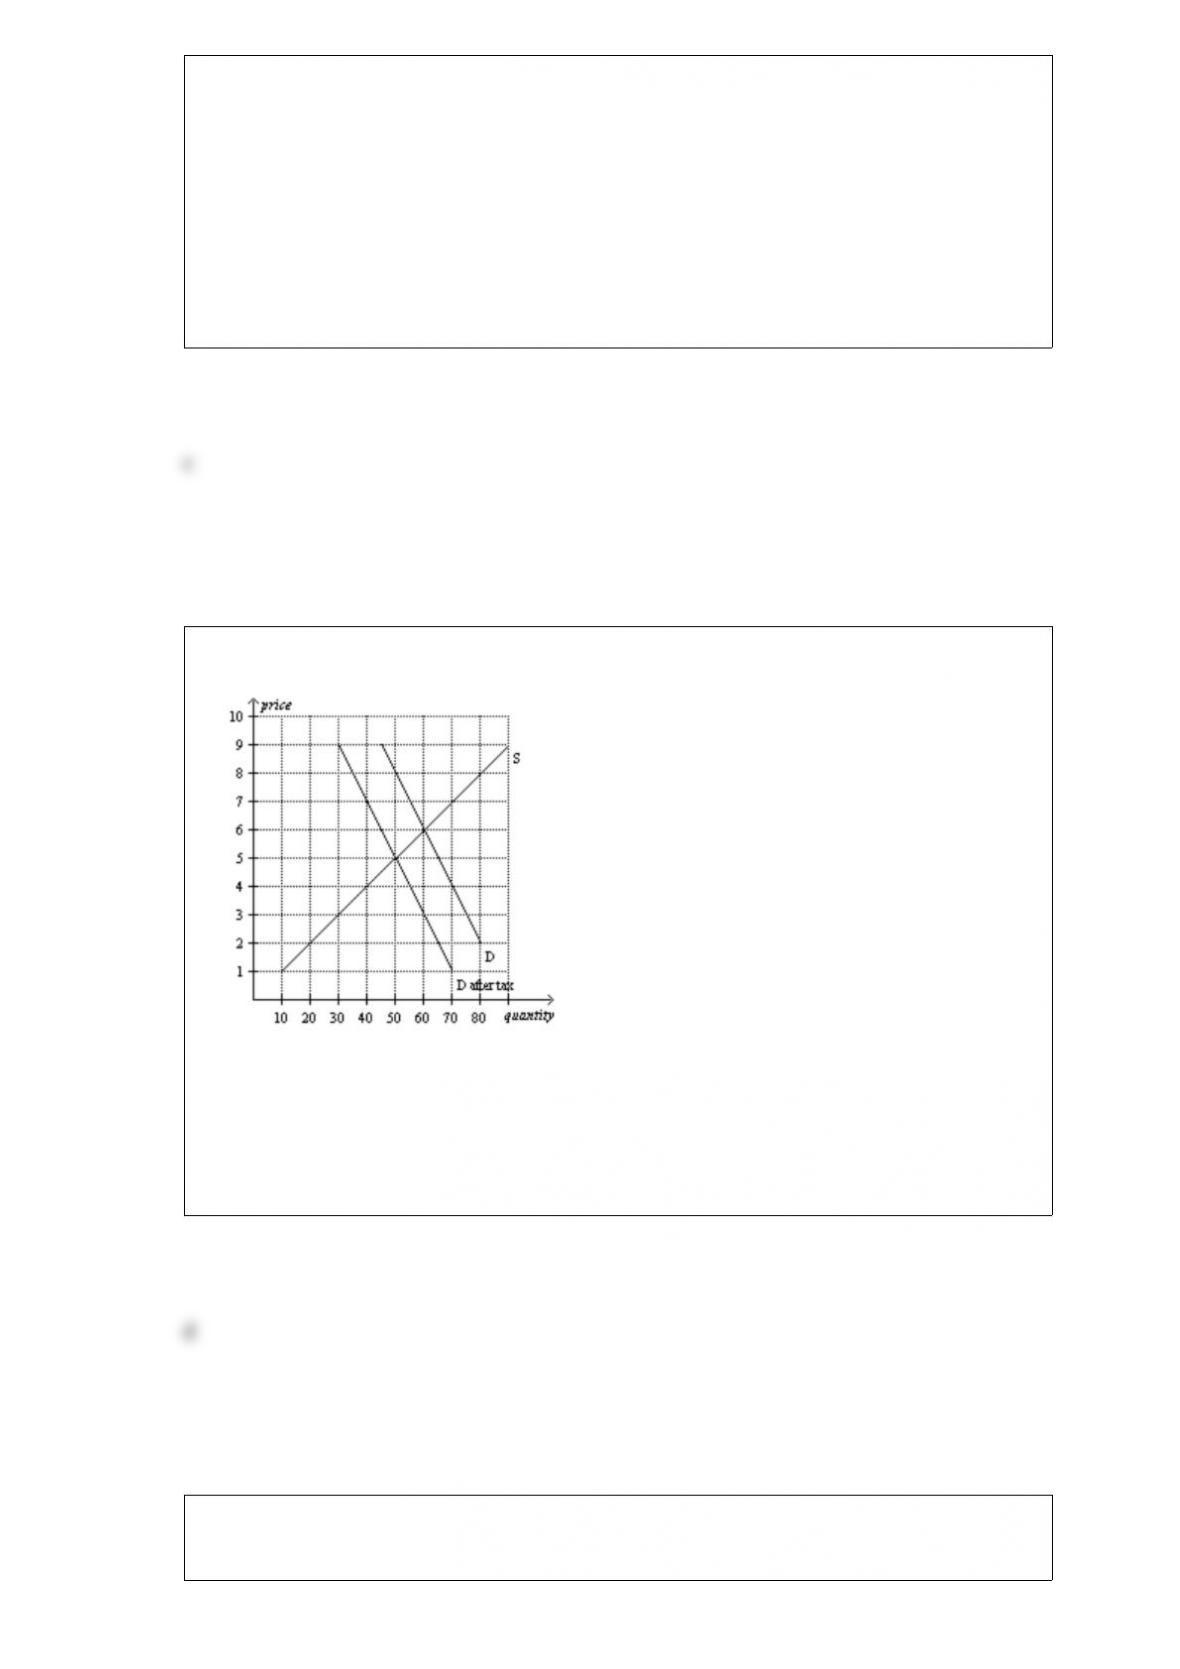
Figure 625
Refer to Figure 625. The price that buyers pay after the tax is imposed is
a. $5.
b. $6.
c. $7.
d. $8.
Figure 633
The diagram shows the effect of a tax as measured by the distance between J and K.
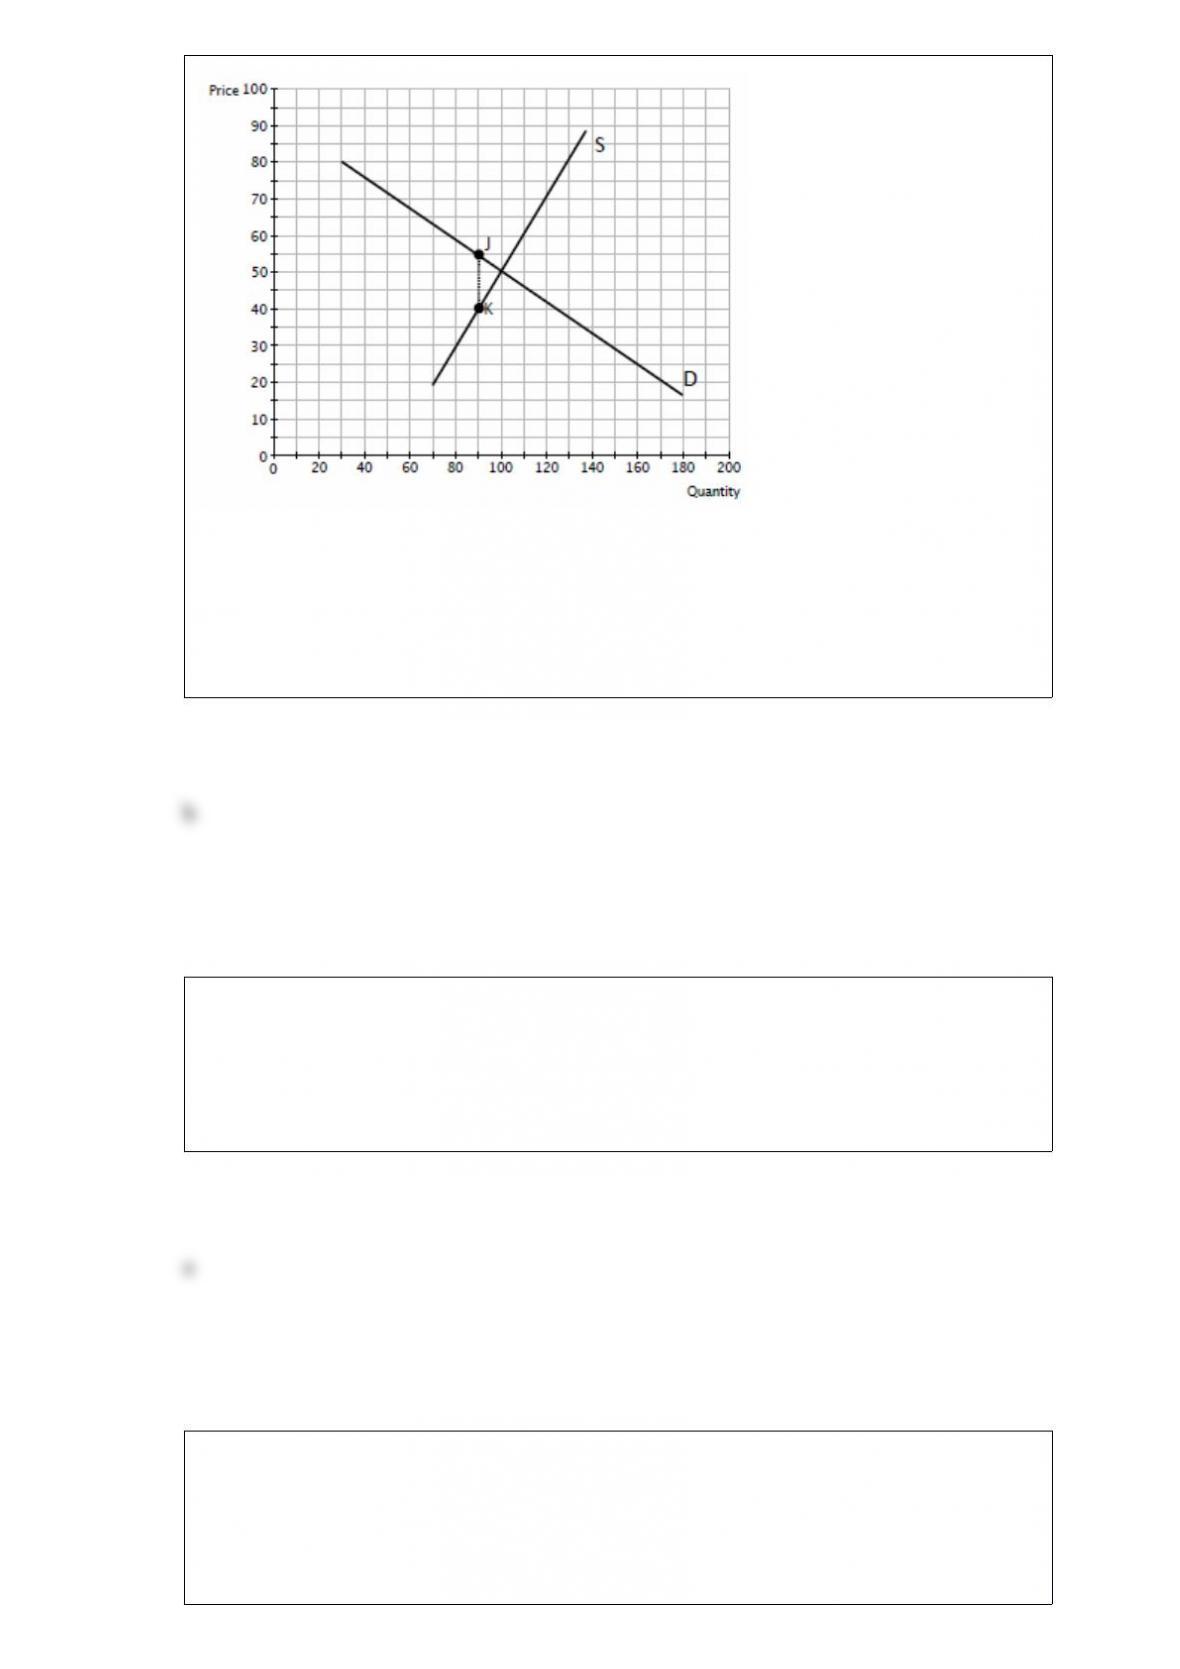
Refer to Figure 633. Based upon the diagram,
a. the incidence of the tax falls more heavily on buyers.
b. the incidence of the tax falls more heavily on sellers.
c. the incidence of the tax is shared equally by both buyers and sellers.
d. the incidence of the tax cannot be determined based upon the information in the
diagram.
John Maynard Keynes referred to economics as an easy subject,
a. at which very few excel.
b. but not as easy as philosophy or the pure sciences.
c. which very few can enjoy.
d. which deals primarily with common sense.
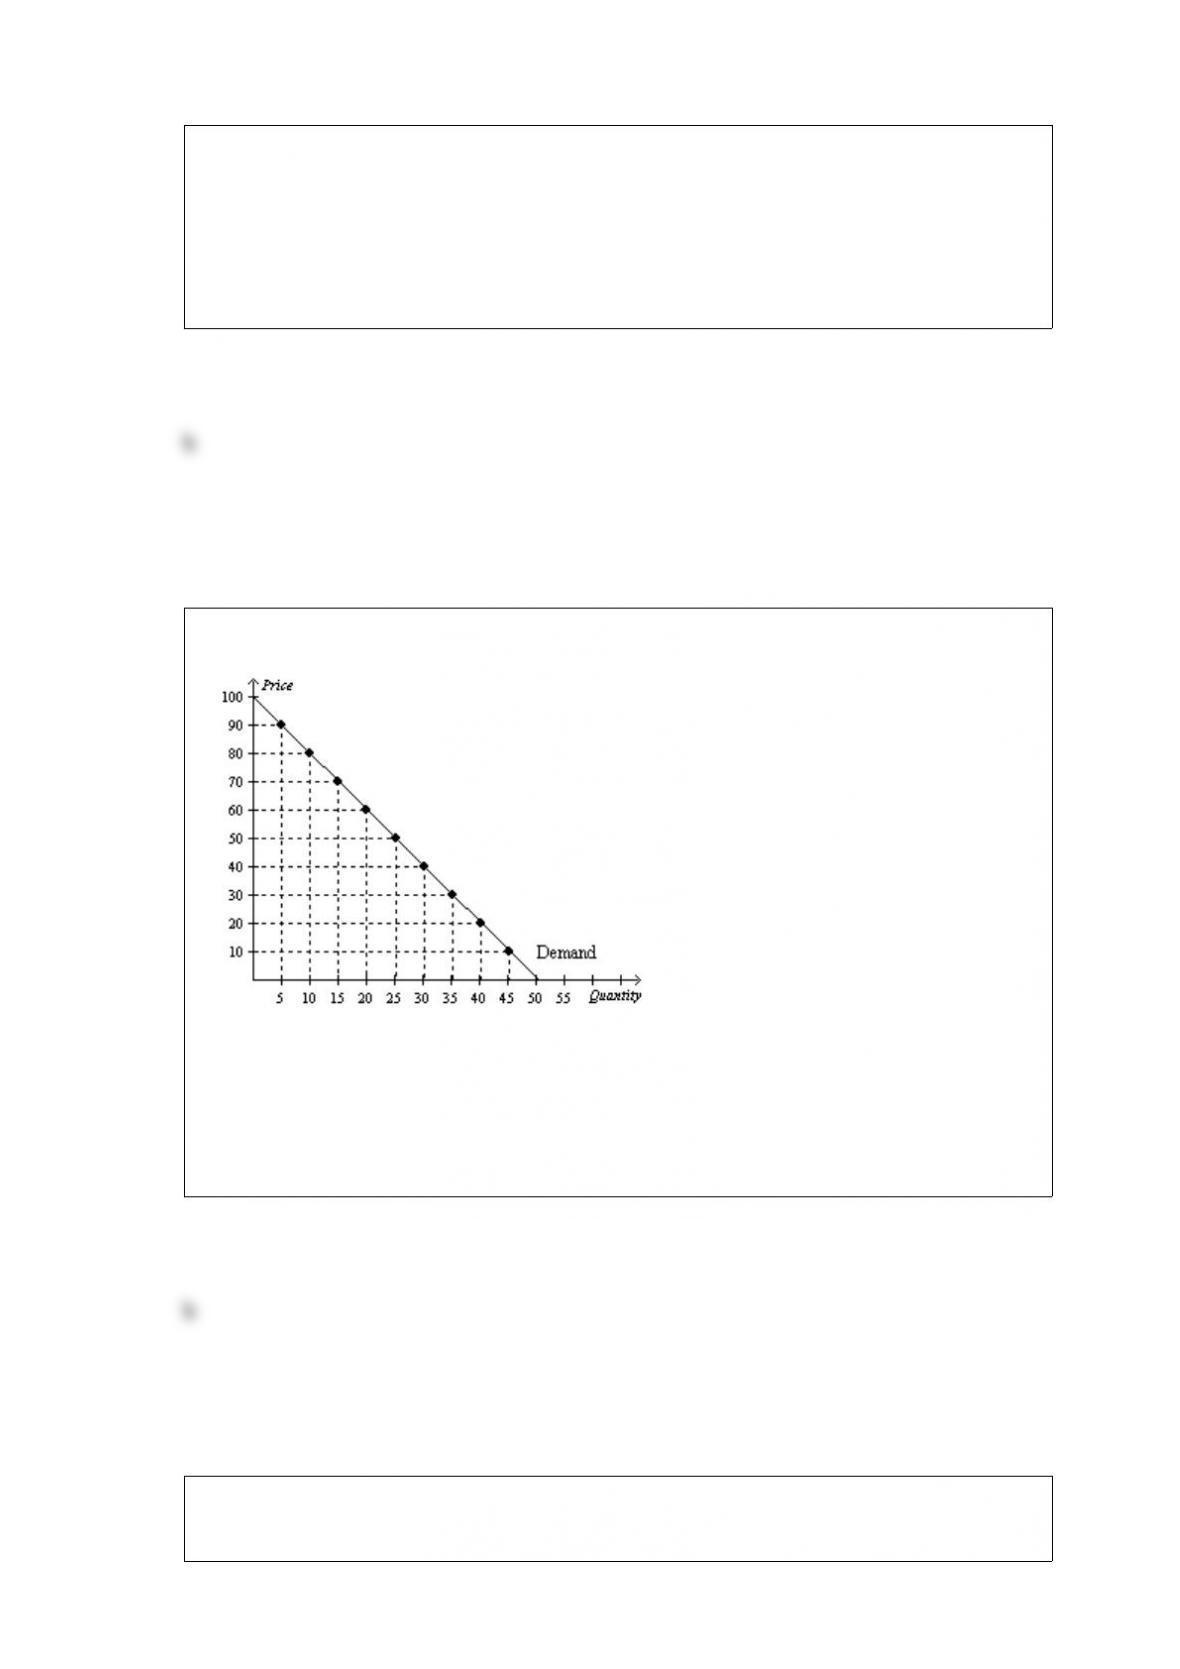
Table 43
PriceBert’s
Quantity
DemandedErnie’s
Quantity

DemandedGrover’s
Quantity
DemandedOscar’s
Quantity
Demanded
$0.00201648
$0.50181266
$1.00141025
$1.5012804
$2.006602
$2.500400
Refer to Table 43. If these are the only four buyers in the market, then the market
quantity demanded at a price of $1 is
a. 4 units.
b. 7.75 units.
c. 14 units.
d. 31 units.
Refer to Figure 212. Which of the following would most likely have caused the
production possibilities frontier to shift outward from A to B?
a. a decrease in unemployment
b. a technological advance in the consumer goods industries
c. a general technological advance
d. an increase in the availability of capitalproducing resources
Which of the following causes a surplus of a good?
a. a binding price floor
b. a binding price ceiling
c. a tax on the good
d. More than one of the above is correct.
When the supply of a good decreases and the demand for the good remains unchanged,
consumer surplus
a. decreases.
b. is unchanged.
c. increases.
d. may increase, decrease, or remain unchanged.
Figure 418
Refer to Figure 418. At what price would there be an excess demand of 200 units of
the good?
a. $15
b. $20
c. $30
d. $35
If the government levies a $5 tax per ticket on buyers of NFL game tickets, then the
price paid by buyers of NFL game tickets would
a. increase by less than $5.
b. increase by exactly $5.
c. increase by more than $5.
d. decrease by an indeterminate amount.
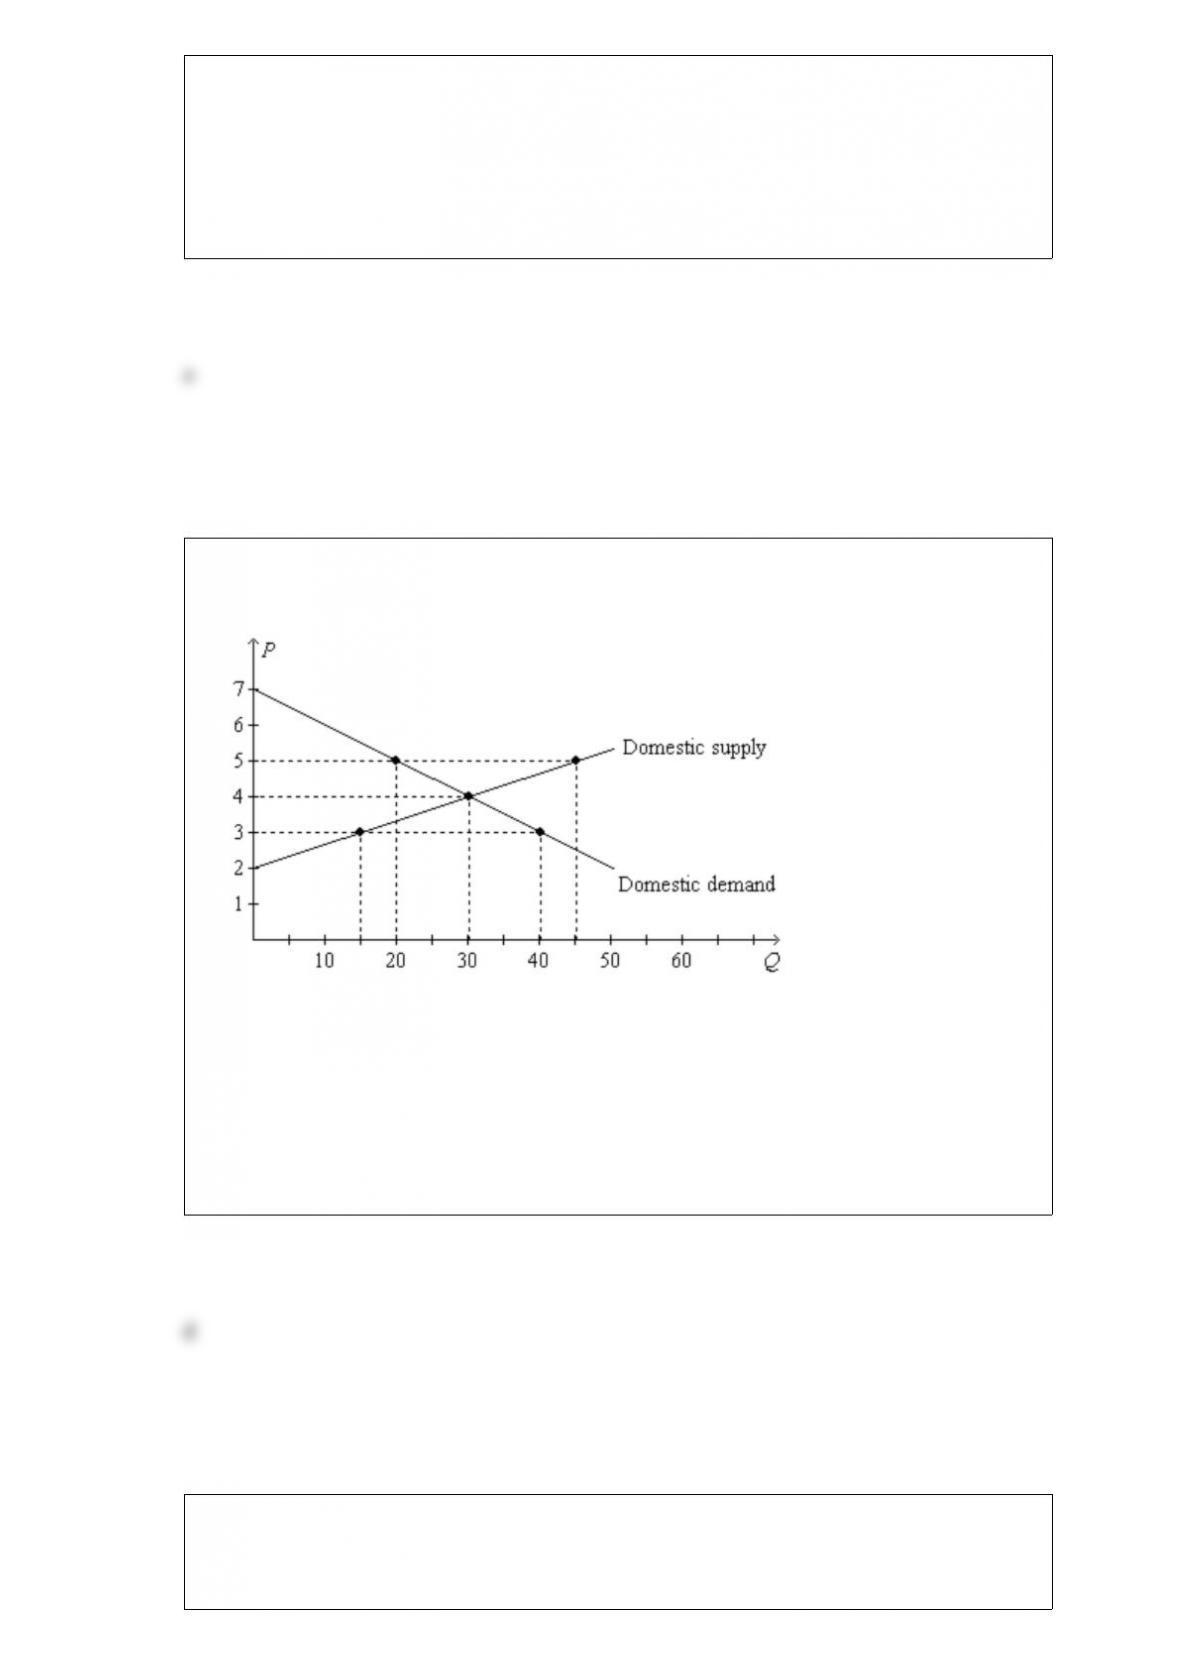
Figure 918. On the diagram below, Q represents the quantity of peaches and P
represents the price of peaches. The domestic country is Isoland.
Refer to Figure 918. Suppose Isoland changes from a notrade policy to a policy that
allows international trade. If the world price of peaches is $3, then the policy change
results in a
a. $15.00 decrease in producer surplus.
b. $45.00 increase in consumer surplus.
c. $20.00 increase in total surplus.
d. $12.50 increase in total surplus.
If the government allowed a free market for transplant organs such as kidneys to exist,
the
a. shortage of organs would be eliminated, and there would be no surplus of organs.
b. shortage of organs would be eliminated, but a surplus of organs would develop.
c. shortage of organs would persist.
d. overall wellbeing of society would remain unchanged.
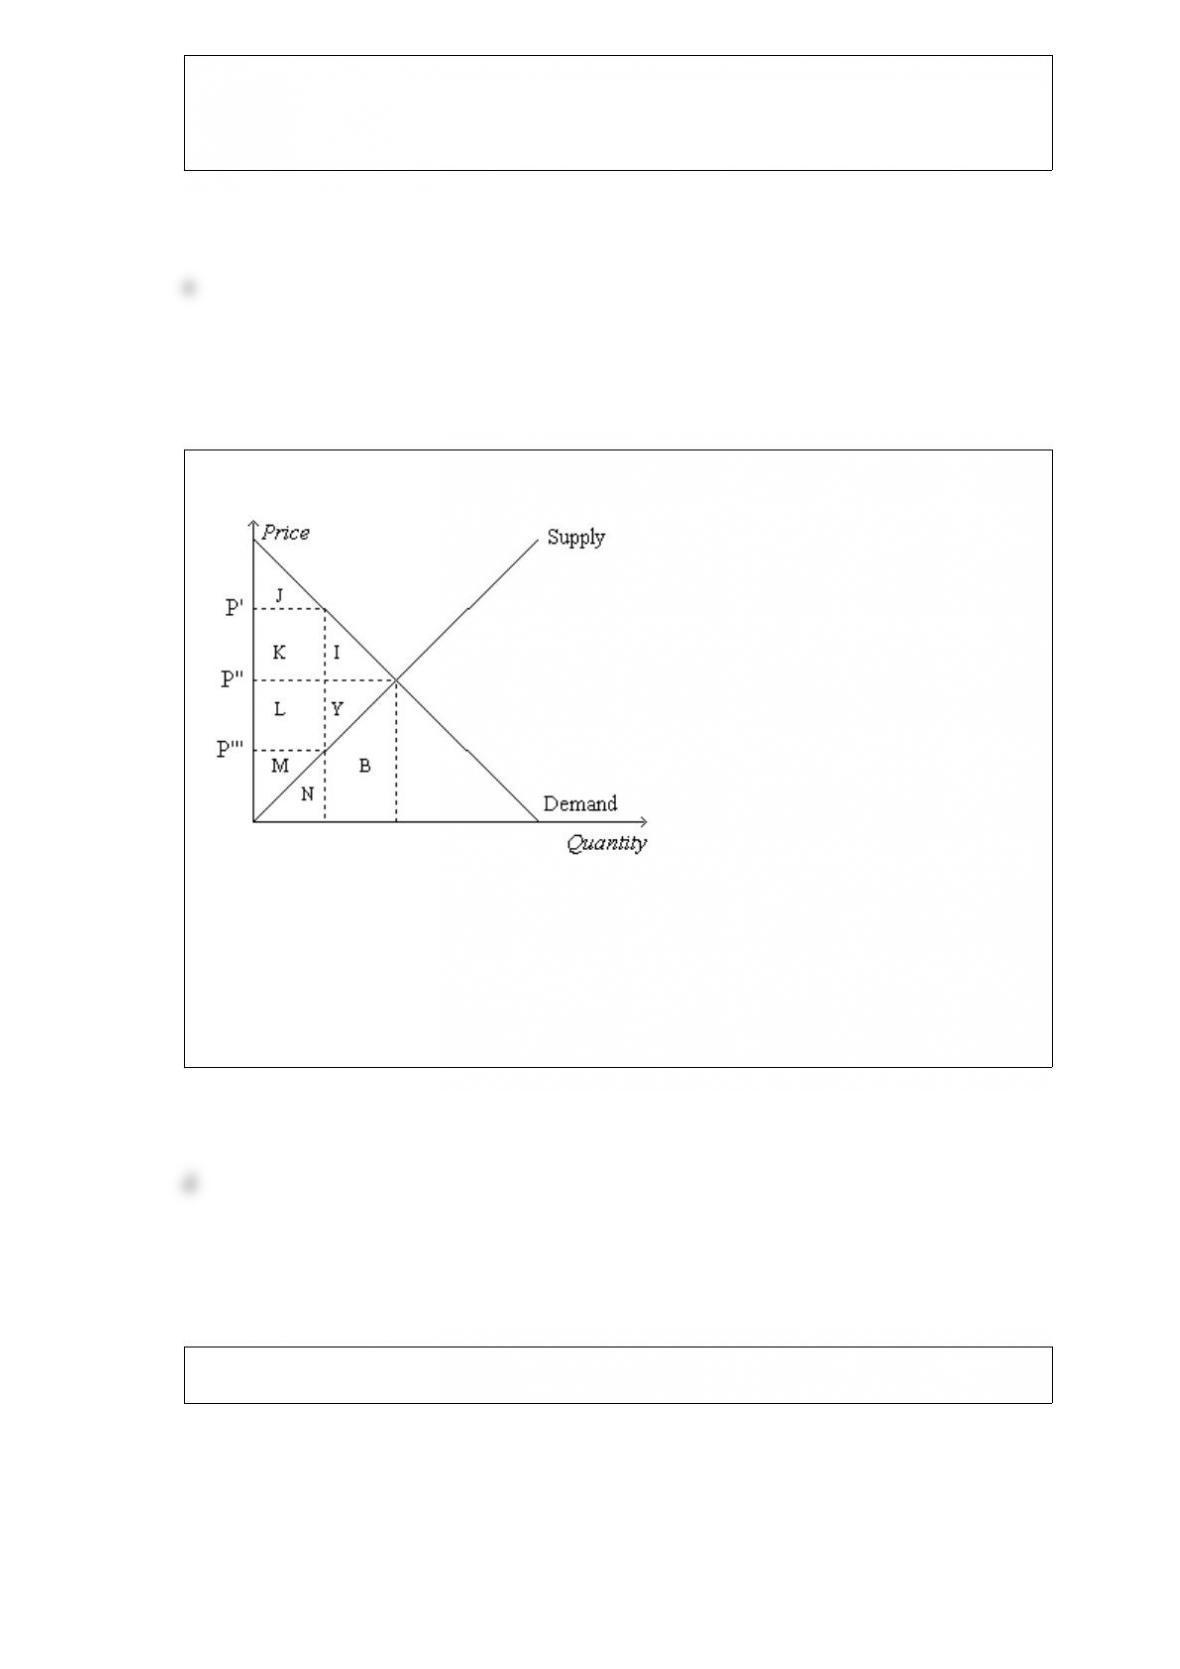
Figure 81
Refer to Figure 81. Suppose the government imposes a tax of P’ P”’. Total surplus
before the tax is measured by the area
a. I+Y.
b. J+K+L+M.
c. L+M+Y.
d. I+J+K+L+M+Y.
Figure 915
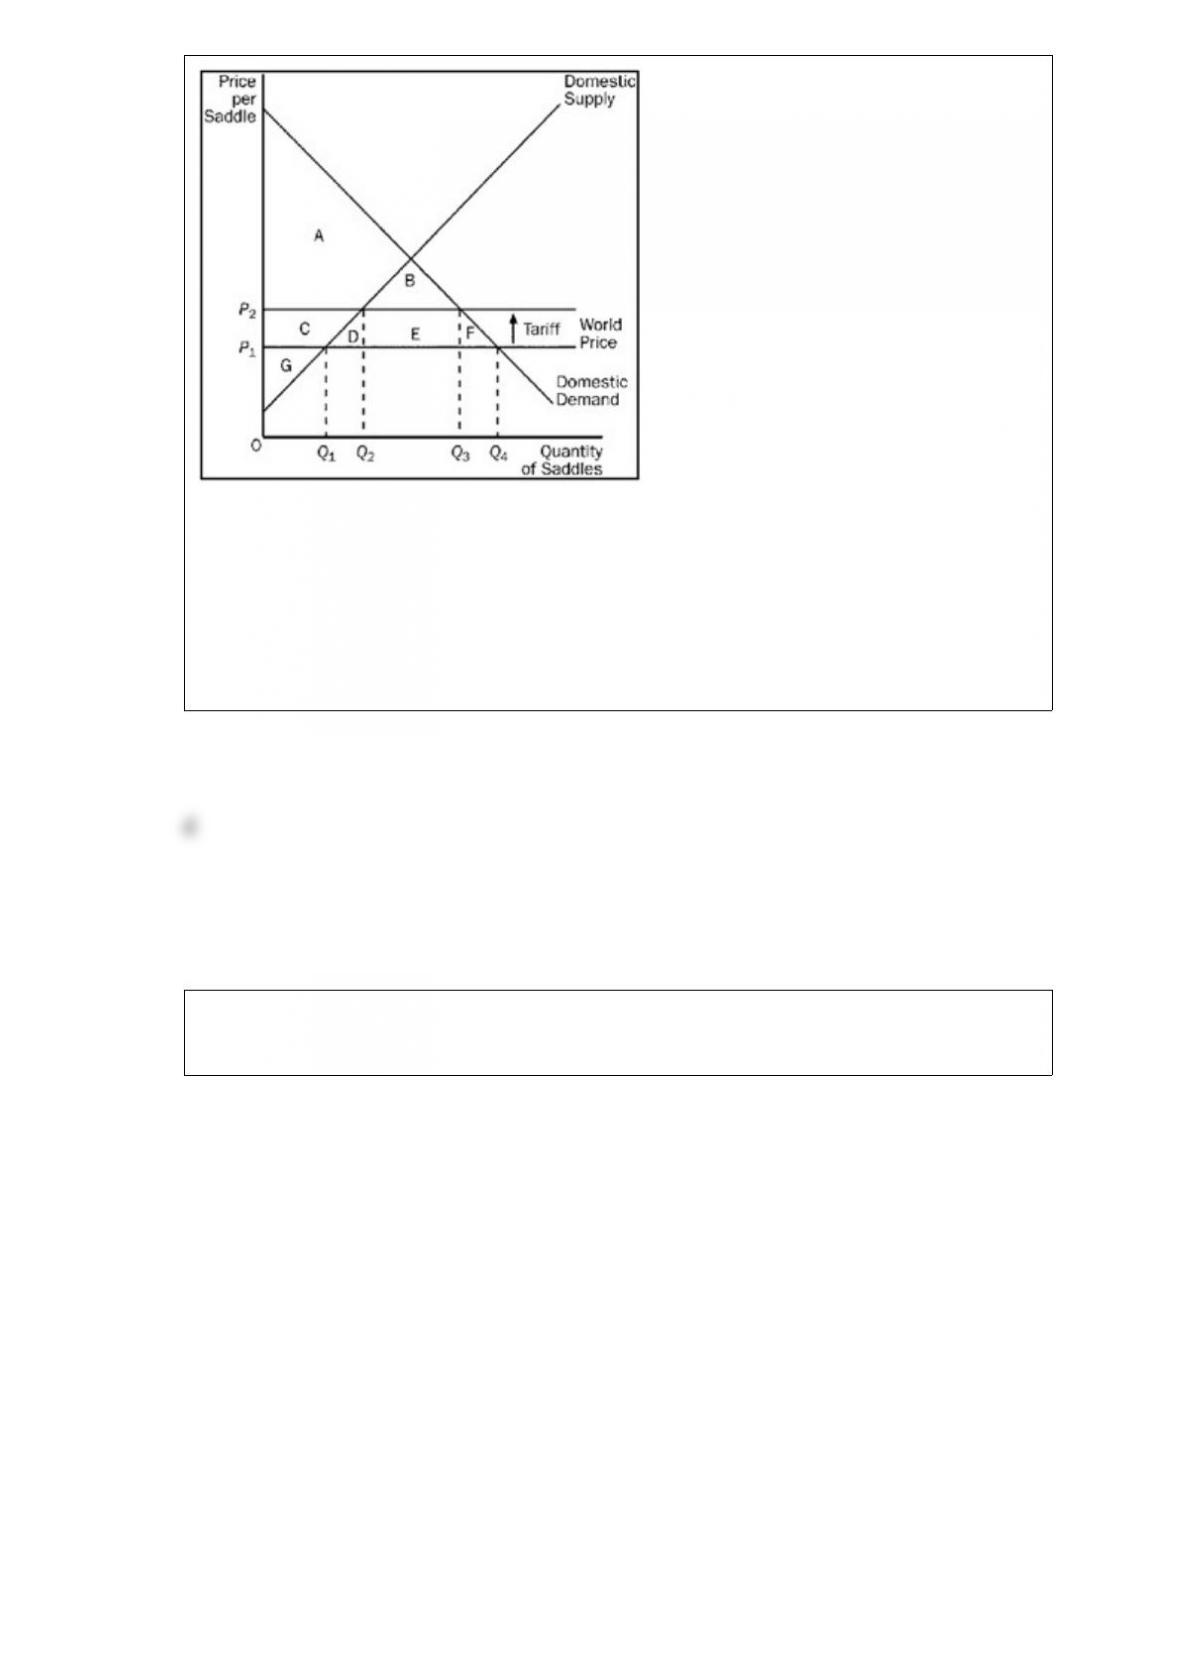
Refer to Figure 915. With the tariff, the price paid and quantity demanded by domestic
buyers are
a. P1 and Q1.
b. P1 and Q4.
c. P2 and Q2.
d. P2 and Q3.
Figure 96
The figure illustrates the market for roses in a country.
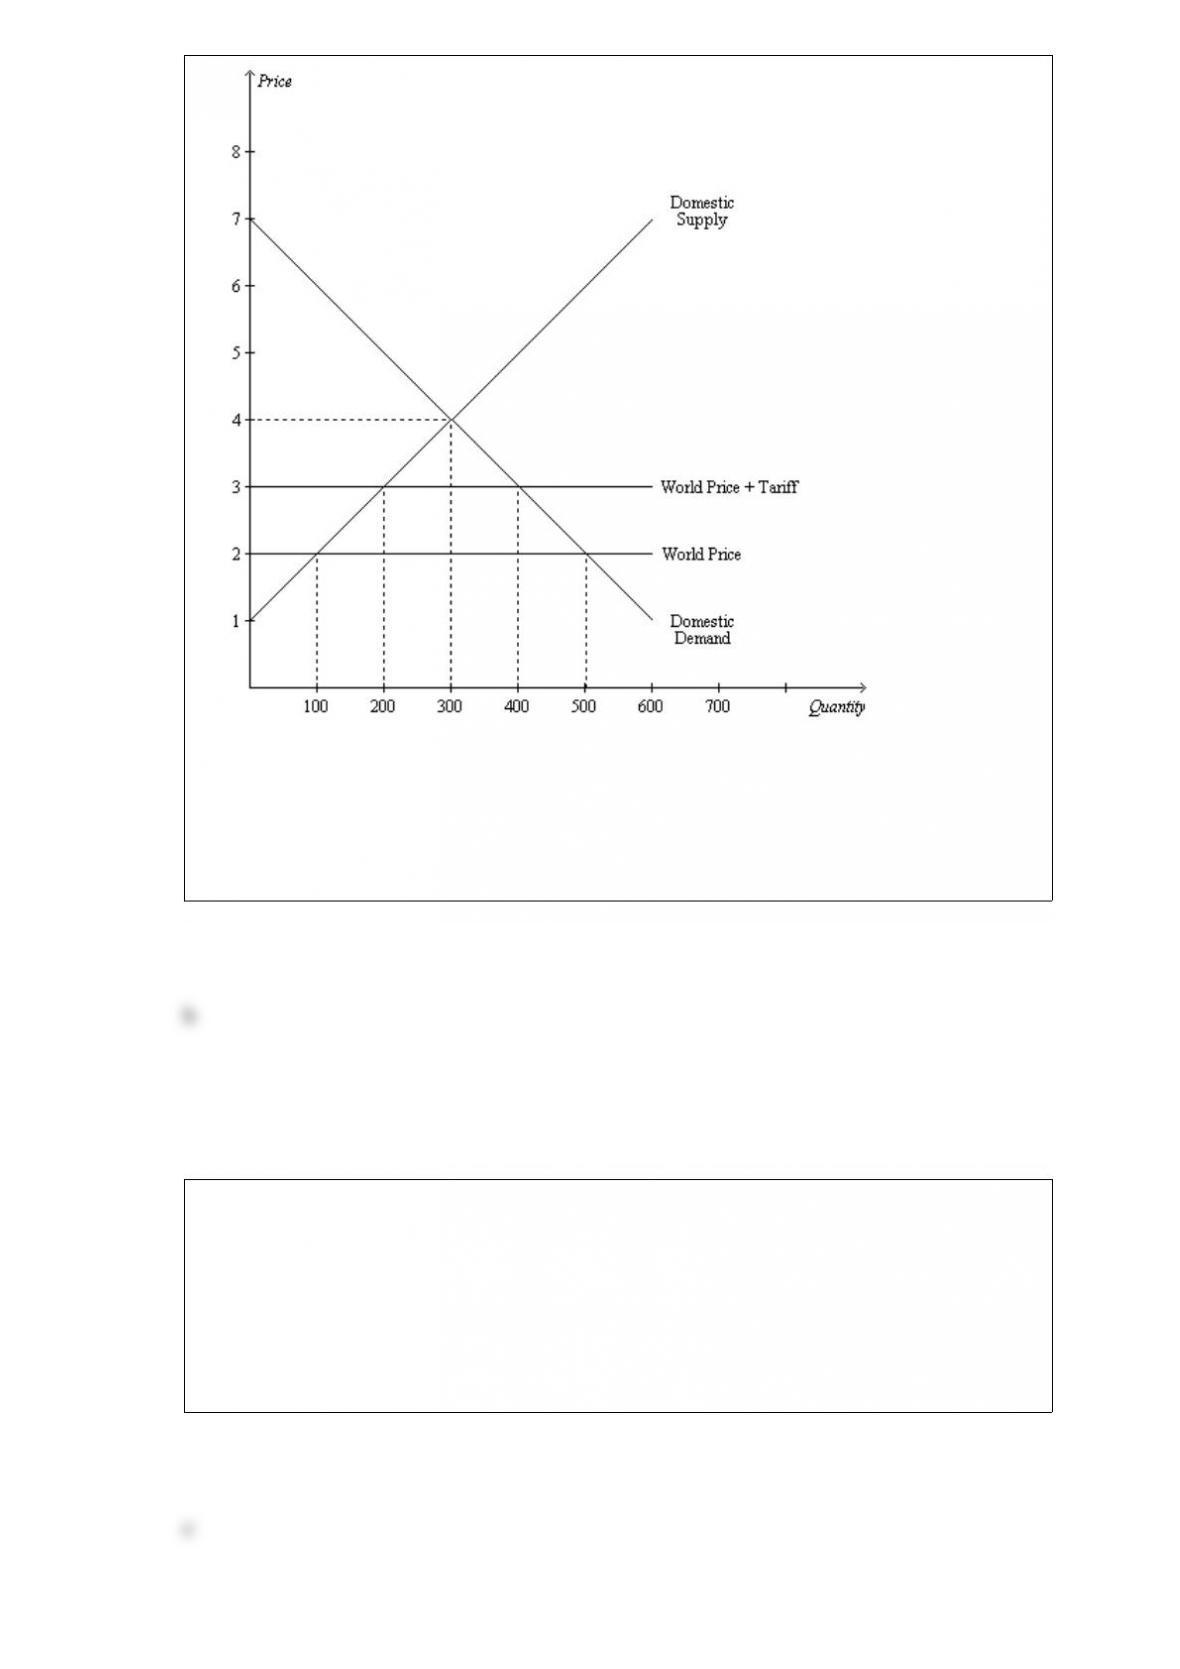
Refer to Figure 96. When a tariff is imposed in the market, domestic producers
a. gain $100 of producer surplus.
b. gain $150 of producer surplus.
c. gain $200 of producer surplus.
d. gain $300 of producer surplus.
The failure of communism in a large number of countries is at least partly explained by
a. the fact that those countries relied absolutely on the invisible hand.
b. the fact that those countries did little or nothing to restrict trade with other countries.
c. the lack of information, on the part of central planners in those countries, about tastes
and preferences in their economies.
d. the lack of information, on the part of central planners in those countries, about how
much authority the government had in affecting economic outcomes.
Suppose the tax on gasoline is decreased from $0.60 per gallon to $0.40 per gallon. As a
result,
a. tax revenue necessarily decreases.
b. the deadweight loss of the tax necessarily decreases.
c. the demand curve for gasoline necessarily becomes steeper.
d. the supply curve for gasoline necessarily becomes flatter.
Figure 55
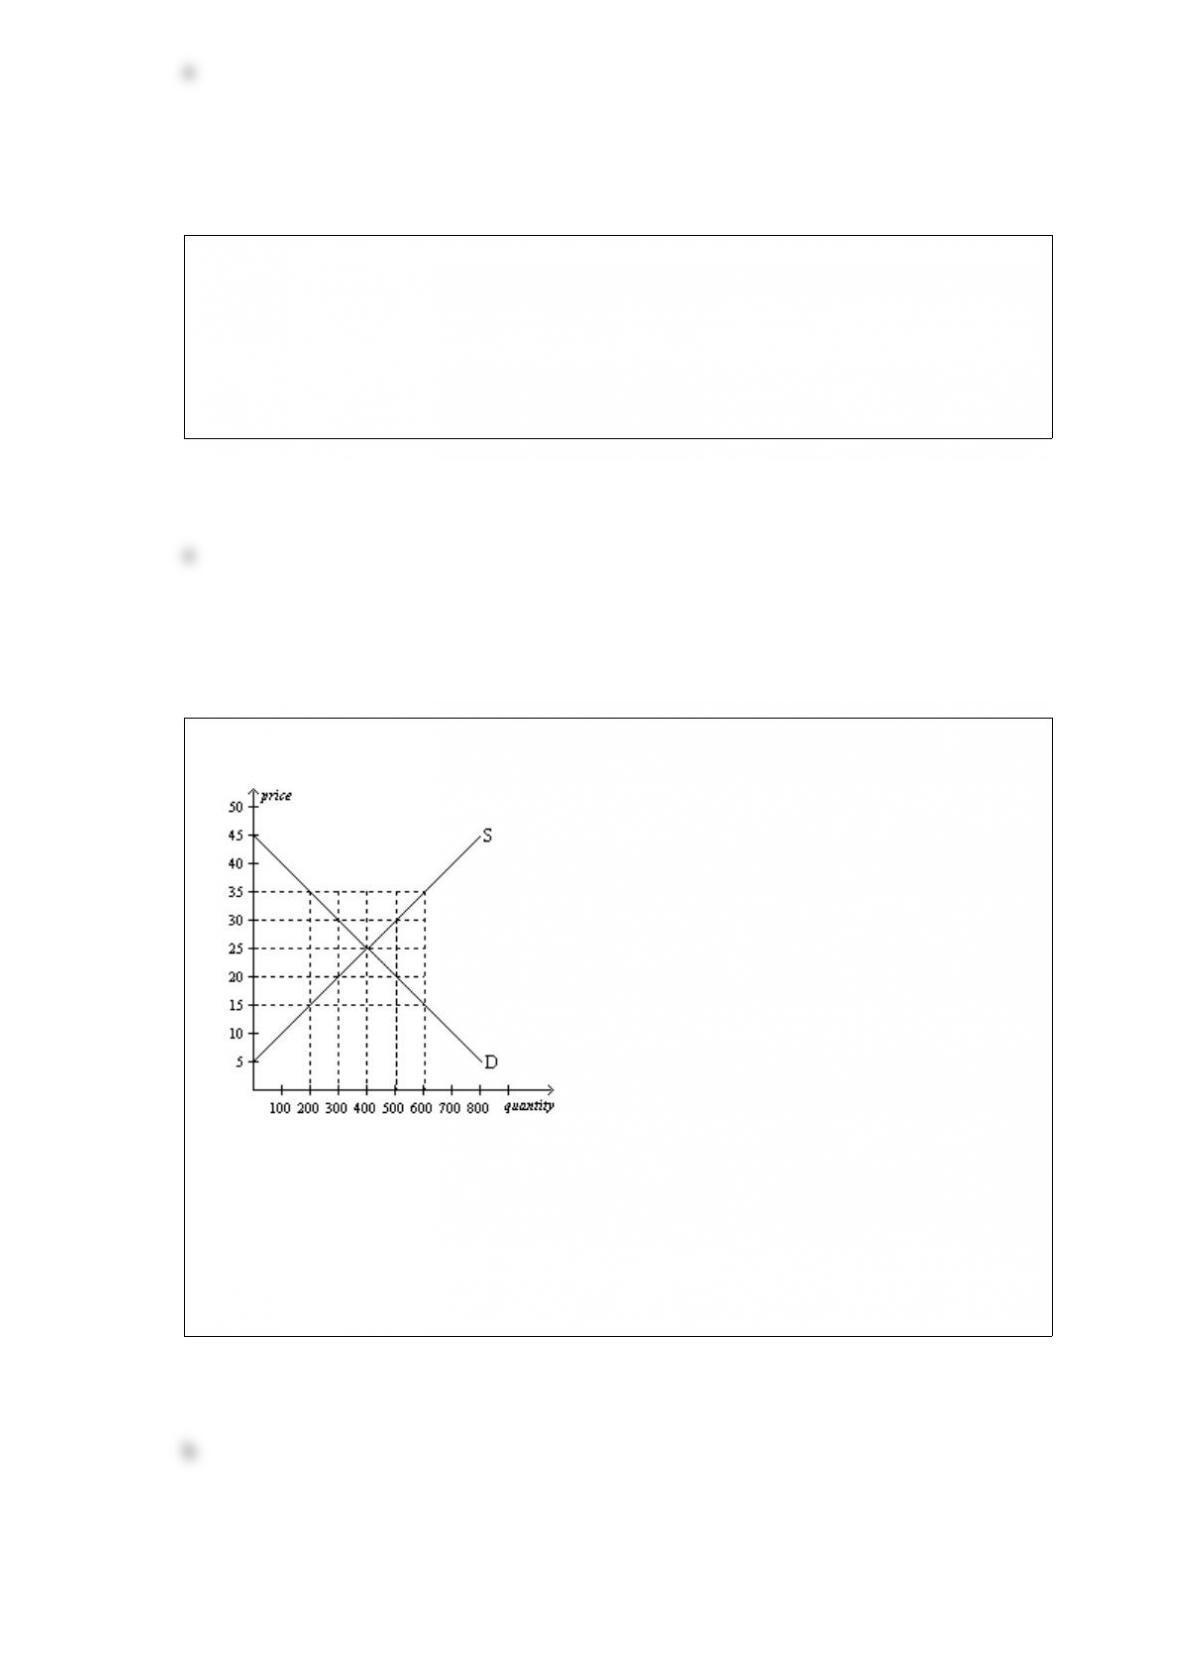
Refer to Figure 55. At a price of $10 per unit, sellers’ total revenue equals
a. $100.
b. $450.
c. $500.
d. $1250.
Figure 22
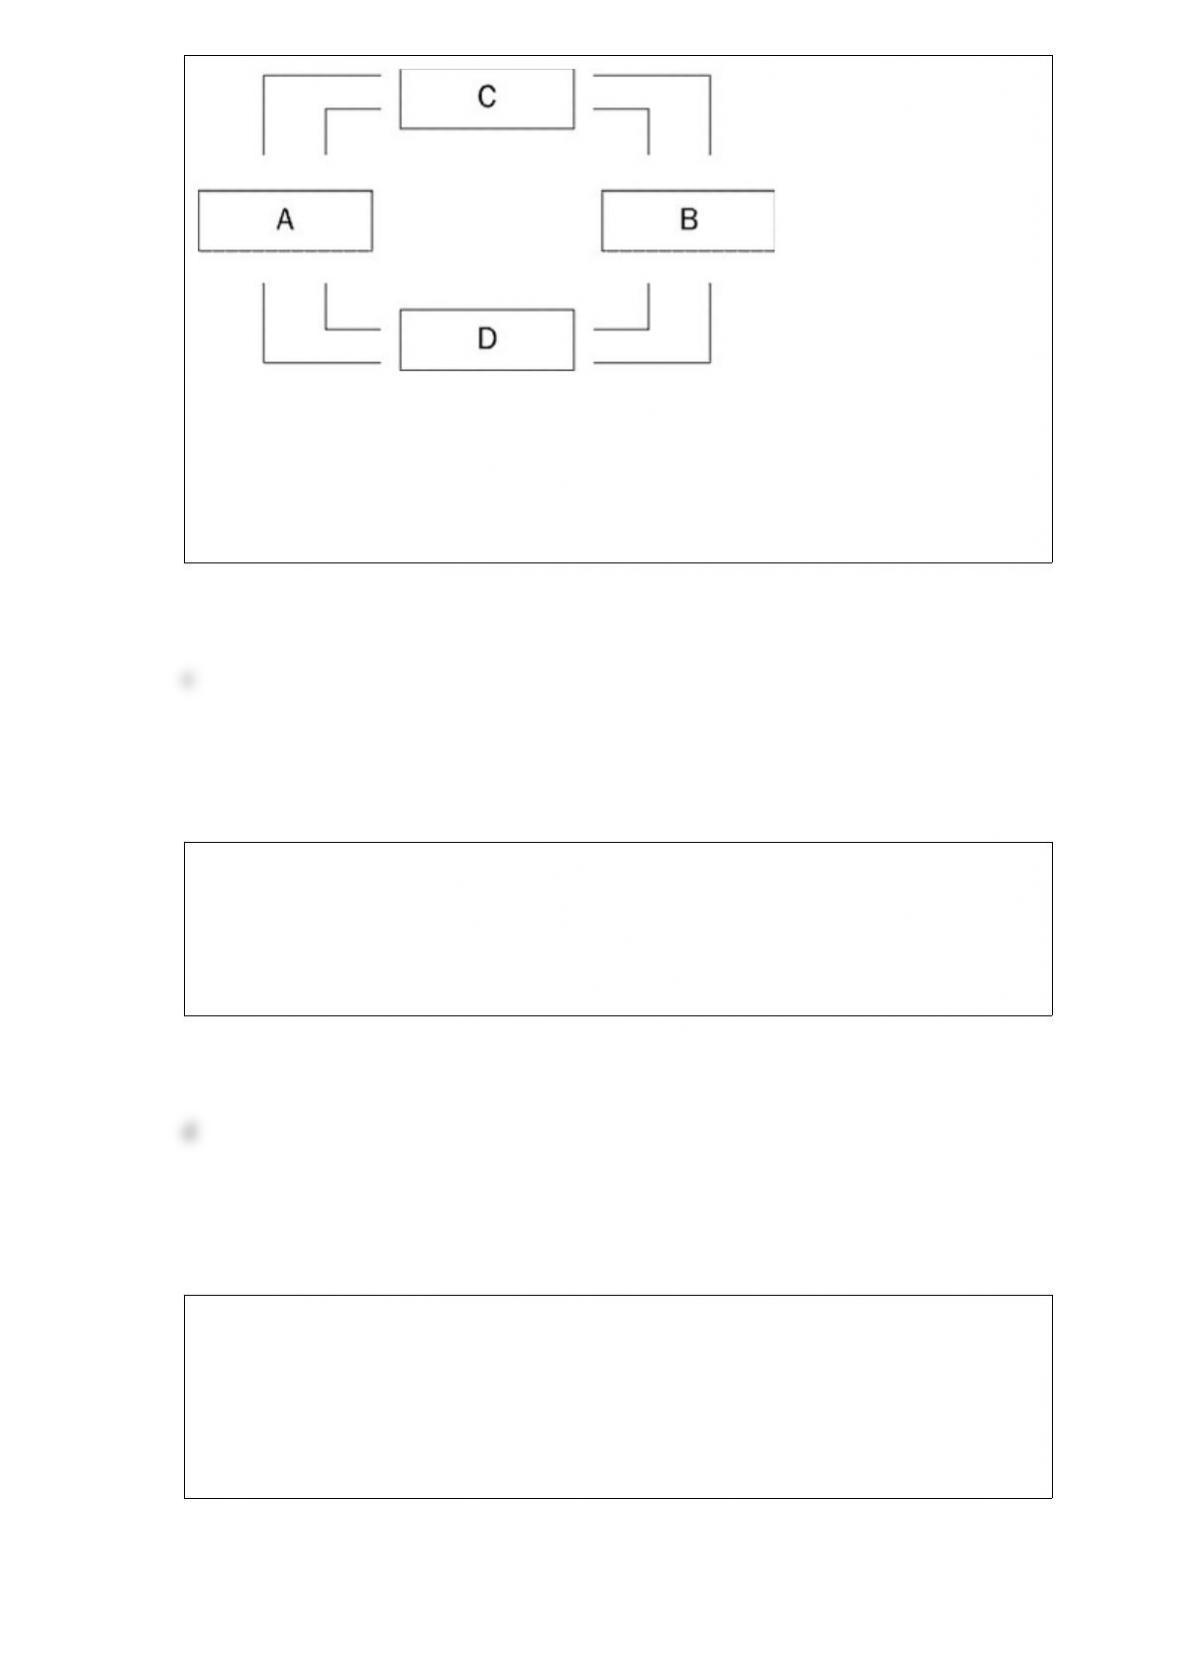
Refer to Figure 22. If the owners of land, labor, and capital are represented by Box B
of this circularflow diagram, then
a. households are represented by Box A.
b. firms are represented by Box C.
c. firms are represented by Box A.
d. firms are sellers in Box B.
Inflation is defined as
a. a period of rising productivity in the economy.
b. a period of rising income in the economy.
c. an increase in the overall level of output in the economy.
d. an increase in the overall level of prices in the economy.
Which of the following is not correct?
a. Economists have two roles: scientist and policy adviser.
b. As scientists, economists develop and test theories to explain the world around them.
c. Economic policies rarely have effects that their architects did not intend or anticipate.
d. As policy advisers, economists use their theories to help change the world for the
better.

Which of the following is an example of a normative, as opposed to positive,
statement?
a. Following the most recent recession, the economy is recovering at a slower than
usual pace.
b. To stimulate the economy during the most recent recession, the federal government
increased spending.
c. In response to the most recent recession, the federal government extended the
duration of unemployment benefits.
d. The federal government’s responses to the most recent recession were insufficient.
Economists normally
a. do not try to explain people’s tastes, but they do try to explain what happens when
tastes change.
b. believe that they must be able to explain people’s tastes in order to explain what
happens when tastes change.
c. do not believe that people’s tastes determine demand, so they ignore the subject of
tastes.
d. incorporate tastes into economic models only to the extent that tastes determine
whether pairs of goods are substitutes or complements.
Suppose a tax of $0.50 per unit on a good creates a deadweight loss of $100. If the tax
is increased to $2.50 per unit, the deadweight loss from the new tax would be
a. $200.
b. $250.
c. $500.
d. $2,500.
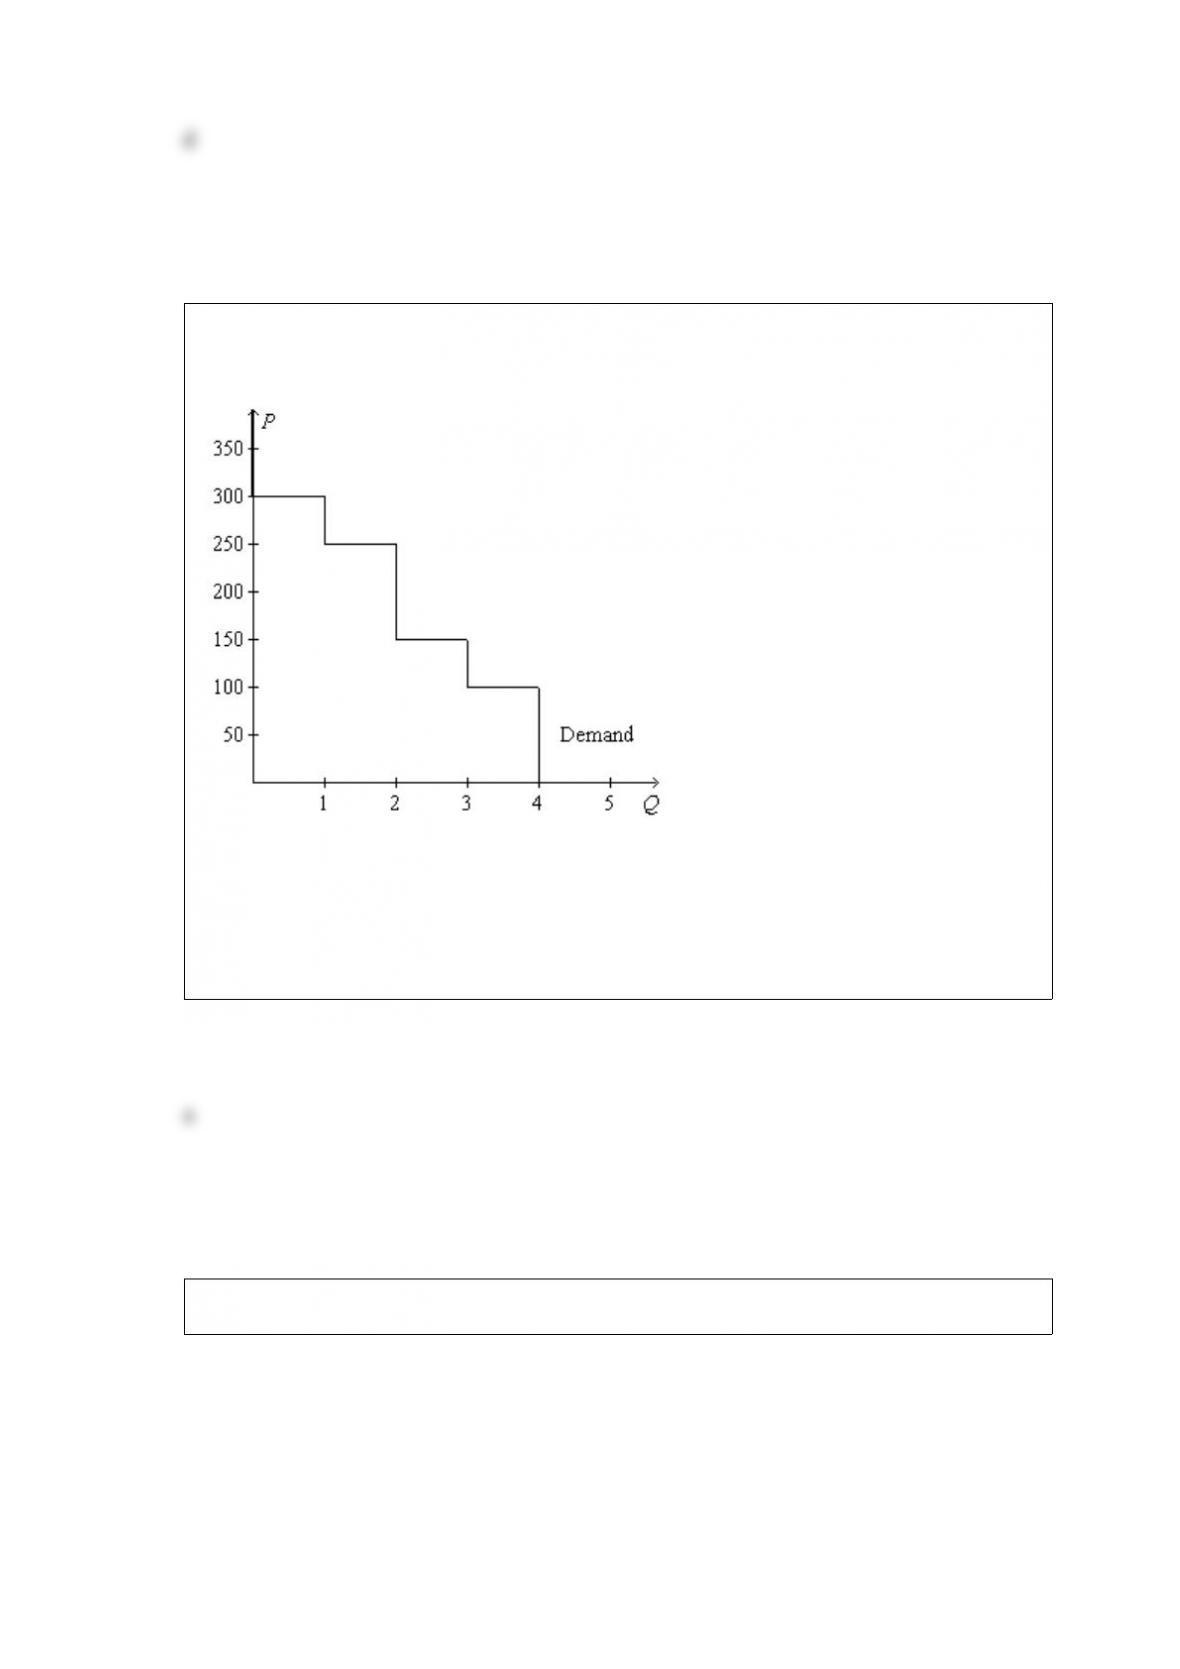
Figure 71
Refer to Figure 71. If the price of the good is $200, then
a. consumer surplus is $150.
b. consumer surplus is $650.
c. producer surplus is $650.
d. producer surplus is $750.
Figure 25
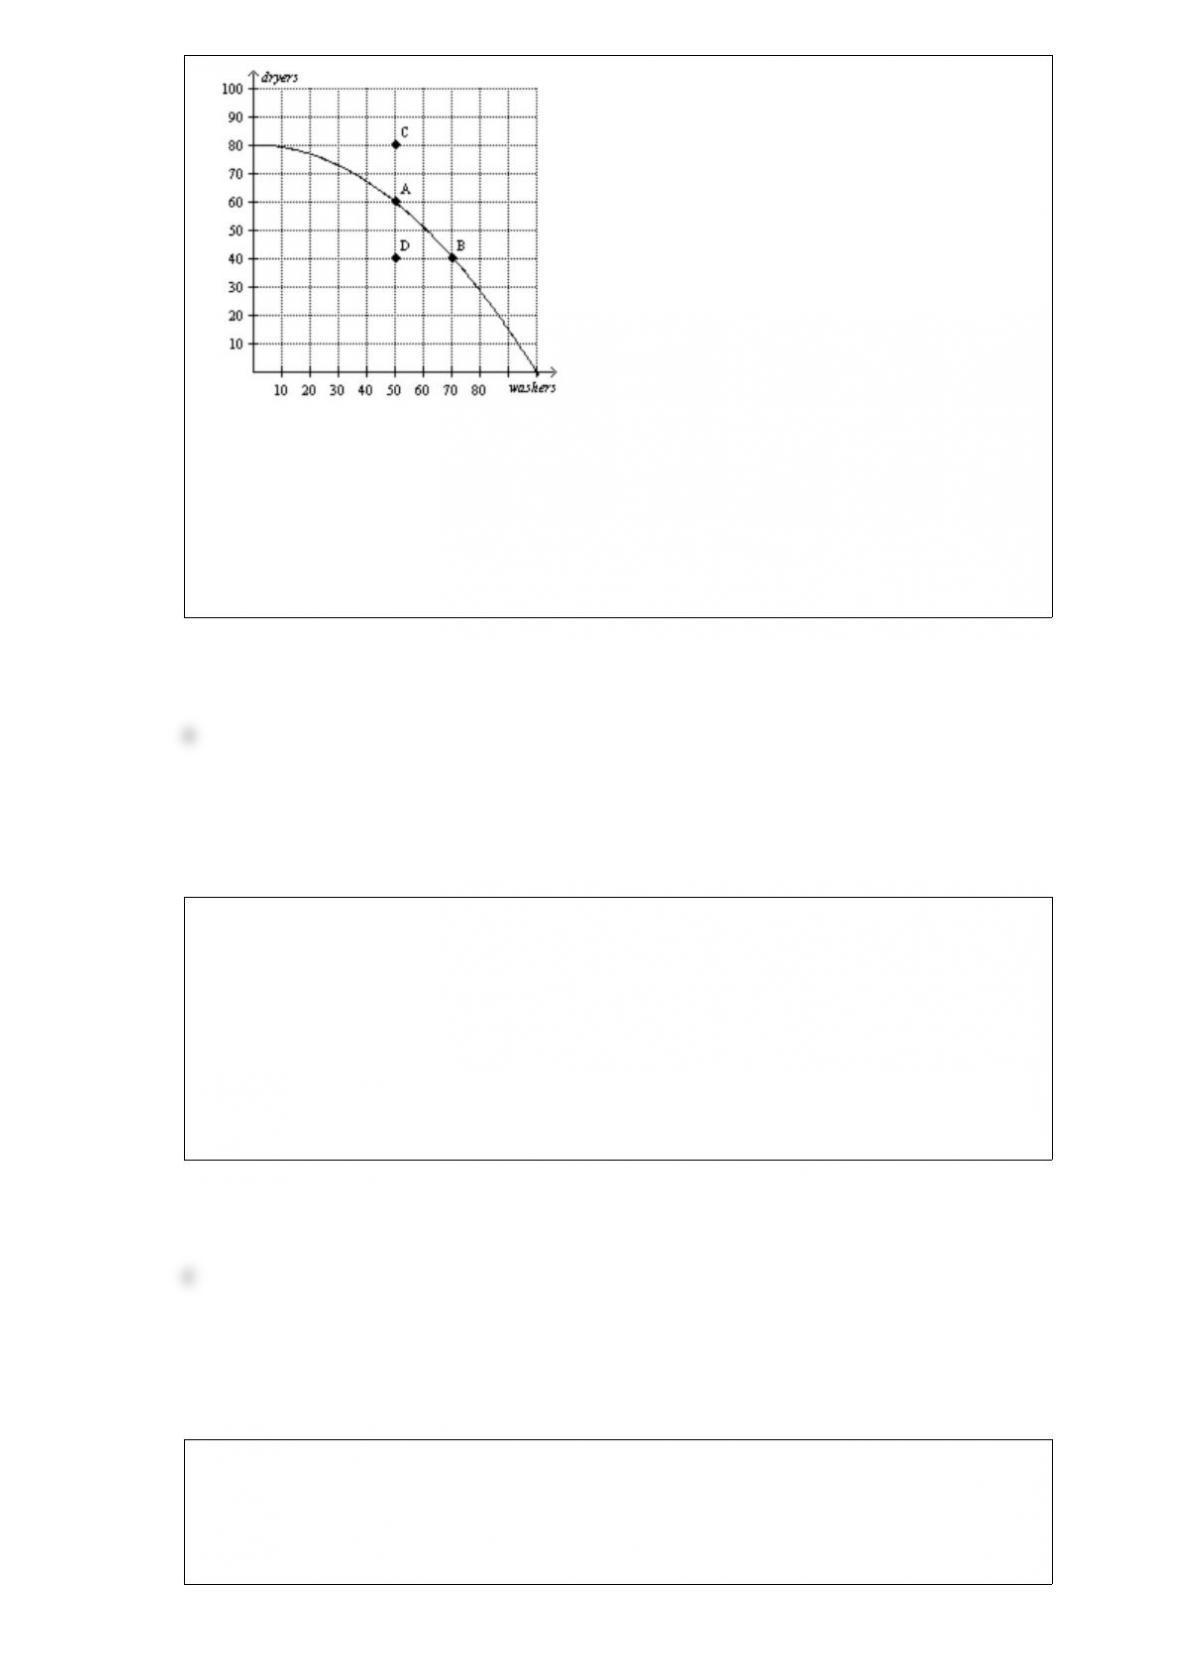
Refer to Figure 25. The opportunity cost of obtaining 20 additional dryers by moving
from point D to point A is
a. 0 washers.
b. 20 washers.
c. 40 washers.
d. None of the above; the economy cannot move from point D to point A.
If the current allocation of resources in the market for hammers is inefficient, then it
must be the case that
a. producer surplus exceeds consumer surplus in the market for hammers.
b. consumer surplus exceeds producer surplus in the market for hammers.
c. the sum of consumer surplus and producer surplus could be increased by moving to a
different allocation of resources.
d. the costs that sellers of hammers are incurring could be reduced by moving to a
different allocation of resources.
Figure 324
The production possibilities frontiers below show how much Bob and Betty can each
produce in 8 hours of time.
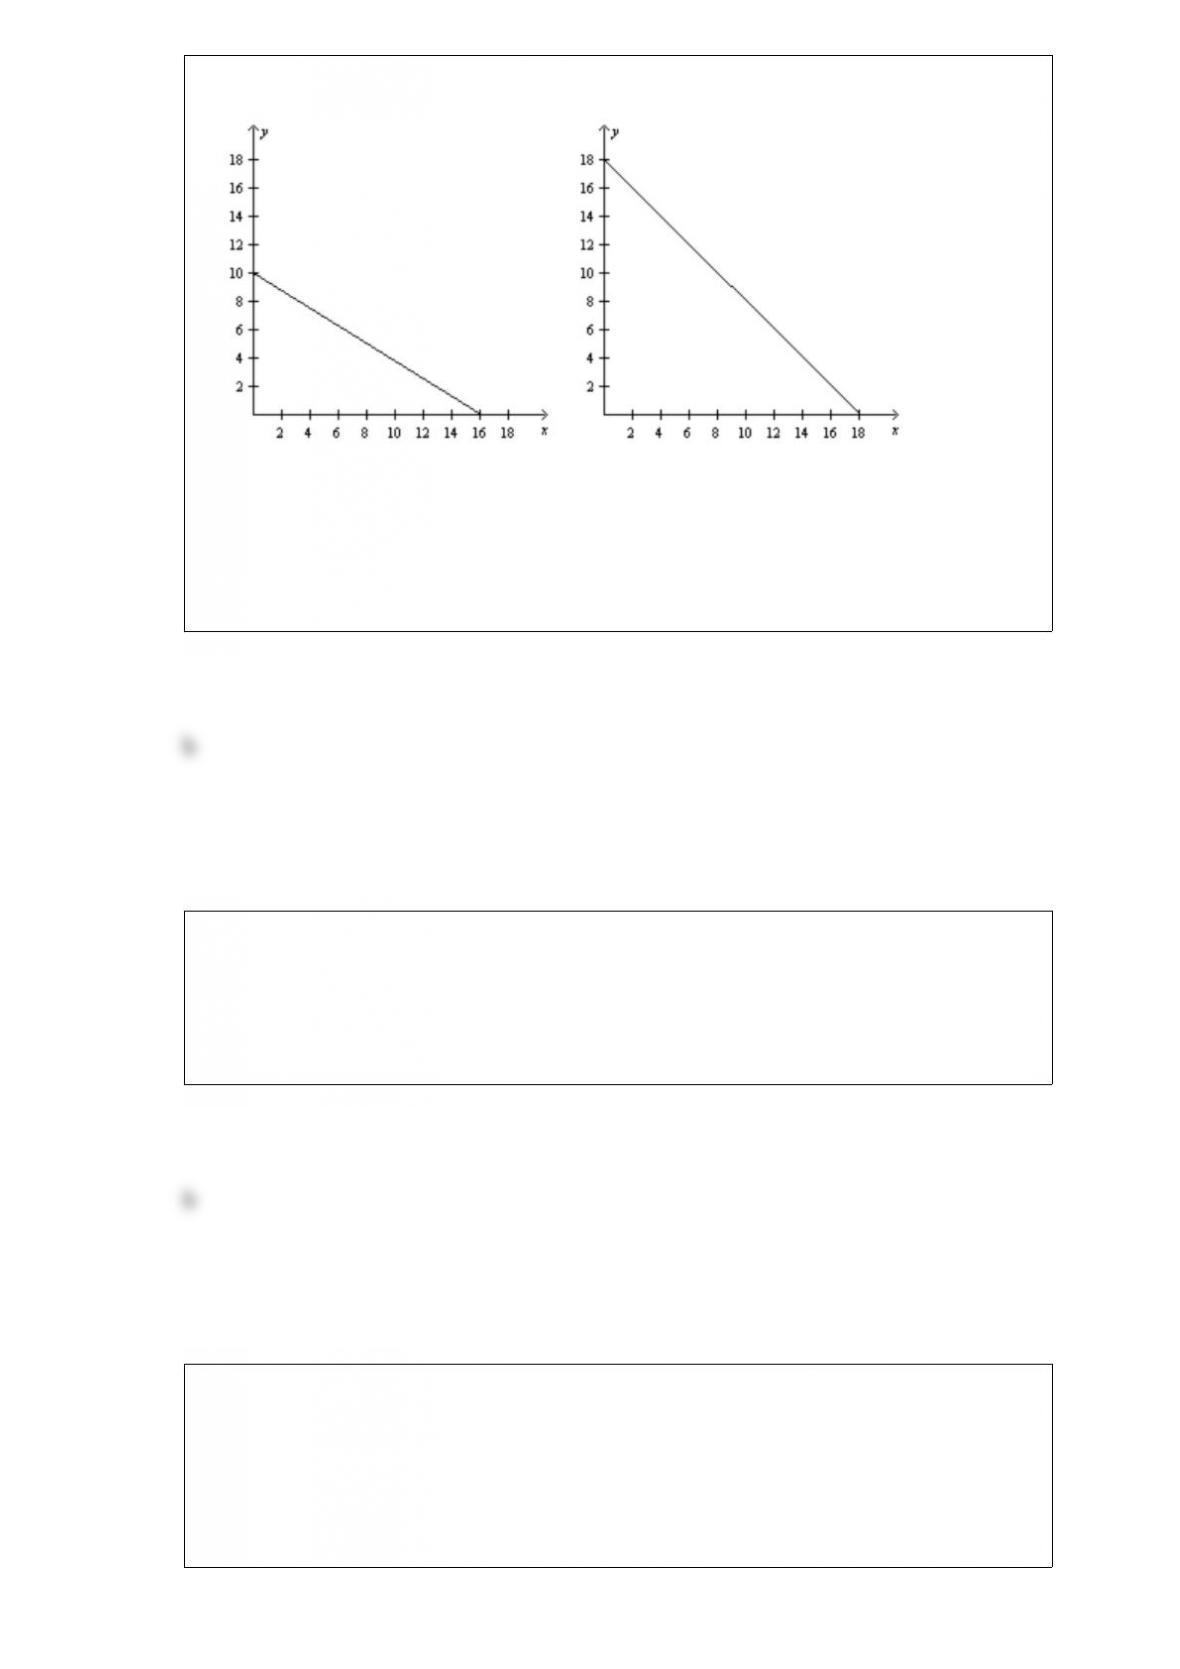
Bob’s Production Possibilities FrontierBetty’s Production Possibilities Frontier
Refer to Figure 324. Betty has
a. an absolute and comparative advantage producing good x.
b. an absolute but not a comparative advantage producing good x.
c. a comparative but not an absolute advantage producing good x.
d. neither a comparative nor an absolute advantage producing good x.
On a graph, consumer surplus is represented by the area
a. between the demand and supply curves.
b. below the demand curve and above price.
c. below the price and above the supply curve.
d. below the demand curve and to the right of equilibrium price.
Opponents of cigarette taxes often argue that tobacco and marijuana are substitutes so
that high cigarette prices
a. encourage marijuana use, and the evidence supports this argument.
b. encourage marijuana use, but the evidence does not support this argument.
c. discourage marijuana use, and the evidence supports this argument.
d. discourage marijuana use, but the evidence does not support this argument.
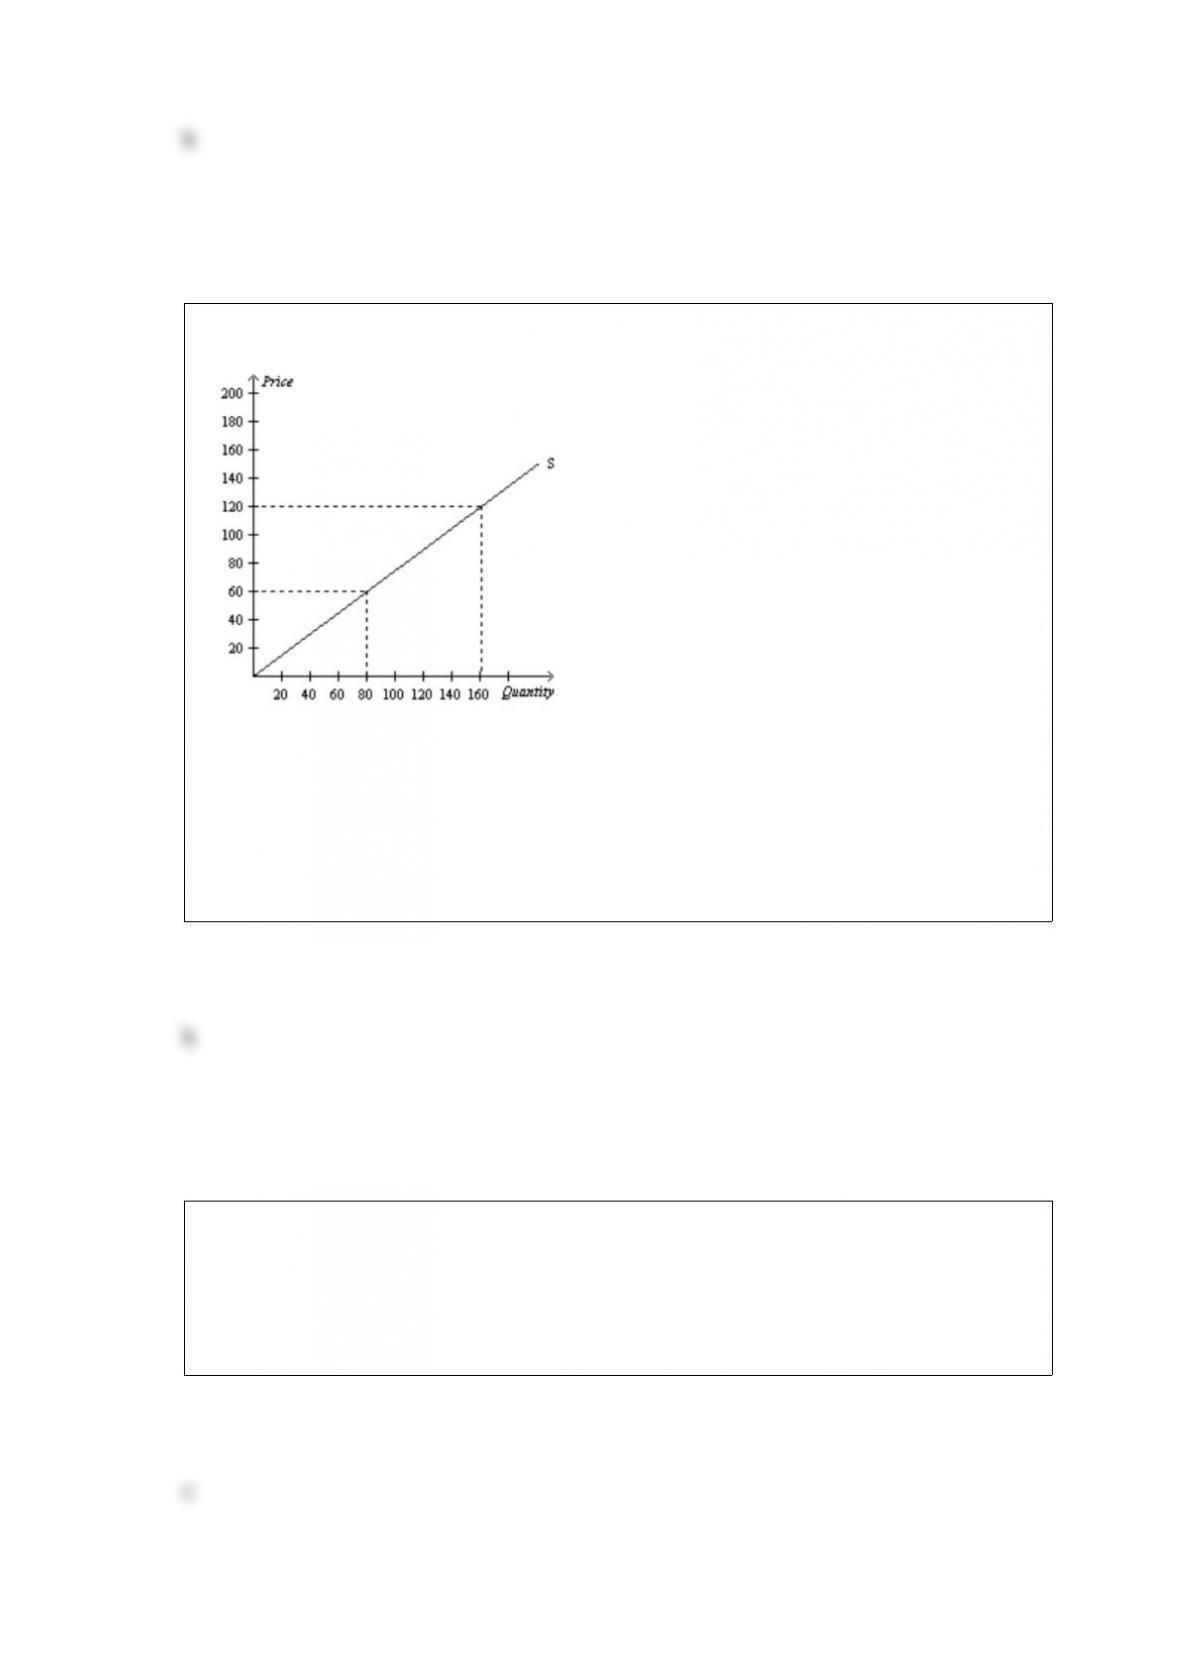
Figure 713
Refer to Figure 713. If the equilibrium price rises from $60 to $120, what is the
producer surplus to new producers in the market?
a. $1,200
b. $2,400
c. $3,600
d. $4,800
If a change in the price of a good results in no change in total revenue, then
a. the demand for the good must be elastic.
b. the demand for the good must be inelastic.
c. the demand for the good must be unit elastic.
d. buyers must not respond very much to a change in price.
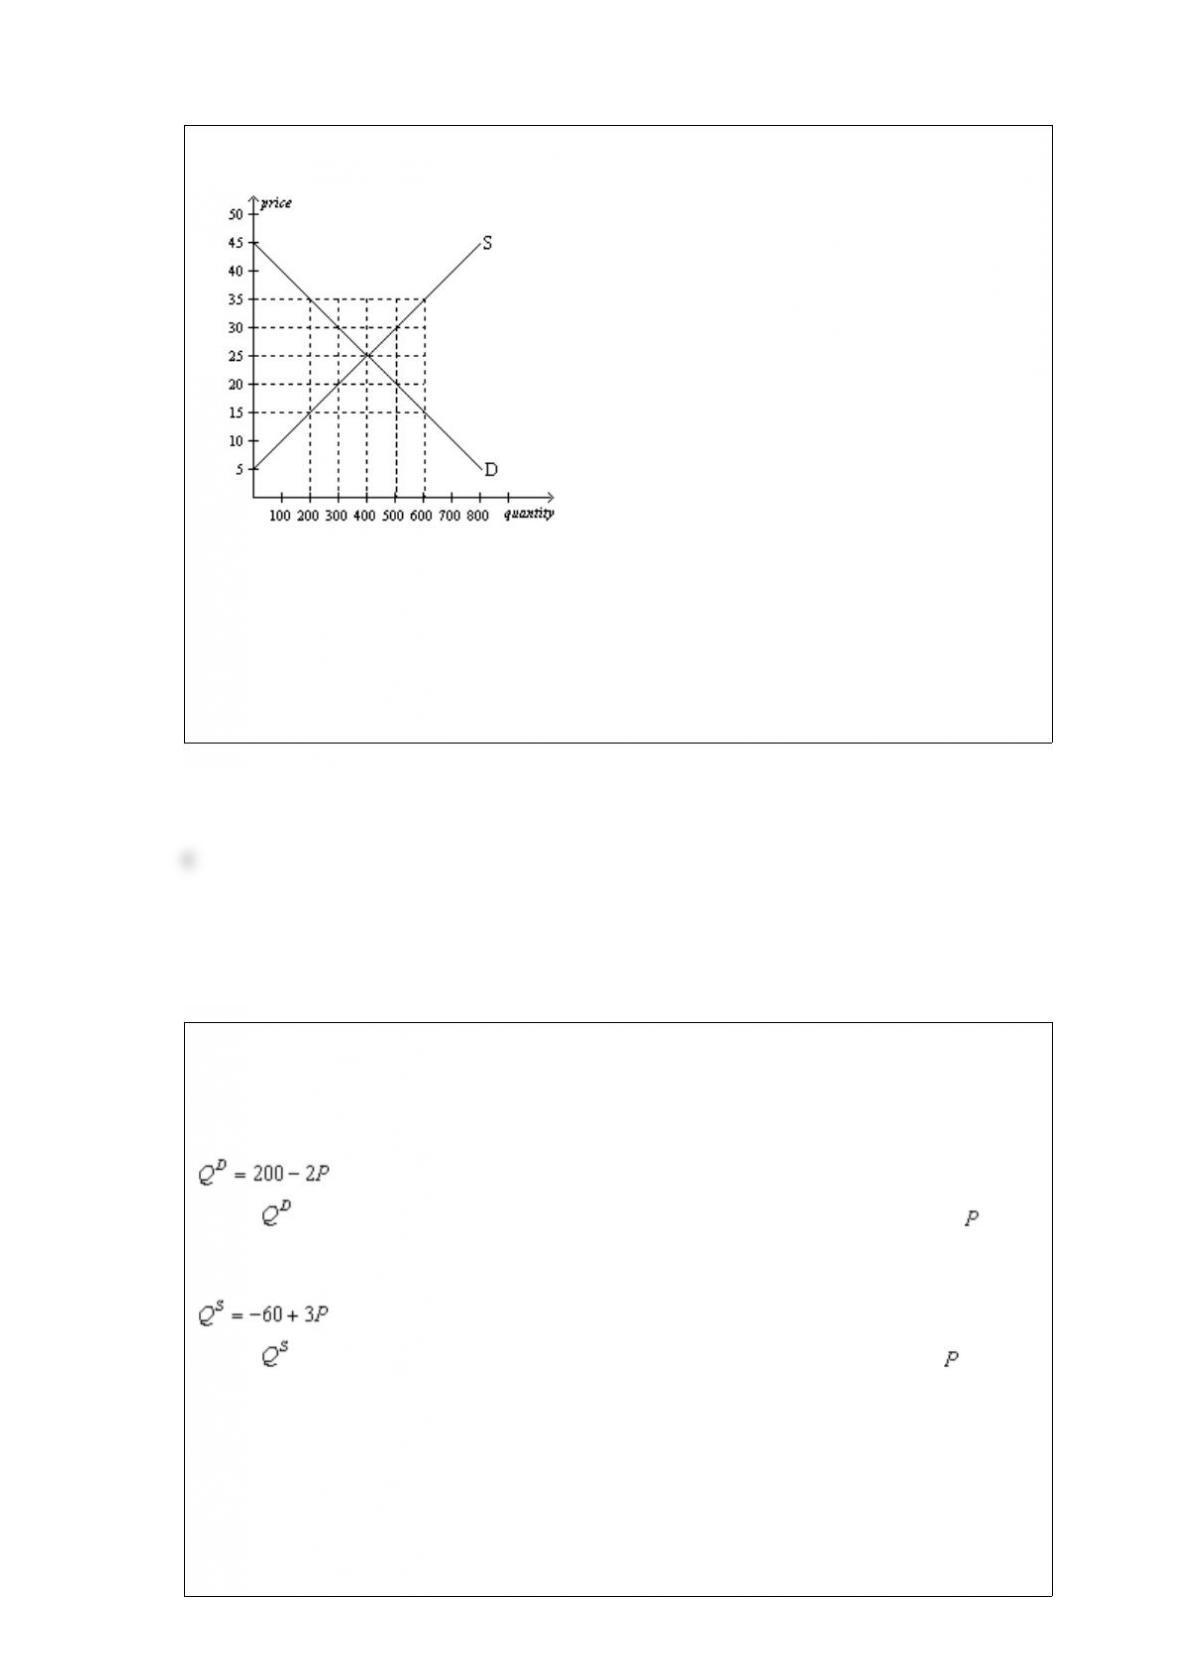
Figure 418
Refer to Figure 418. At what price would there be an excess supply of 200 units of the
good?
a. $15
b. $20
c. $30
d. $35
Scenario 92
• For a small country called Boxland, the equation of the domestic demand curve for
cardboard is
,
where represents the domestic quantity of cardboard demanded, in tons, and
represents the price of a ton of cardboard.
• For Boxland, the equation of the domestic supply curve for cardboard is
,
where represents the domestic quantity of cardboard supplied, in tons, and again
represents the price of a ton of cardboard.
Refer to Scenario 92. If Boxland prohibits international trade in cardboard, then the
equilibrium price of a ton of cardboard is
a. $36 and the equilibrium quantity of cardboard is 74 tons.
b. $44 and the equilibrium quantity of cardboard is 88 tons.
c. $52 and the equilibrium quantity of cardboard is 96 tons.
d. $60 and the equilibrium quantity of cardboard is 100 tons.
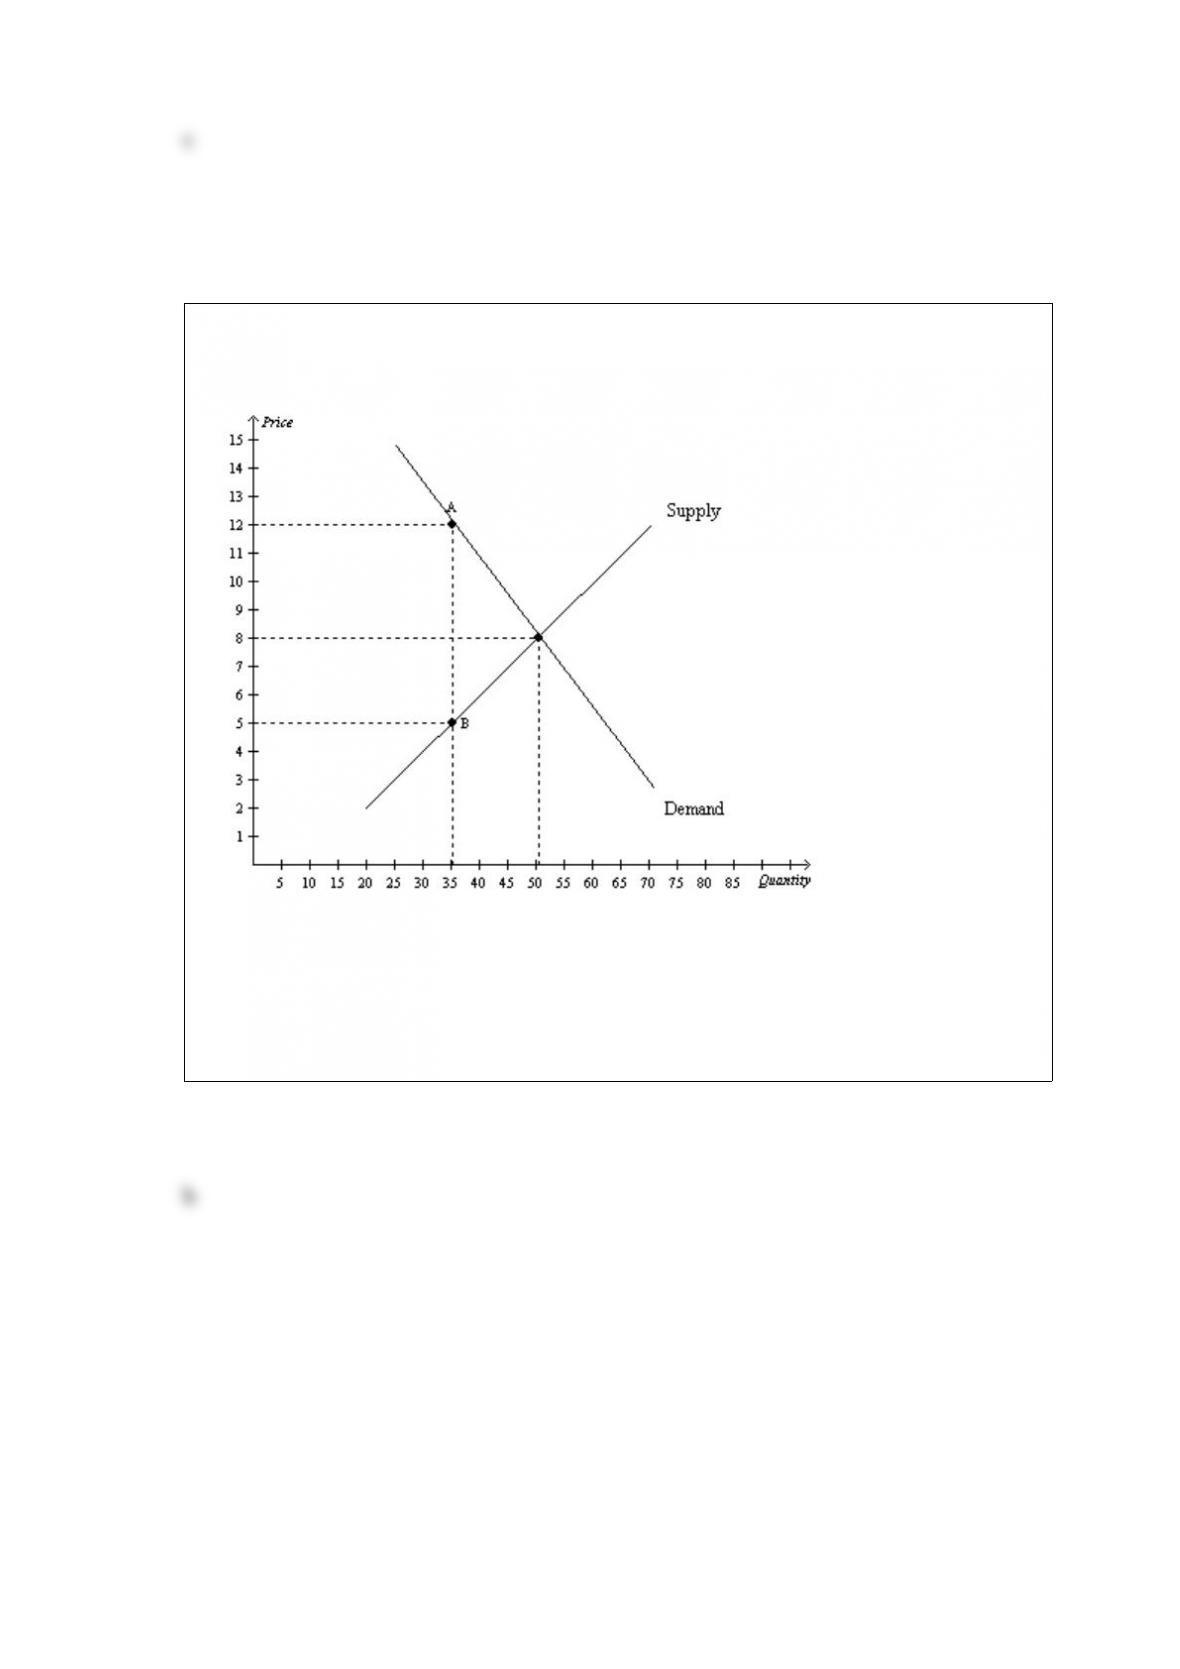
Figure 84
The vertical distance between points A and B represents a tax in the market.
Refer to Figure 84. The perunit burden of the tax on buyers is
a. $3.
b. $4.
c. $5.
d. $8.