
In a market economy, economic activity is guided by
a. the government.
b. central planners.
c. large businesses.
d. prices and selfinterest.
Scenario 82
Roland mows Karla’s lawn for $25. Roland’s opportunity cost of mowing Karla’s lawn
is $20, and Karla’s willingness to pay Roland to mow her lawn is $28.
Refer to Scenario 82. If Karla hires Roland to mow her lawn, Karla’s consumer surplus
is
a. $3.
b. $5.
c. $8.
d. $25.
Table 61
PriceQuantity
DemandedQuantity
Supplied
$2024000
$302000200
$401600400
$501200600
$60800800
$704001000
$8001200
Refer to Table 61. Which of the following price ceilings would be binding in this
market?
a. $80
b. $70
c. $60
d. $50

If there is a shortage of farm laborers, we would expect
a. the wage of farm laborers to increase.
b. the wage of farm laborers to decrease.
c. the price of farm commodities to decrease.
d. a decrease in the demand for substitutes for farm labor.
Suppose a tax of $3 is imposed on each new garden hose that is sold, resulting in a
deadweight loss of $22,500. The supply curve is a typical upwardsloping straight line,
and the demand curve is a typical downwardsloping straight line. Before the tax was
imposed, the equilibrium quantity of garden hoses was 100,000. We can conclude that
the equilibrium quantity of garden hoses after the tax is imposed is
a. 75,000.
b. 85,000.
c. 90,000.
d. 95,000.
Scenario 81
Erin would be willing to pay as much as $100 per week to have her house cleaned.
Ernesto’s opportunity cost of cleaning Erin’s house is $70 per week.
Refer to Scenario 81. If Ernesto cleans Erin’s house for $90, Ernesto’s producer
surplus is
a. $80.
b. $30.
c. $20.

d. $10.
If a price floor is not binding, then
a. there will be a surplus in the market.
b. there will be a shortage in the market.
c. there will be no effect on the market price or quantity sold.
d. the market will be less efficient than it would be without the price floor.
Welfare economics is the study of how
a. the allocation of resources affects economic wellbeing.
b. a price ceiling compares to a price floor.
c. the government helps poor people.
d. a consumer’s optimal choice affects her demand curve.
A tariff on a product
a. enhances the economic wellbeing of the domestic economy.
b. increases the domestic quantity supplied.
c. increases the domestic quantity demanded.
d. results in an increase in producer surplus that is greater than the resulting decrease in
consumer surplus.

During the 1990s, the United Kingdom experienced low levels of inflation while
Turkey experienced high levels of inflation. A likely explanation of these facts is that
a. the United Kingdom has a better education system than Turkey.
b. the rate of growth of the quantity of money was slower in the United Kingdom than
in Turkey.
c. workers in Turkey are more productive than workers in the United Kingdom.
d. there are more instances of market power in Turkey than in the United Kingdom.
When a tax is placed on the buyers of lemonade, the
a. sellers bear the entire burden of the tax.
b. buyers bear the entire burden of the tax.
c. burden of the tax will be always be equally divided between the buyers and the
sellers.
d. burden of the tax will be shared by the buyers and the sellers, but the division of the
burden is not always equal.
Figure 413
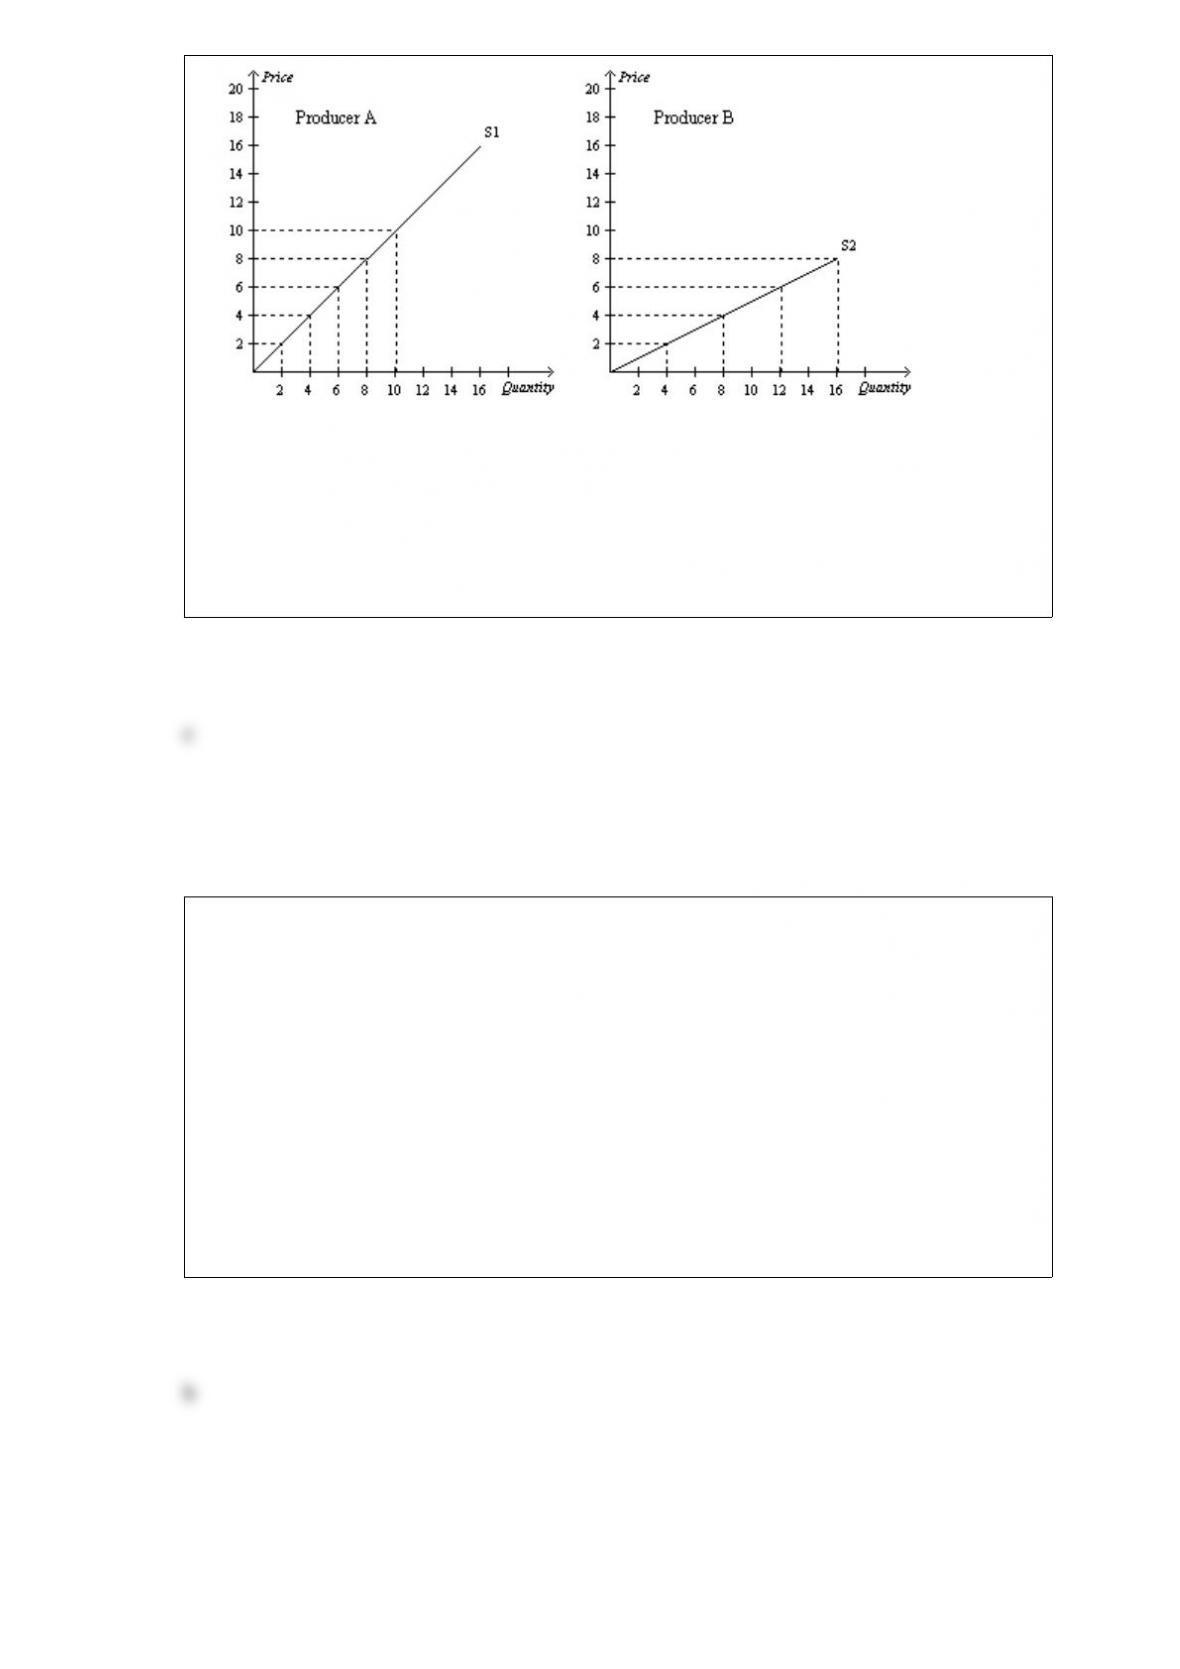
Refer to Figure 413. If Producer A and Producer B are the only producers in the
market, then the market quantity supplied when the price is $8 is
a. 8 units.
b. 16 units.
c. 24 units.
d. 32 units.
Table 332
US and French Production Opportunities
Wine (in millions of gallons)Cheese (in millions of lbs.)
US1632
France84
Refer to Table 332 The US has a comparative advantage in the production of
a. wine.
b. cheese.
c. both wine and cheese.
d. neither wine nor cheese.

Table 64
The following table contains the demand schedule and supply schedule for a market for
a particular good. Suppose sellers of the good successfully lobby Congress to impose a
price floor $3 above the equilibrium price in this market.
PriceQuantity
DemandedQuantity
Supplied
$0150
$1133
$2116
$399
$4712
$5515
$6318
Refer to Table 64. Following the imposition of a price floor $3 above the equilibrium
price, irate buyers convince Congress to repeal the price floor and to impose a price
ceiling $1 below the former price floor. The resulting market price is
a. $2.
b. $3.
c. $4.
d. $5.
What is the most important factor that explains differences in living standards across
countries?
a. the quantity of money
b. the level of unemployment
c. productivity
d. equality
Figure 415
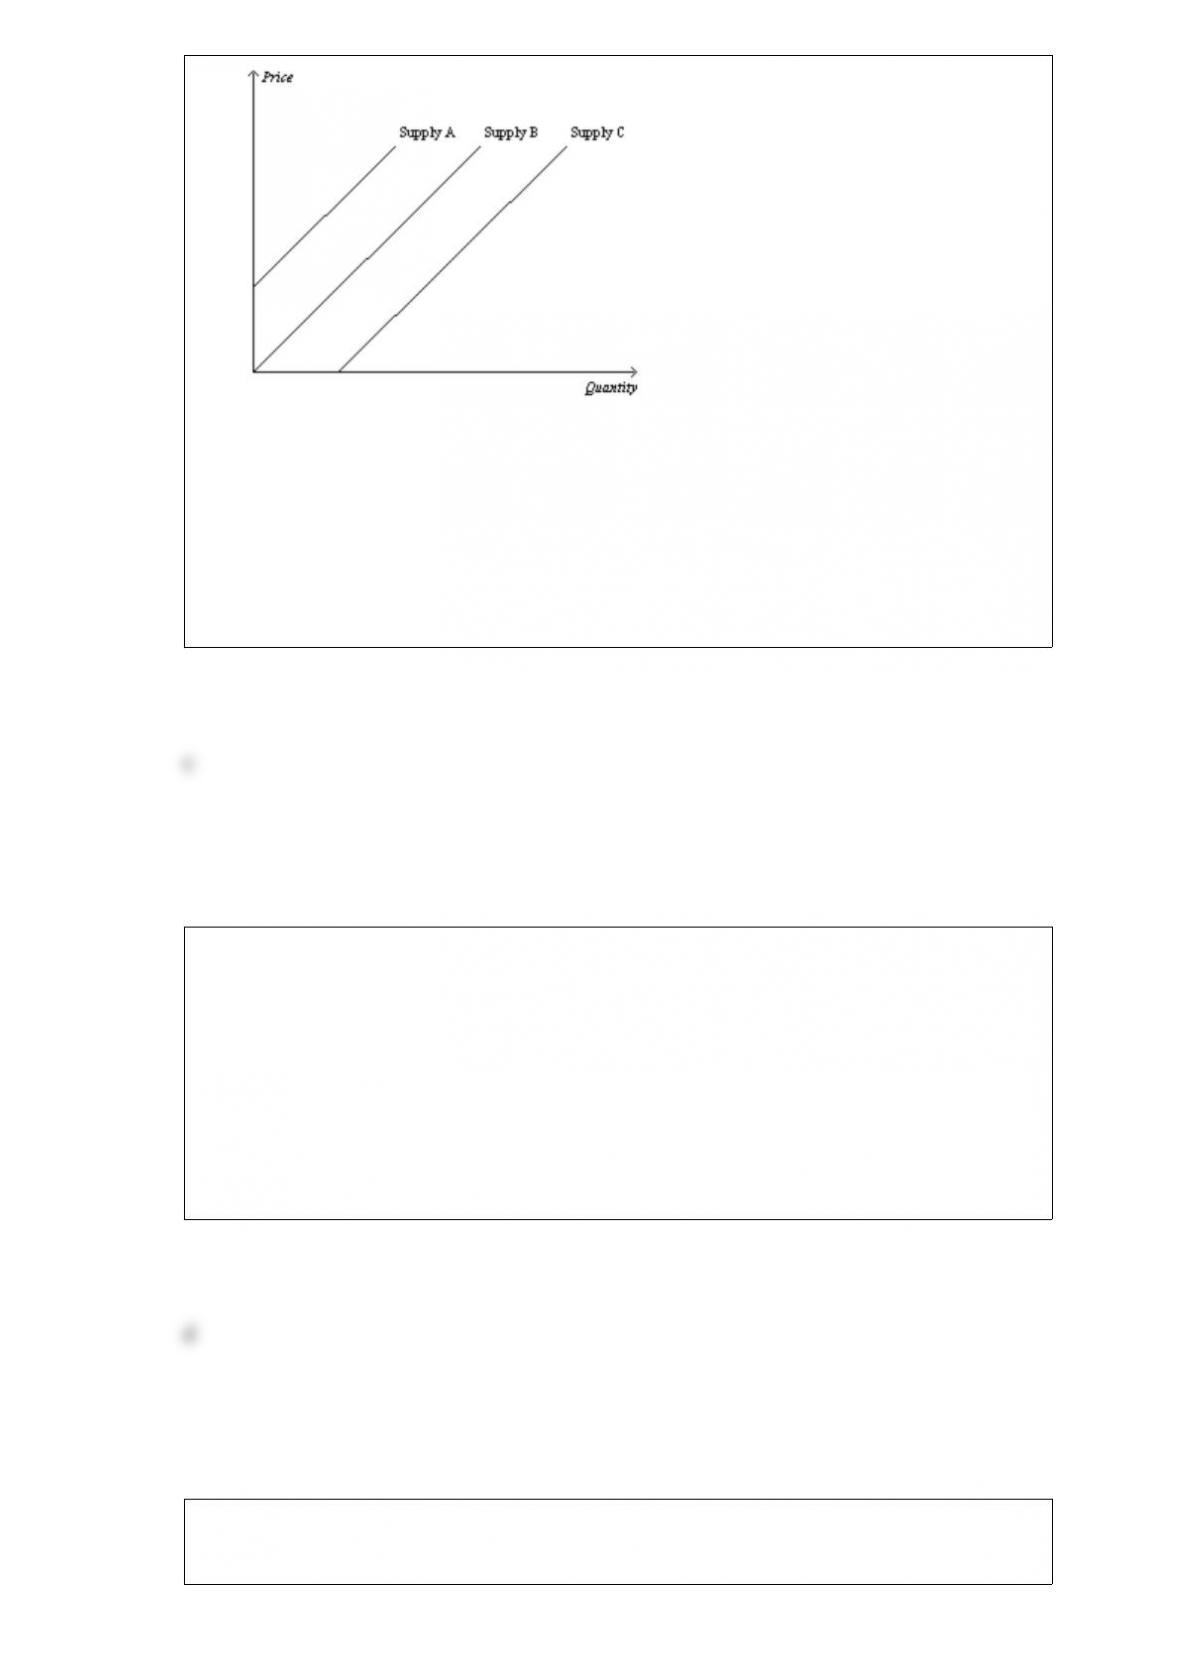
Refer to Figure 415. Which of the following would cause the supply curve to shift
from Supply A to Supply C in the market for beach towels?
a. an increase in the price of beach towels
b. an expectation by firms that the price of beach towels will increase in the very near
future
c. a decrease in the price of cotton
d. a decrease in the number of firms selling beach towels
The following table contains a demand schedule for a good.
PriceQuantity Demanded
$30A
$50300
If the law of demand applies to this good, then A could be
a. 0.
b. 100.
c. 200.
d. 400.
In the circularflow diagram,
a. profit flows from households to firms.
b. labor flows from households to firms.
c. services flow from households to firms.
d. All of the above are correct.
Suppose that two supply curves pass through the same point. One is steep, and the other
is flat. Which of the following statements is correct?
a. The flatter supply curve represents a supply that is inelastic relative to the supply
represented by the steeper supply curve.
b. The steeper supply curve represents a supply that is inelastic relative to the supply
represented by the flatter supply curve.
c. Given two prices with which to calculate the price elasticity of supply, that elasticity
would be the same for both curves.
d. A decrease in demand will increase total revenue if the steeper supply curve is
relevant, while a decrease in demand will decrease total revenue if the flatter supply
cure is relevant.
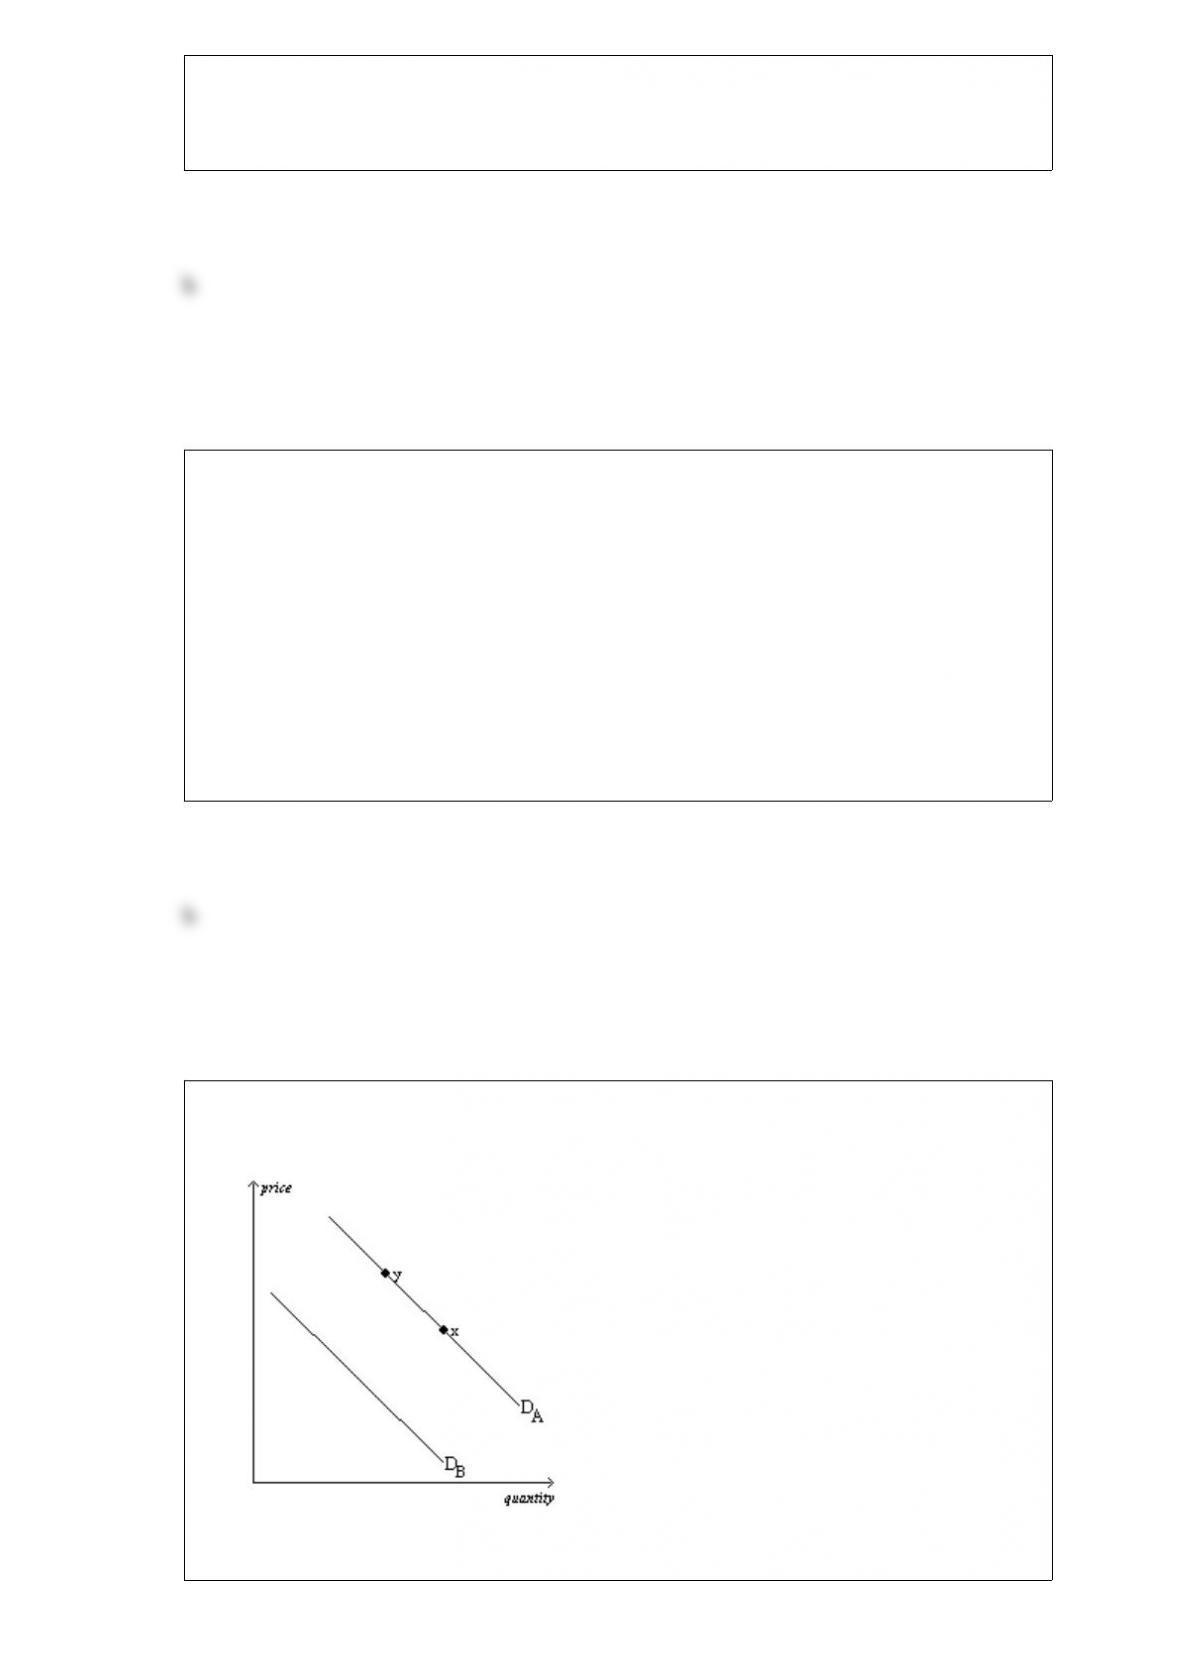
Figure 424
The diagram below pertains to the demand for turkey in the United States.
Refer to Figure 424. All else equal, a sale on chicken would cause a move from
a. DA to DB.
b. DB to DA.
c. x to y.
d. y to x.
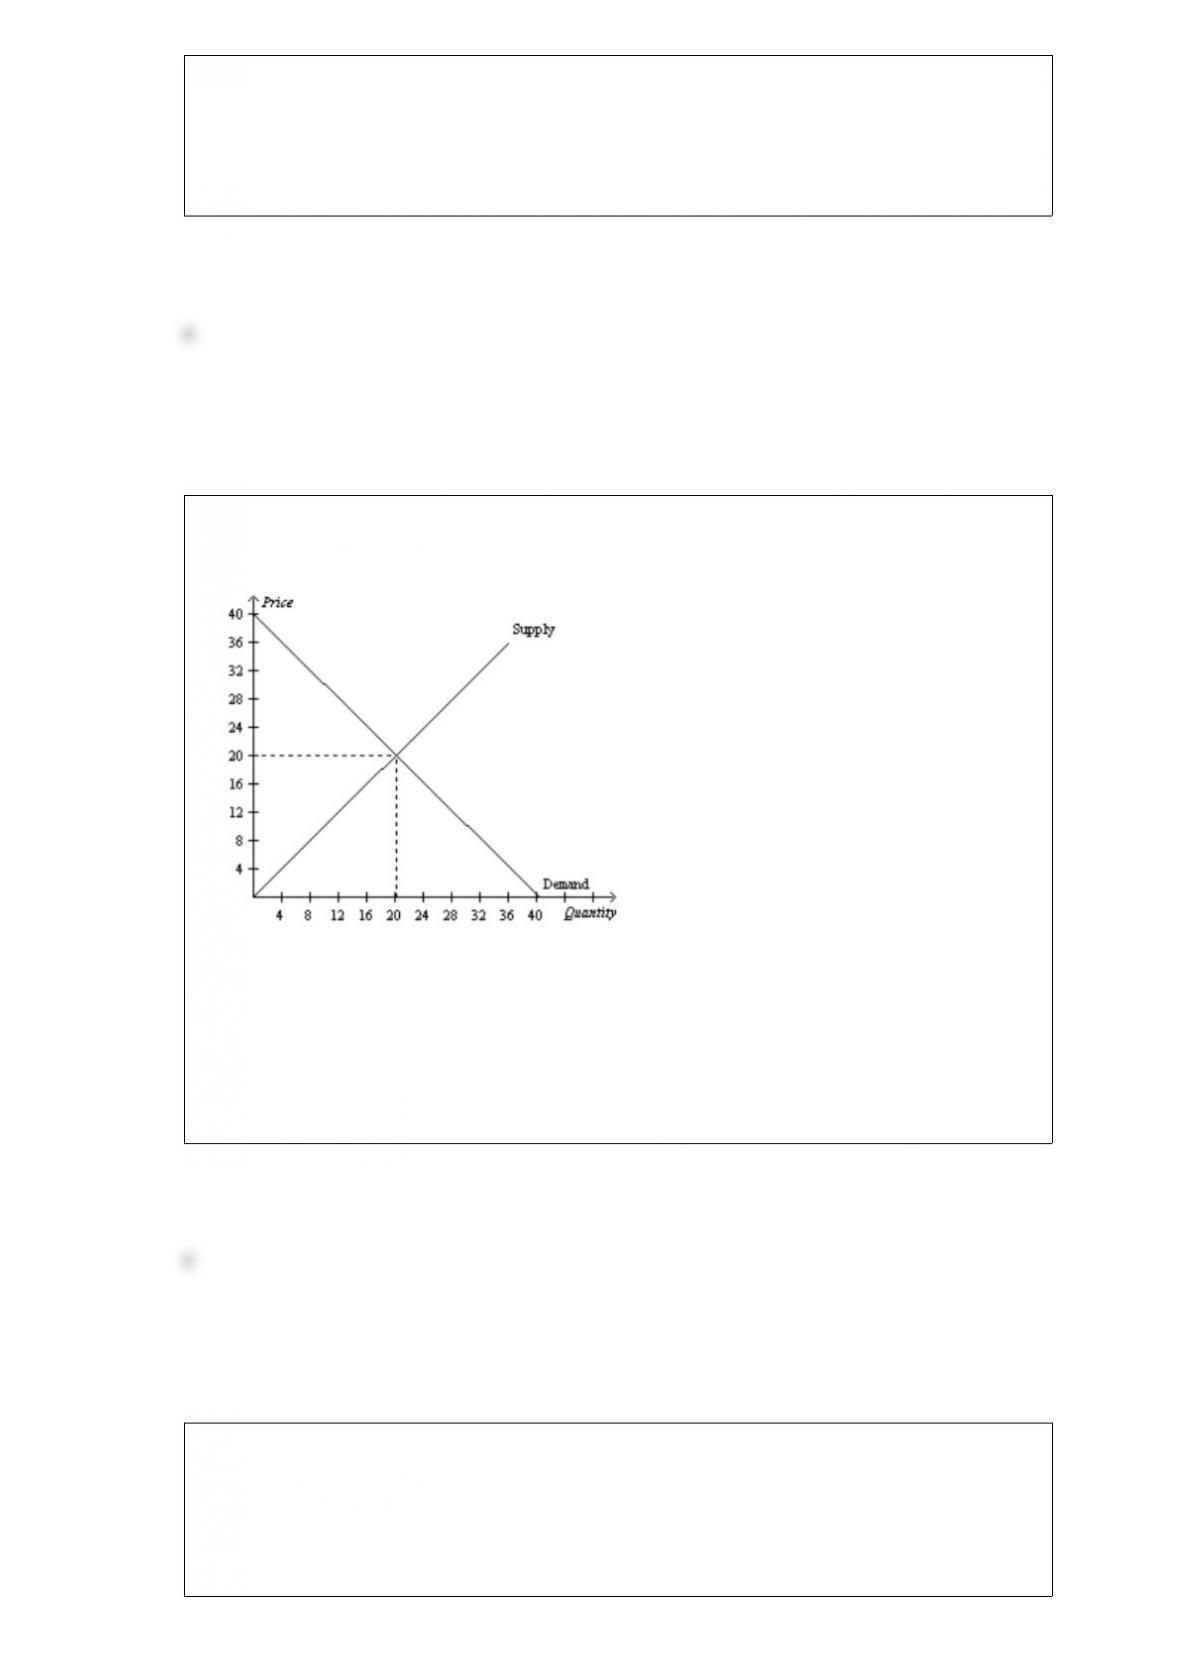
Figure 617
This figure shows the market demand and market supply curves for good Y
Refer to Figure 617. A governmentimposed price of $24 in this market is an example
of a
a. binding price ceiling that creates a shortage.
b. nonbinding price ceiling that creates a shortage.
c. binding price floor that creates a surplus.
d. nonbinding price floor that creates a surplus.
The balance between efficiency and equality is an illustration of
a. scarcity.
b. tradeoffs.
c. the forces of supply and demand.
d. none of the above.

Which of the following is a subject that economists study?
a. the growth in average income
b. the fraction of the population that cannot find work
c. the rate at which prices are rising
d. All of the above are correct.
Table 321
Assume that Jamaica and Norway can switch between producing coolers and producing
radios at a constant rate. The following table shows the number of coolers or number of
radios each country can produce in one day.
Output Produced in One Day
CoolersRadios
Jamaica126
Norway243
Refer to Table 321. Jamaica should specialize in the production of
a. coolers and Norway should specialize in the production of radios.
b. radios and Norway should specialize in the production of coolers.
c. both goods and Norway should specialize in the production of neither good.
d. neither good and Norway should specialize in the production of both goods.
Both the production of goods and services and the unemployment rate are used to
measure
a. the business cycle.
b. productivity.
c. the interest rate.
d. inflation.
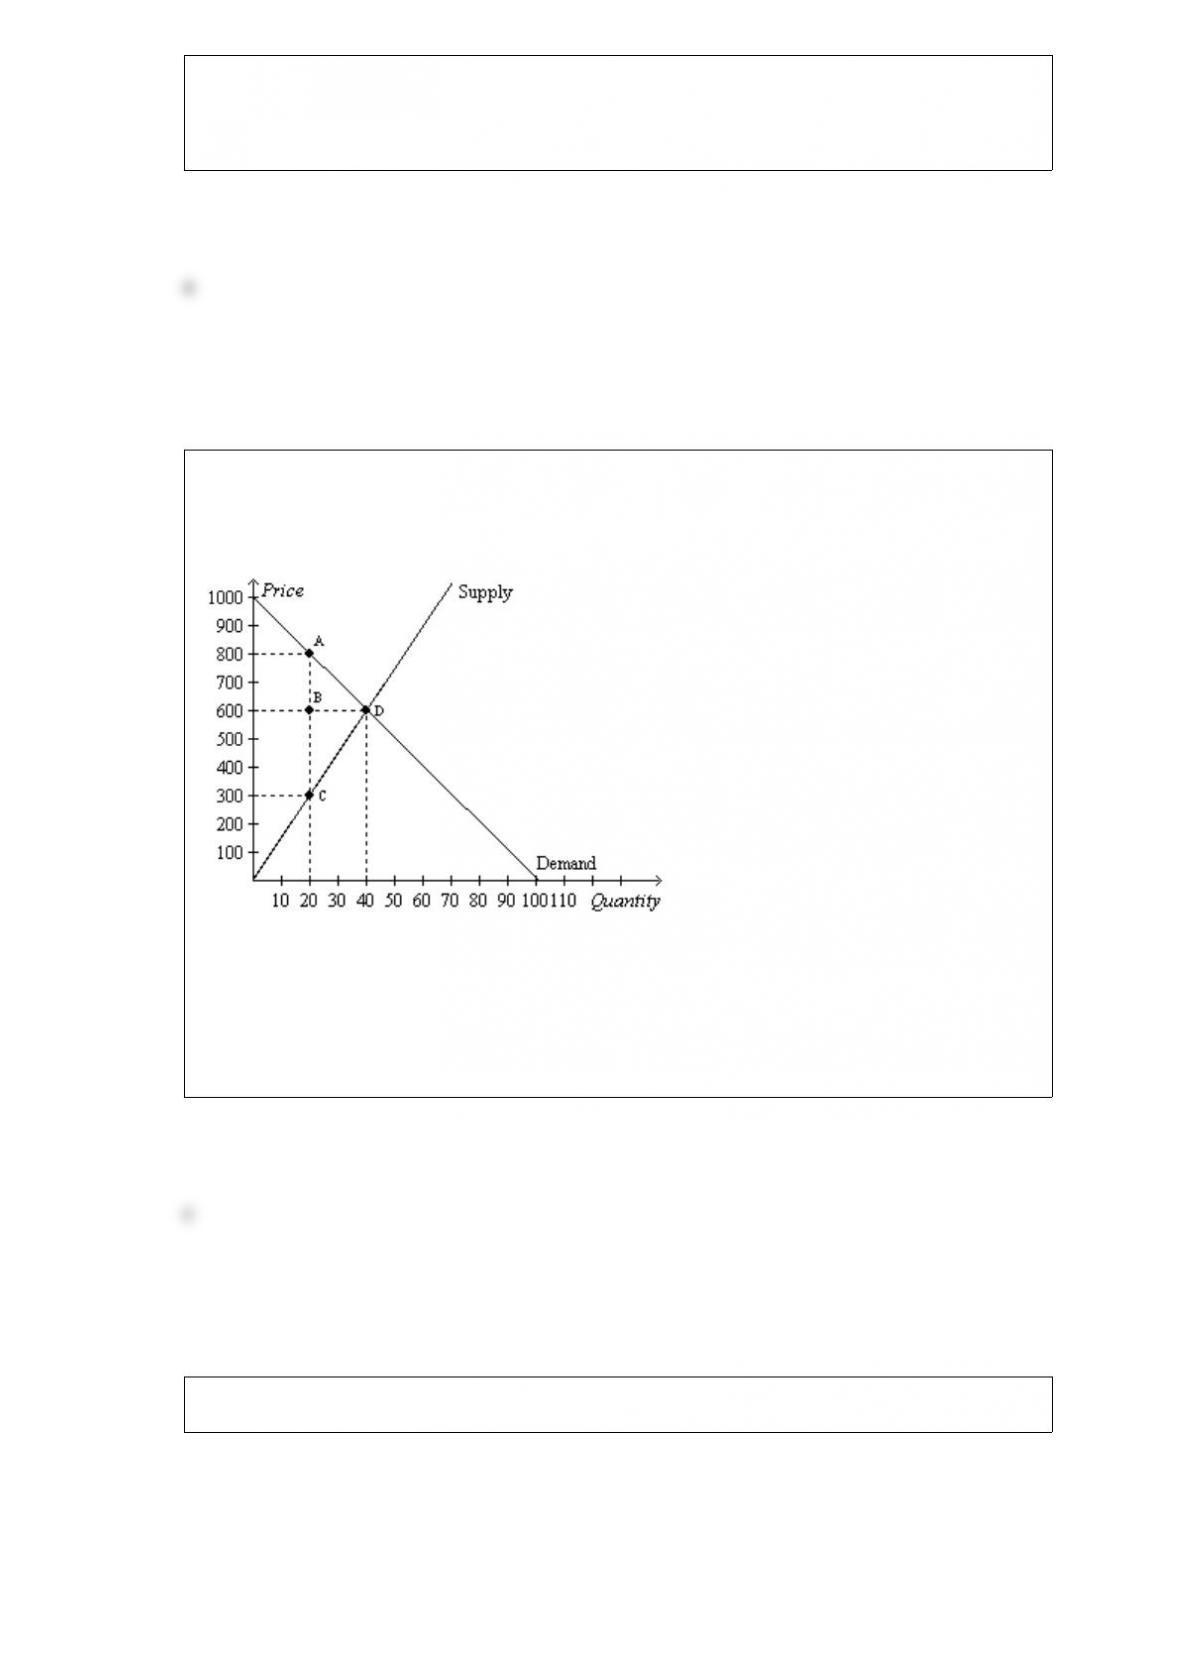
Figure 89
The vertical distance between points A and C represents a tax in the market.
Refer to Figure 89. The imposition of the tax causes the quantity sold to
a. increase by 20 units.
b. increase by 500 units.
c. decrease by 20 units.
d. decrease by 500 units.
Figure 620
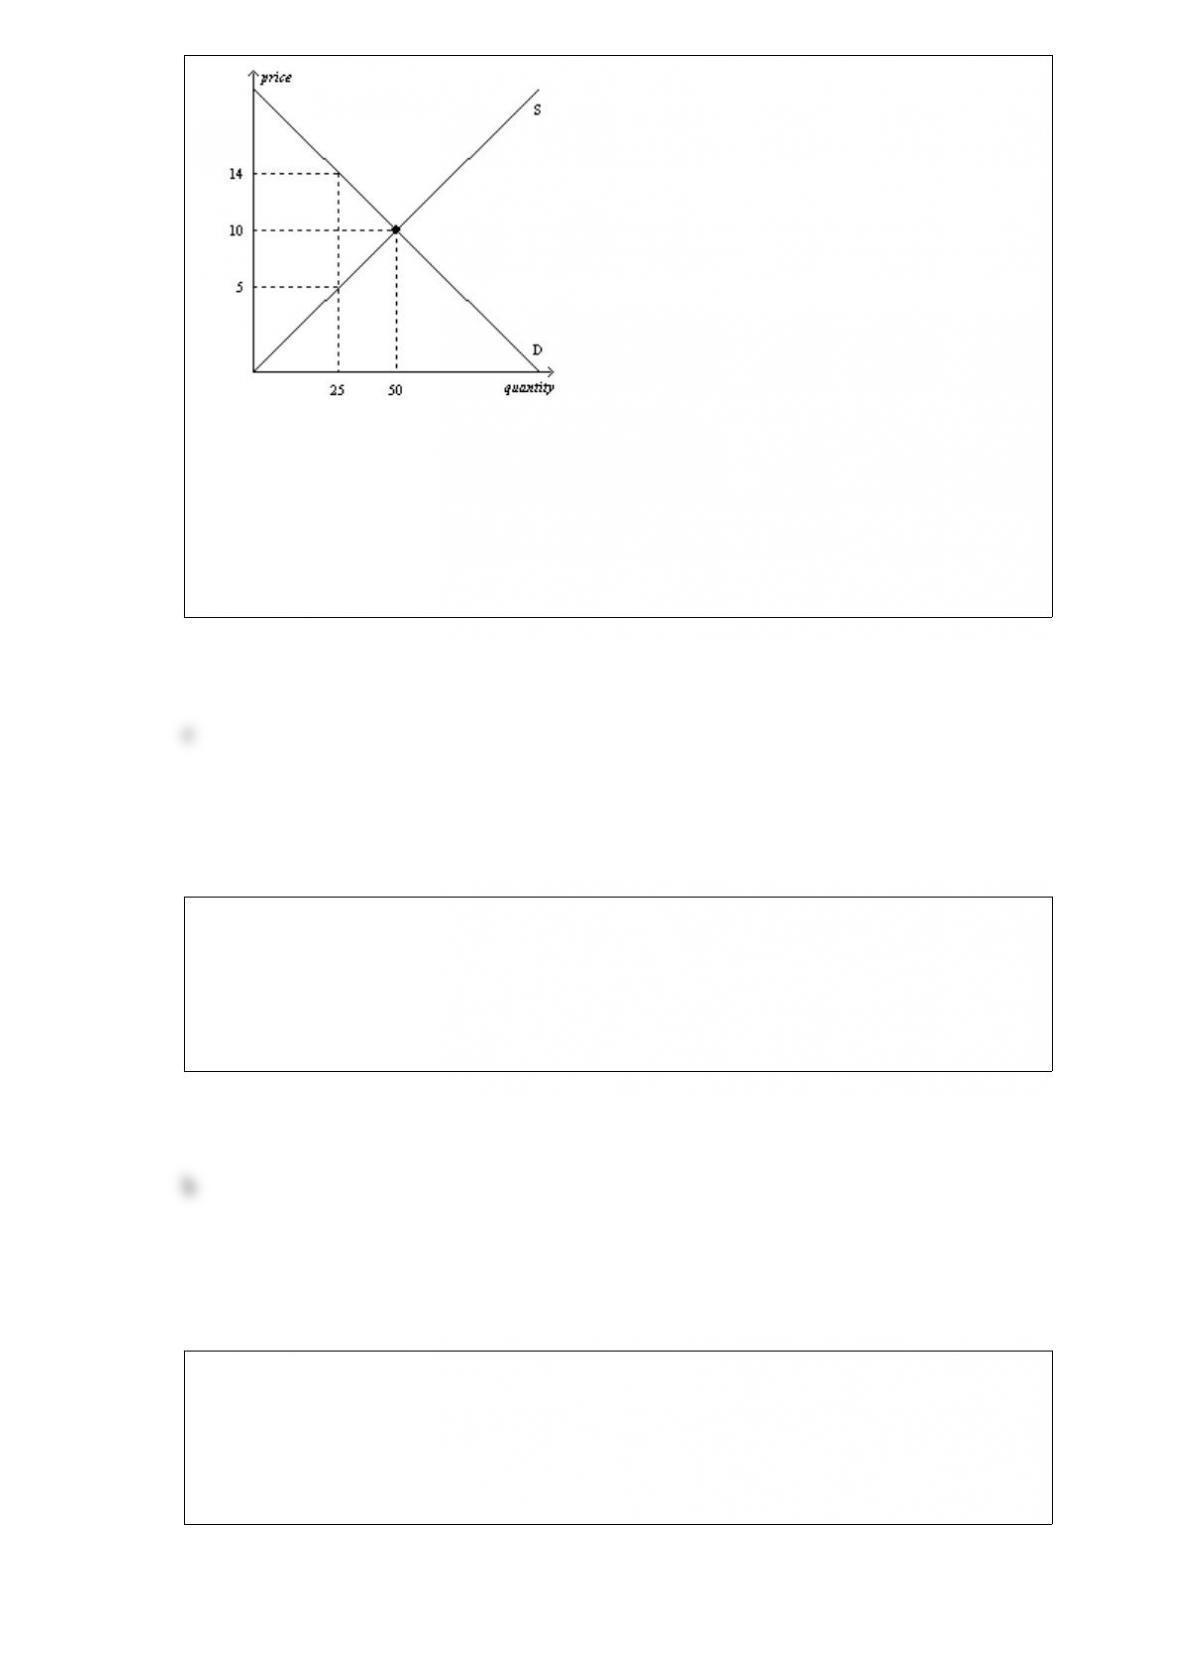
Refer to Figure 620. Suppose a tax of $5 per unit is imposed on this market. Which of
the following is correct?
a. Buyers and sellers will share the burden of the tax equally.
b. Buyers will bear more of the burden of the tax than sellers will.
c. Sellers will bear more of the burden of the tax than buyers will.
d. Any of the above is possible.
Holding the nonprice determinants of supply constant, a change in price would
a. result in either a decrease in supply or an increase in supply.
b. result in a movement along a stationary supply curve.
c. result in a shift of demand.
d. have no effect on the quantity supplied.
Which of the following is true when the price of a good or service rises?
a. Buyers who were already buying the good or service are better off.
b. Some buyers exit the market.
c. The total consumer surplus in the market increases.
d. The total value of purchases before and after the price change is the same.
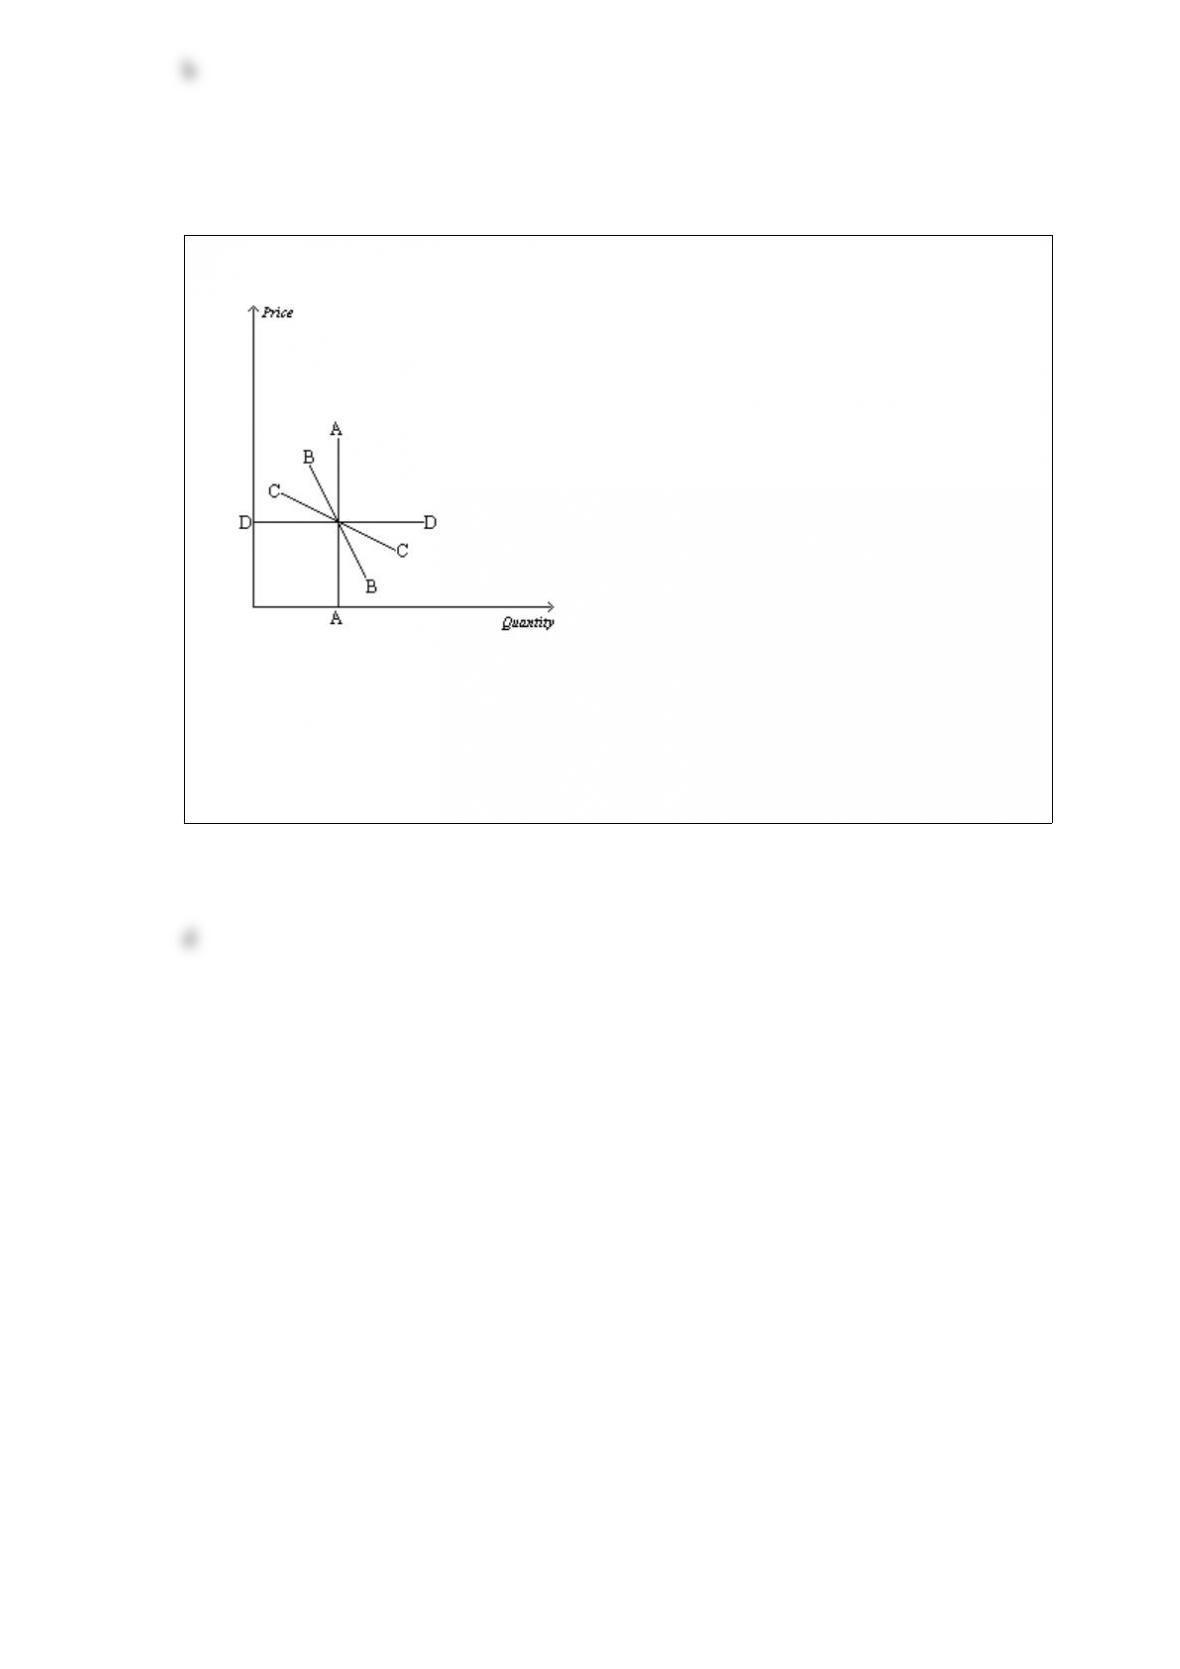
Figure 53
Refer to Figure 53. Which demand curve is perfectly elastic?
a. A
b. B
c. C
d. D