Which of the following statements is true about profit?
A) Profit refers to the revenue received from the sale of a quantity of goods.
B) Profit is calculated by multiplying price and quantity sold.
C) The terms “accounting profit” and “economic profit” can be used interchangeably.
D) Profit is the difference between revenue and cost.
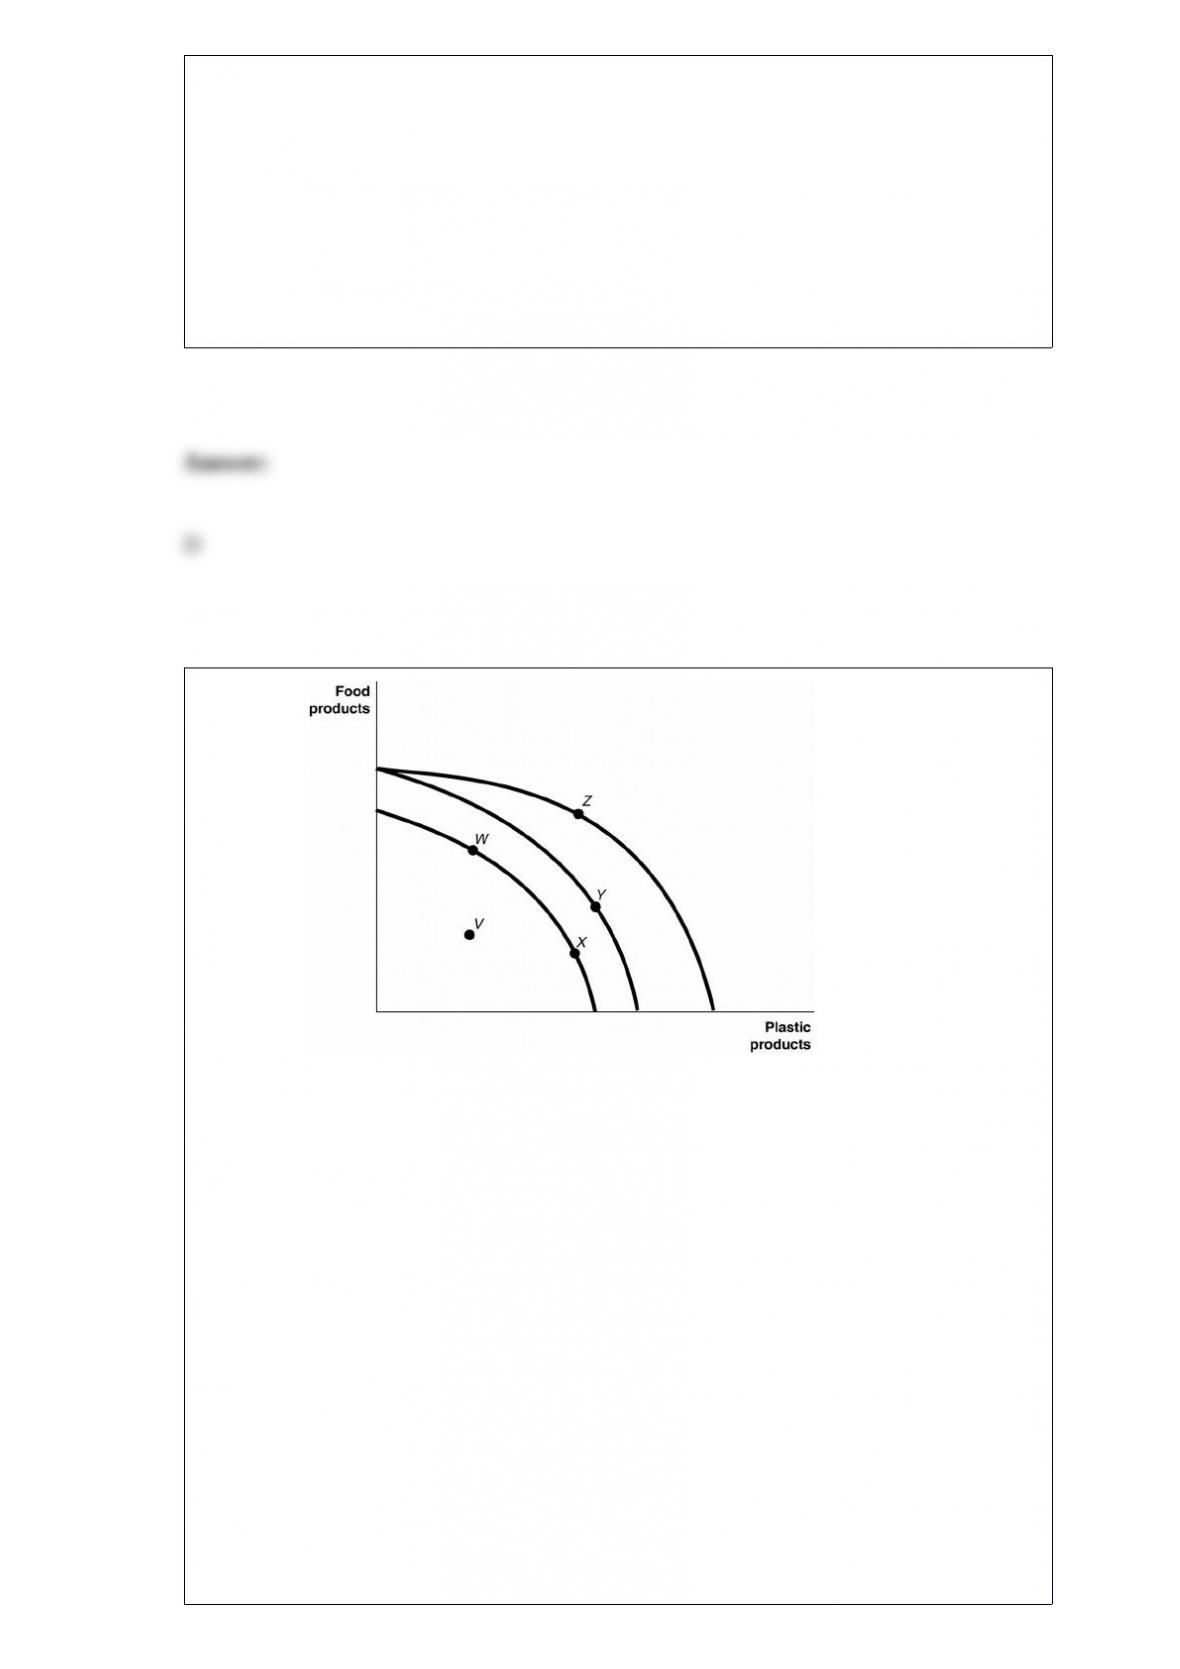
Figure 2-4
Figure 2-4 shows various points on three Different production possibilities frontiers for
a nation.
Consider the following events:
a. an increase in the patent protection period to 30 years
b. an increase of a nation’s capital stock
c. an improved property rights system Which of the events listed above could cause a
movement from V to W?
A) a only
B) a and b only
C) a and c only

D) b and c only
E) a, b, and c
What two measures of macroeconomic activity are often referred to as the “twin
deficits”?
A) net capital flows and net exports
B) the foreign exchange deficit and net foreign investment
C) the budget deficit and the trade balance
D) the saving-investment deficit and the export deficit
When you buy newly-issued shares of Facebook stock, this transaction takes place in
the
A) primary market.
B) bond market.
C) secondary market.
D) bear market.
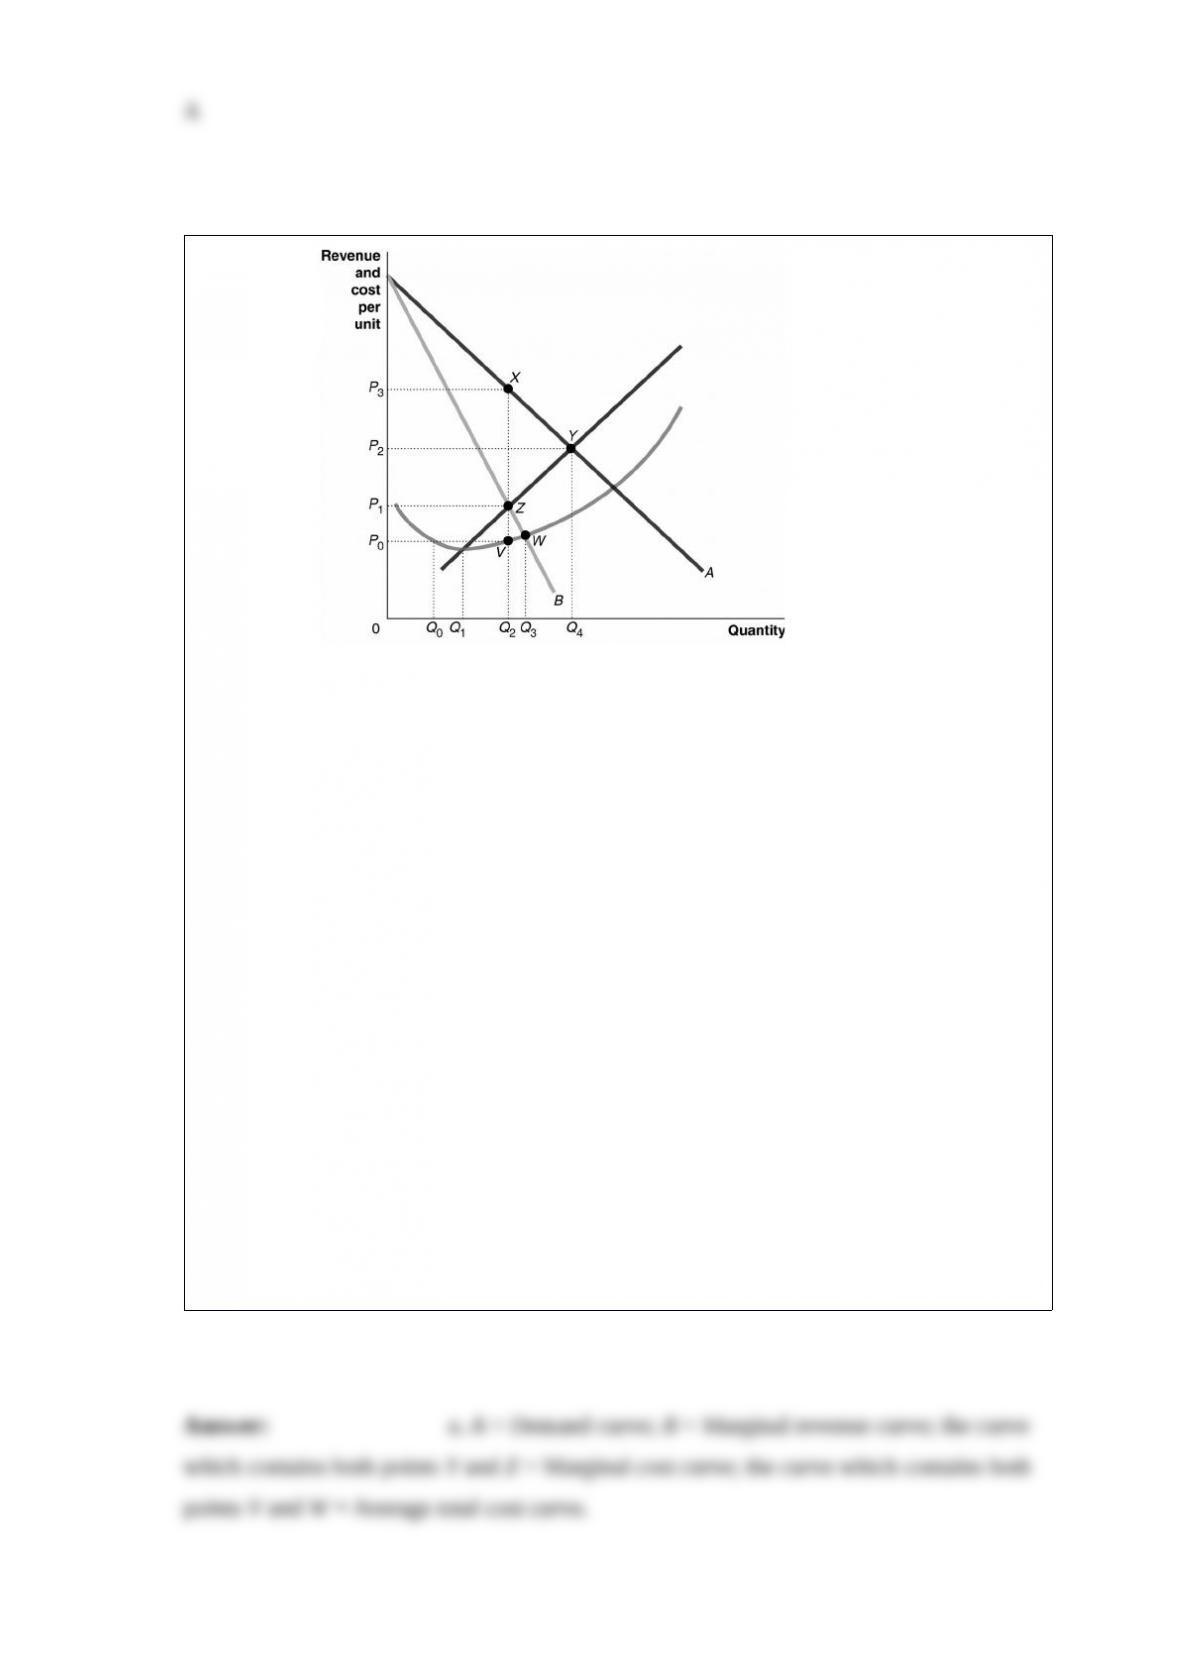
Figure 15-8 Figure 15-8 reflects the
cost and revenue structure for a monopoly that has been in business for a very long
time.
Use the figure above to answer the following questions.
a. Identify the curves labeled A and B. Identify the curve which contains both point Y
and point Z. Identify the curve which contains both point V and point W.
b. What is the profit-maximizing quantity and what price will the monopolist charge?
c. What area represents total revenue at the profit-maximizing output level?
d. What area represents total cost at the profit-maximizing output level?
e. What area represents profit?
f. What is the profit per unit (average profit) at the profit-maximizing output level?
g. If this industry was organized as a perfectly competitive industry, what would be the
profit-maximizing price and quantity?
h. What area represents the deadweight loss as a result of a monopoly?
All of the following explain why purchasing power parity does not completely explain
long-run fluctuations in exchange rates except
A) not all goods and services produced in any country are traded internationally.
B) consumer preferences for goods and services differ across countries.
C) some countries impose barriers to trade.
D) most countries have free markets with little, if any, government regulation.
According to the short-run Phillips curve, which of the following would result in low
rates of unemployment?
A) weak increases in aggregate supply
B) a lower inflation rate
C) weak increases in aggregate demand
D) a higher inflation rate
Growth in the United States from 1800 to 1900 can be characterized as
A) positive and increasing.
B) positive and flat.
C) positive and decreasing.
D) negative.
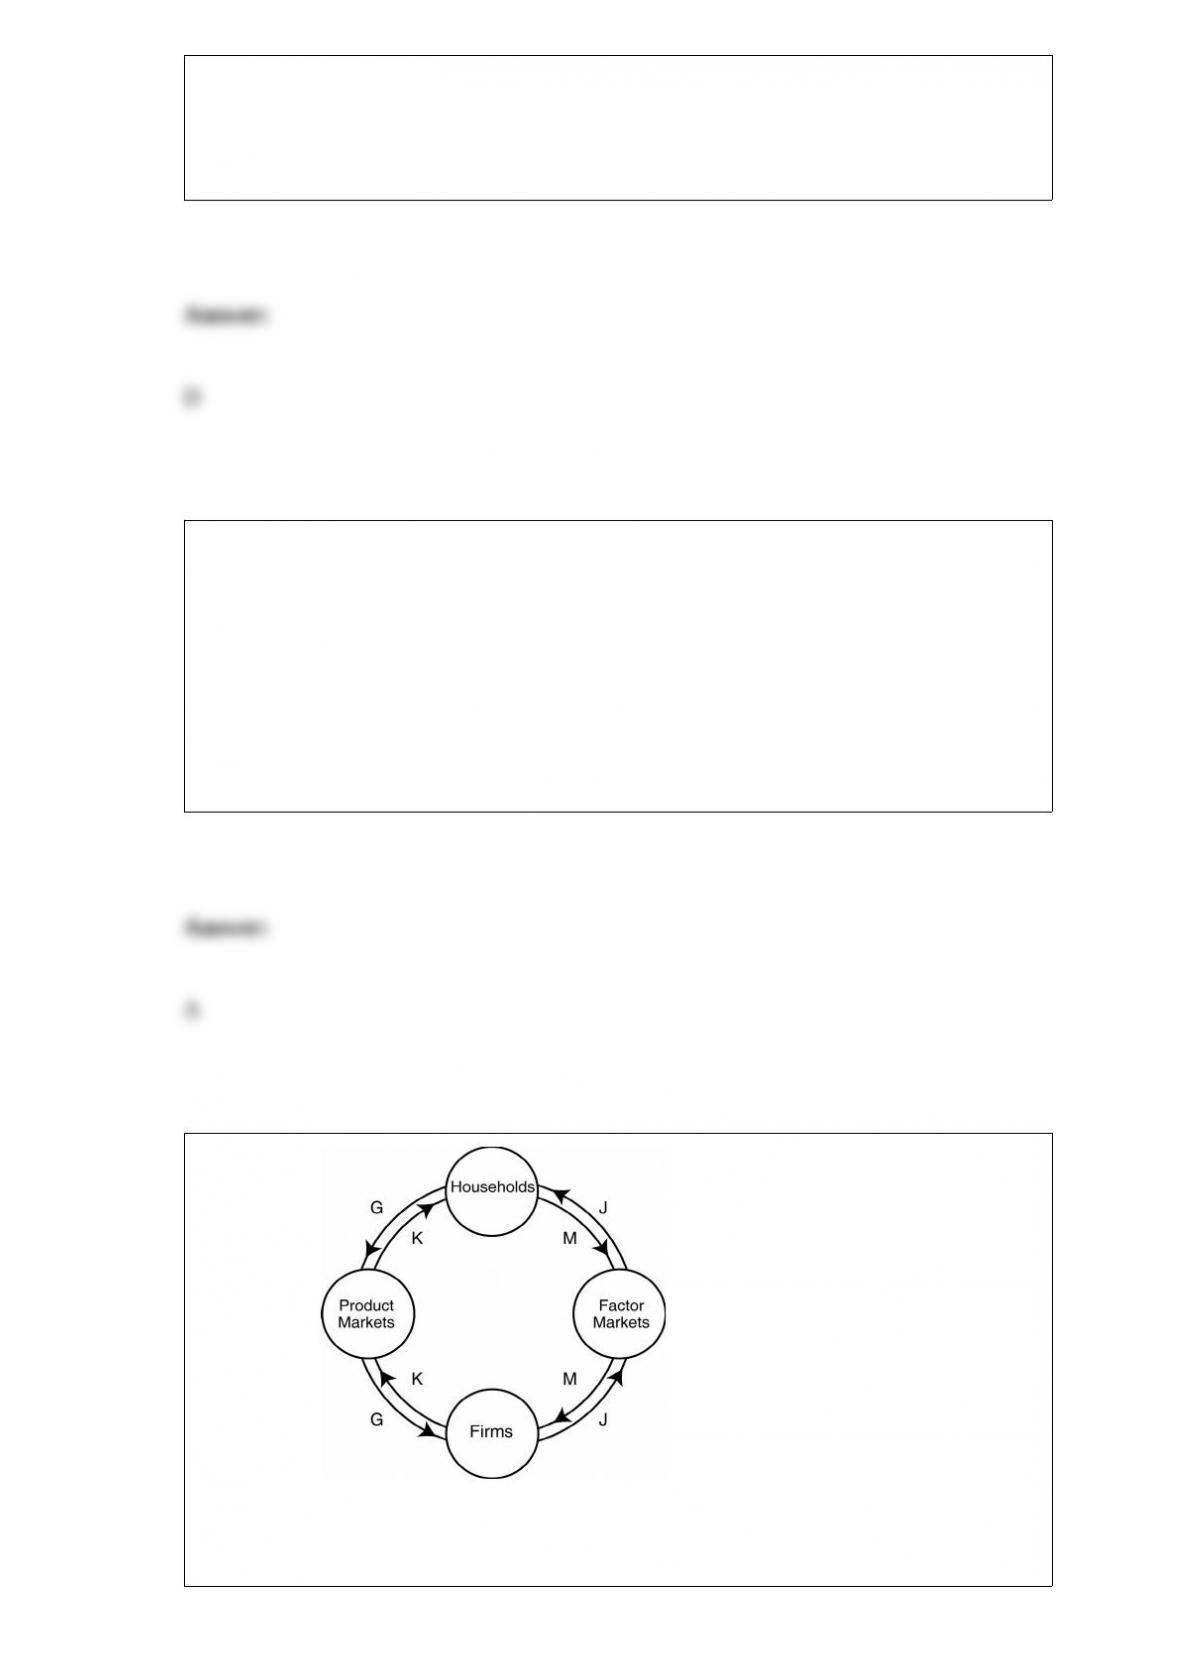
Figure 2-19
Which two arrows in the diagram depict the following transaction: Dorian Gray hires
“Wild Oscar,” a professional portrait artist, to paint his picture.
A) J and M
B) K and G
C) K and M
D) J and G
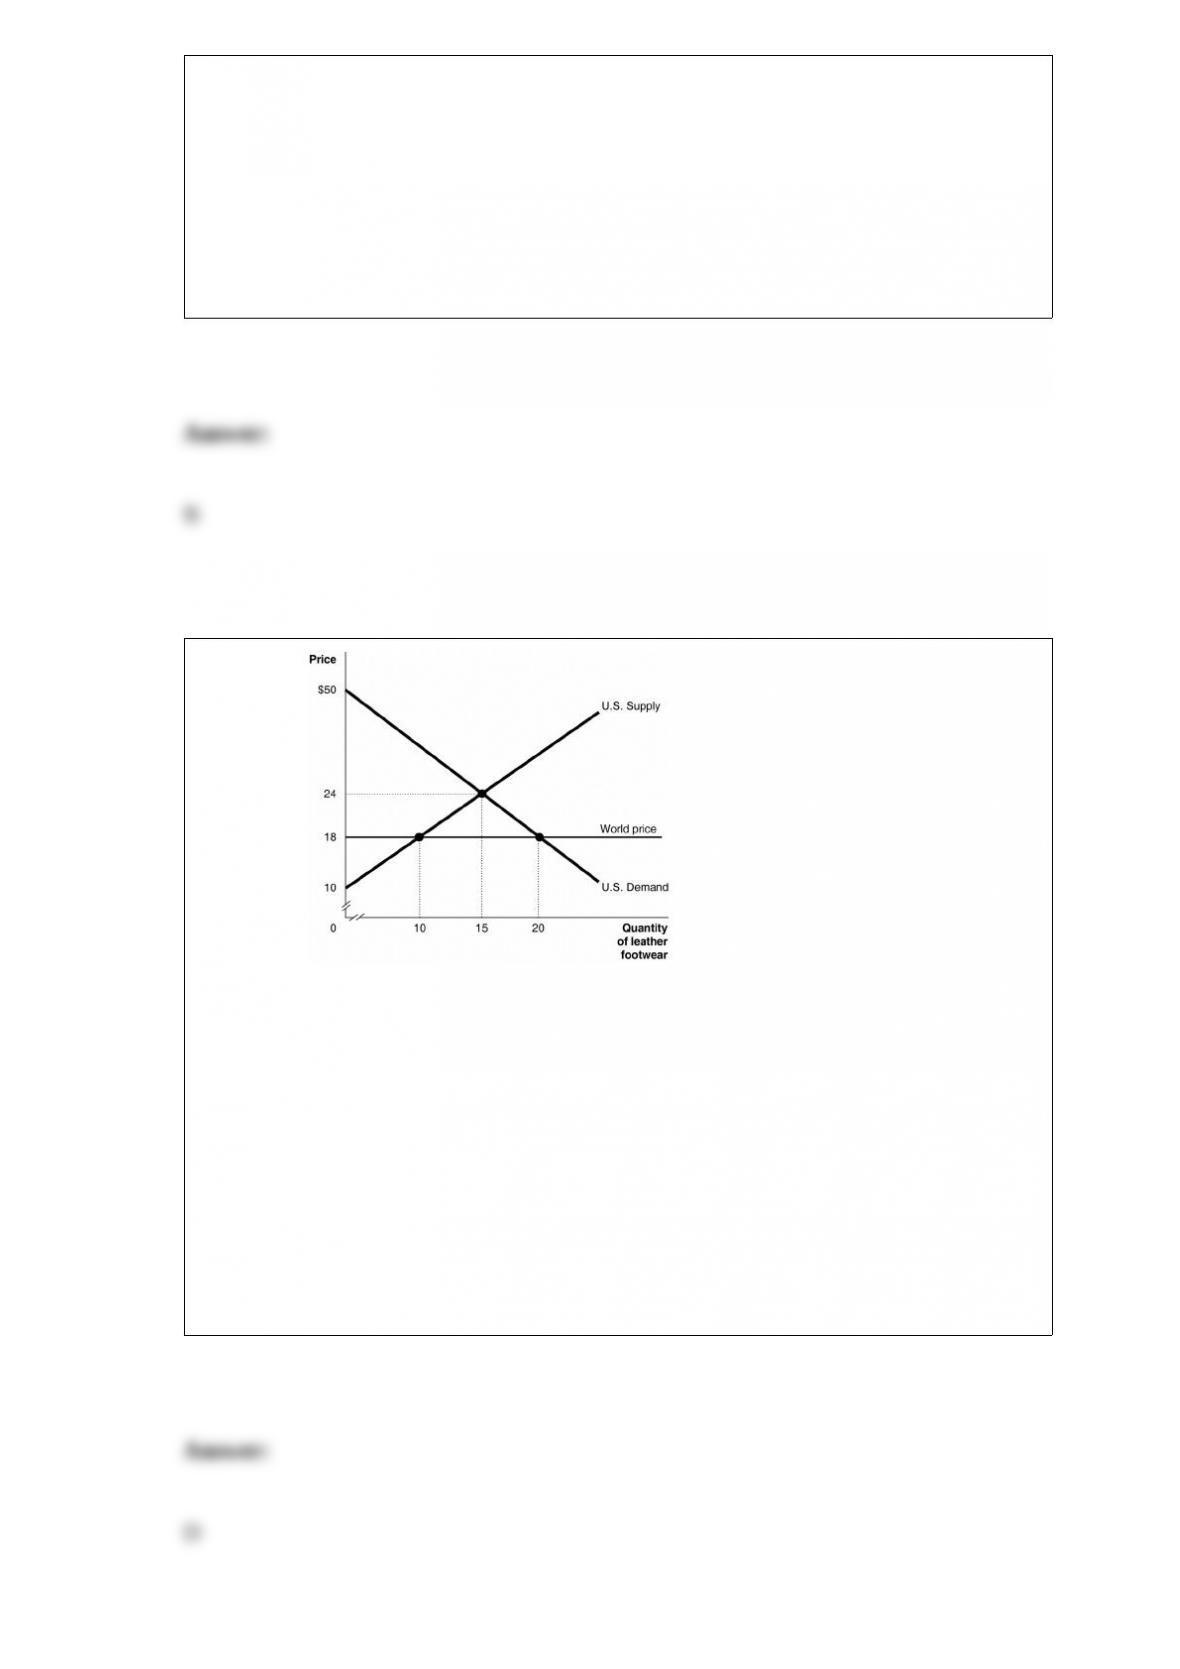
Figure 9-1 Figure 9-1 shows the U.S. demand
and supply for leather footwear.
Suppose the government allows imports of leather footwear into the United States. The
market price falls to $18. What is the value of consumer surplus?
A) $0
B) $270
C) $305
D) $320

M2 includes M1 plus
A) currency in circulation, checking account deposits in banks, and holdings of
traveler’s checks.
B) savings account balances, money market deposit accounts in banks,
small-denomination time deposits, and noninstitutional money market fund shares.
C) checking account deposits, large-denomination time deposits, and noninstitutional
money market fund shares.
D) currency in circulation, savings account balances, and small-denomination time
deposits.