1) According to monetarists:
A.changes in the money supply are the primary cause of changes in the price level.
B.an expansionary fiscal policy will lower interest rates and overstimulate the economy.
C.changes in the velocity of money are more important than changes in the money
supply in causing the level of economic activity to change.
D.the supply of money changes in response to changes in the levels of real output and
prices.
2) Suppose the demand for strawberries rises sharply, resulting in an increased price of
strawberries. As it relates to strawberry pickers, we could expect the:
A.MRP curve to shift to the right.
B.MRP curve to shift to the left.
C.MRC curve to shift downward.
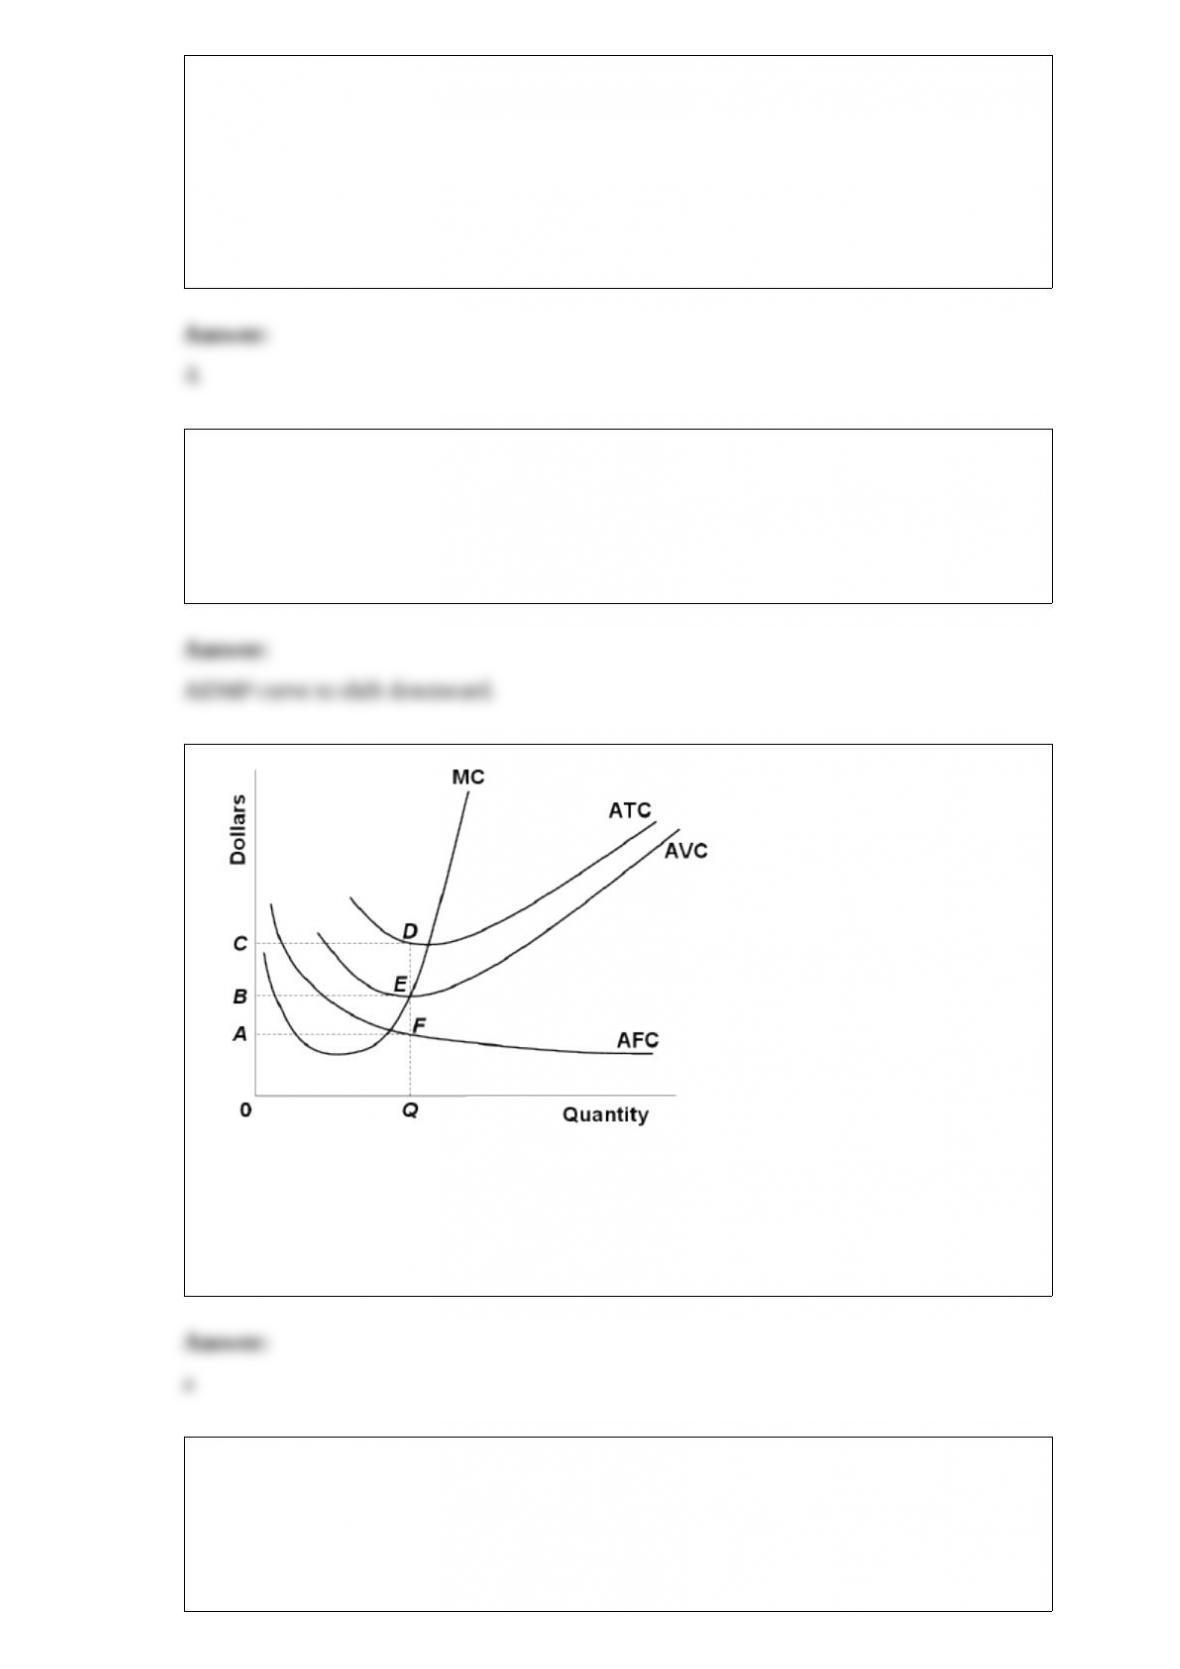
3)
refer to the above diagram. at output level q:
a.marginal product is falling.
b.marginal product is rising.
c.marginal product is negative.
d.one cannot determine whether marginal product is falling or rising.
4) a natural monopoly exists when:
a.unit costs are minimized by having one firm produce an industry’s entire output.
b.several formerly competing producers merge to become the only firm in an industry.
c.short-run average total cost curves are tangent to long-run average total cost curves.
d.minimum efficient scale is attained at a small level of output.

5) if a regulatory commission forces a natural monopoly to charge a price equal to its
average total cost:
a.output will decrease.
b.the monopolist will realize a normal profit.
c.resource allocation will worsen.
d.the firm will earn an economic profit.
6) if you receive a gift whose market price is $20, but you consider it to be worth only
$10, then:
a.there is a $10 or 50 percent value gain.
b.there may or may not be a value loss.
c.there is a $10 or 50 percent value loss.
d.you can be relatively certain the giver was a sibling or other close relative.
7) all else equal, u.s. exports to germany create a:
a.demand for german marks.
b.supply of german marks.
c.supply of american dollars.
d.shortage of german marks.
8) (Last Word) In 2005, the countries with the highest scores on the Environmental
Performance Index were:
A.U.S. and Tanzania.
B.Sweden and New Zealand.
C.Russia and Canada.
D.Brazil and Australia.
9) The following production possibilities data for two countries, Alpha and Beta, which
have populations of equal size.
Refer to the above data. Suppose that before specialization and trade Alpha chose
production alternative C and Beta chose production alternative B. After specialization
and trade the gains will be:
A.20 tons of fish.
B.20 tons of chips.
C.20 tons of fish and 20 tons of chips.
D.240 tons of fish and 20 tons of chips.
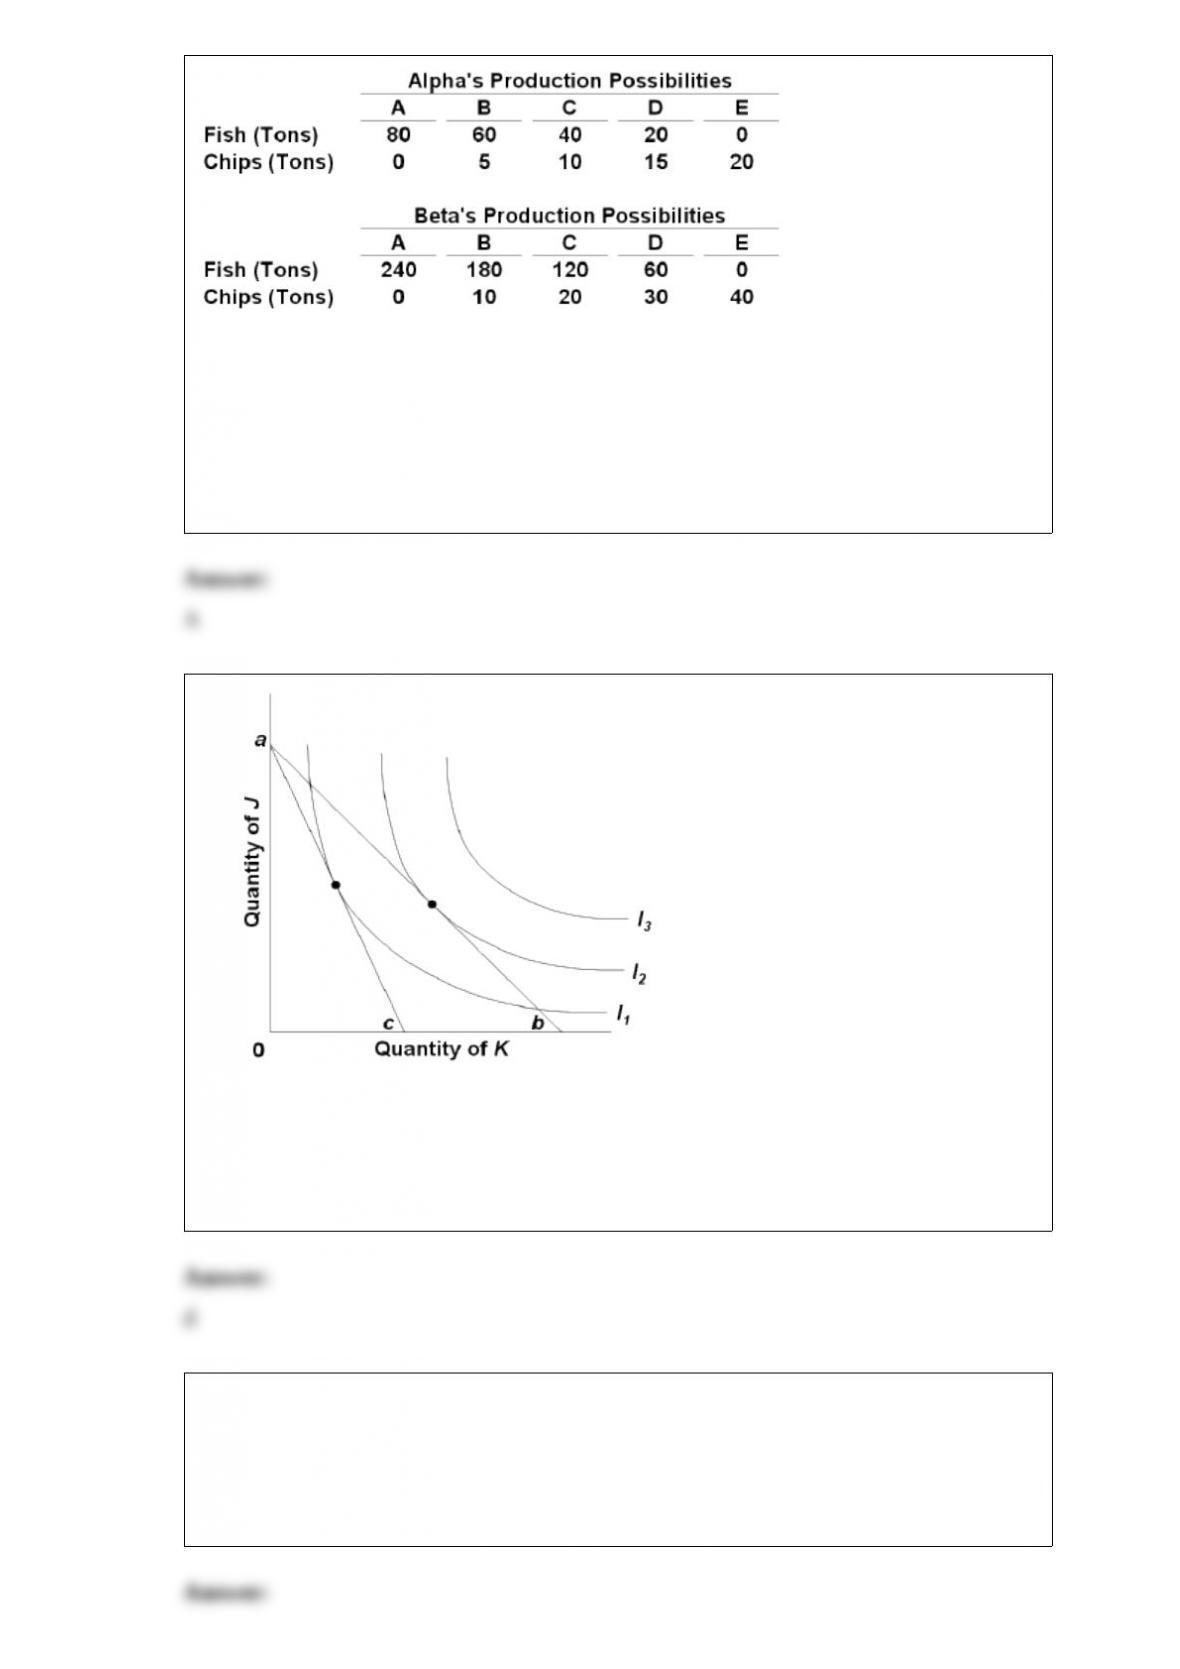
10)
refer to the above diagram. if the budget line shifts from ab to ac the:
a.consumer’s level of total utility will increase.
b.consumer will purchase more of both j and k
c.consumer will purchase less of both j and k
d.consumer will purchase more of j and less of k
11) if the price of product y is $25 and its marginal cost is $18:
a.y is being produced with the least-cost combination of resources.
b.society will realize a net gain if less of y is produced.
c.resources are being underallocated to y.
d.resources are being overallocated to y.
12) the supply curve of a one-of-a-kind original painting is:
a.relatively elastic.
b.relatively inelastic.
c.perfectly inelastic.
d.perfectly elastic.
13) the basic formula for the price elasticity of demand coefficient is:
a.absolute decline in quantity demanded/absolute increase in price.
b.percentage change in quantity demanded/percentage change in price.
c.absolute decline in price/absolute increase in quantity demanded.
d.percentage change in price/percentage change in quantity demanded.
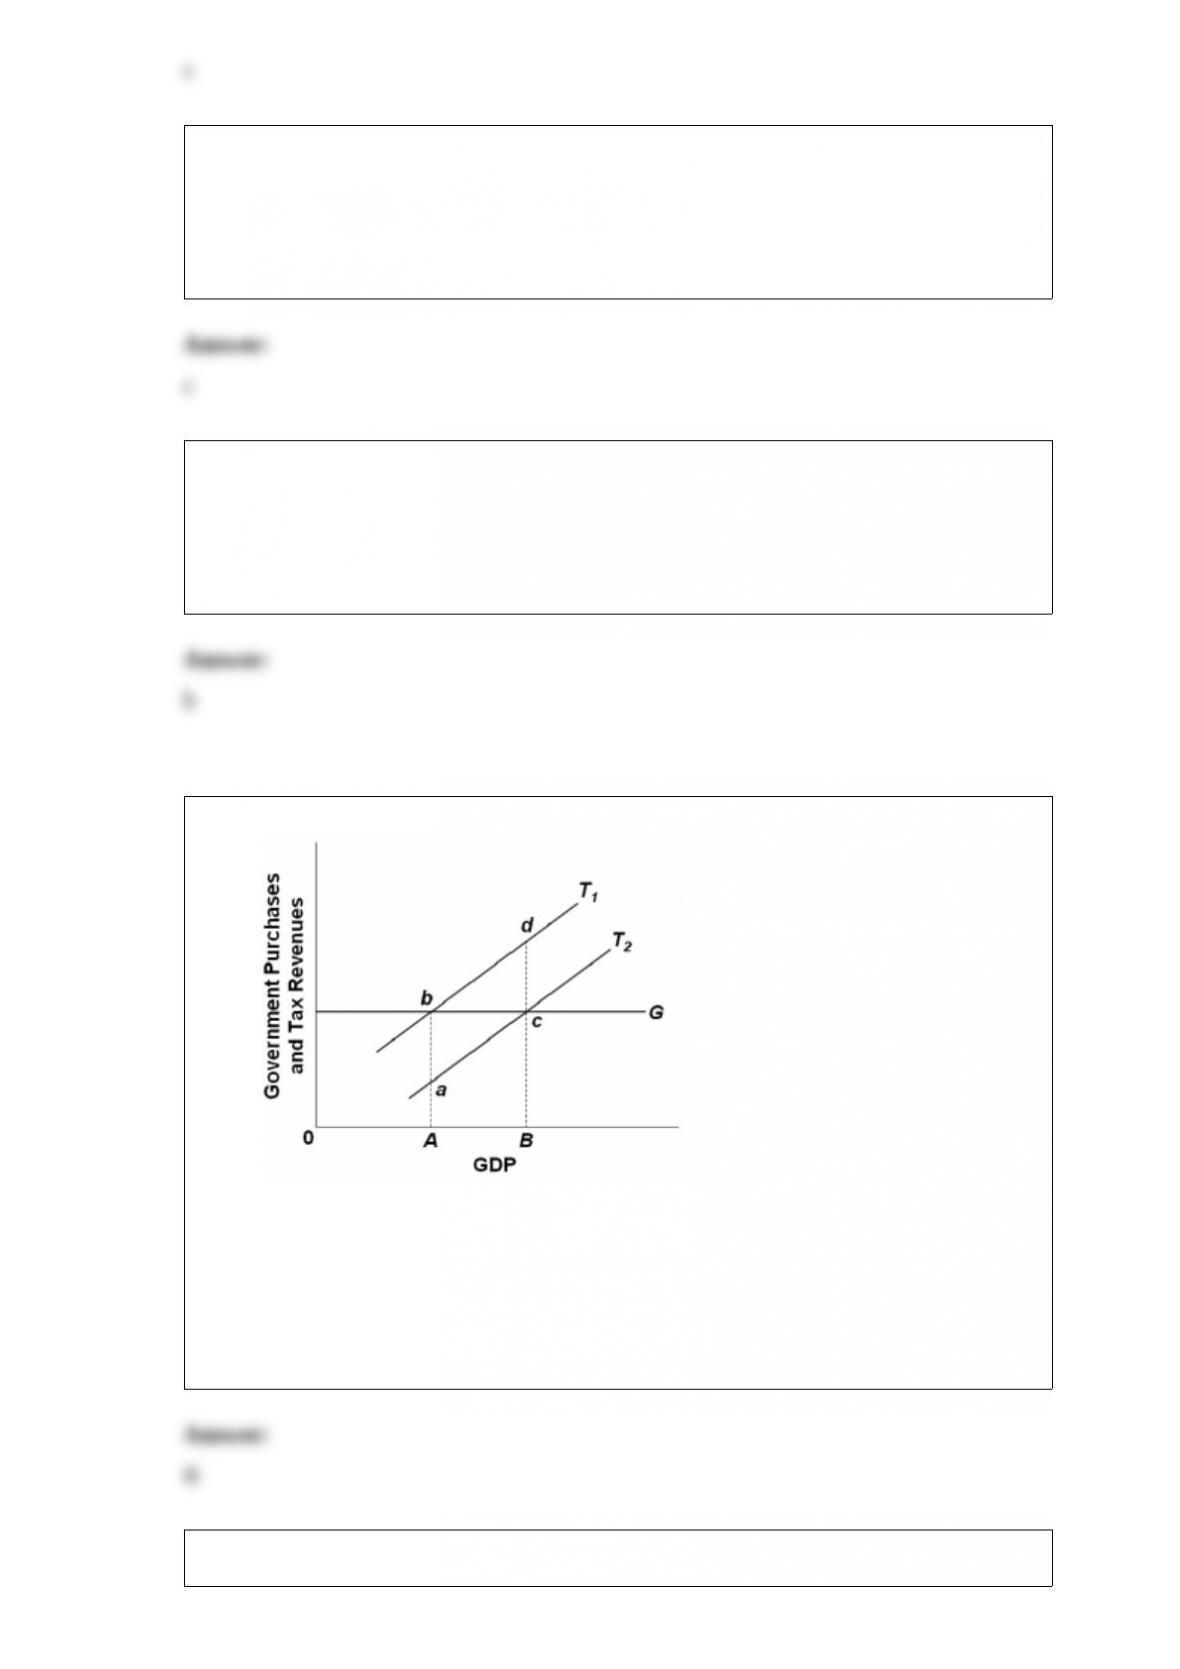
14)
Refer to the above diagram. Discretionary fiscal policy designed to slow the economy is
illustrated by:
A.the shift of curve T1 to T2.
B.the shift of curve T2 to T1.
C.a movement from a to c along curve T2.
D.a movement from d to b along curve T1.
15) Unless people can benefit from conservation, there is a temptation to:

A.delay resource extraction as long as possible.
B.extract and use resources at a constant rate.
C.extract and use resources as quickly as possible.
D.ban the extraction of non-renewable resources.
16) the following production possibilities data for landia and scandia:
refer to the above data. assume that before specialization and trade landia was
producing combination c and scandia was producing combination b. if these two
nations now specialize completely based on with comparative advantage, the total gains
from specialization and trade would be:
a.8 fish and 2 chips.
b.10 fish and 4 chips.
c.0 fish and 8 chips.
d.4 fish and 6 chips.
17) Which of the following would likely reduce income inequality?
A.a reduction in the number of high school dropouts.
B.a reduction in social security benefits.
C.greater inequality in the distribution of wealth.
D.more stringent requirements to obtain occupational licenses.

18)
refer to the above diagram. curve c
a.reflects increasing opportunity costs because the slope of the curve becomes less steep
as one moves down along the curve.
b.is a less desirable production possibilities curve for an economy than curve b.
c.is a more desirable production possibilities curve for an economy than curve a.
d.has a steeper slope throughout than curve b.