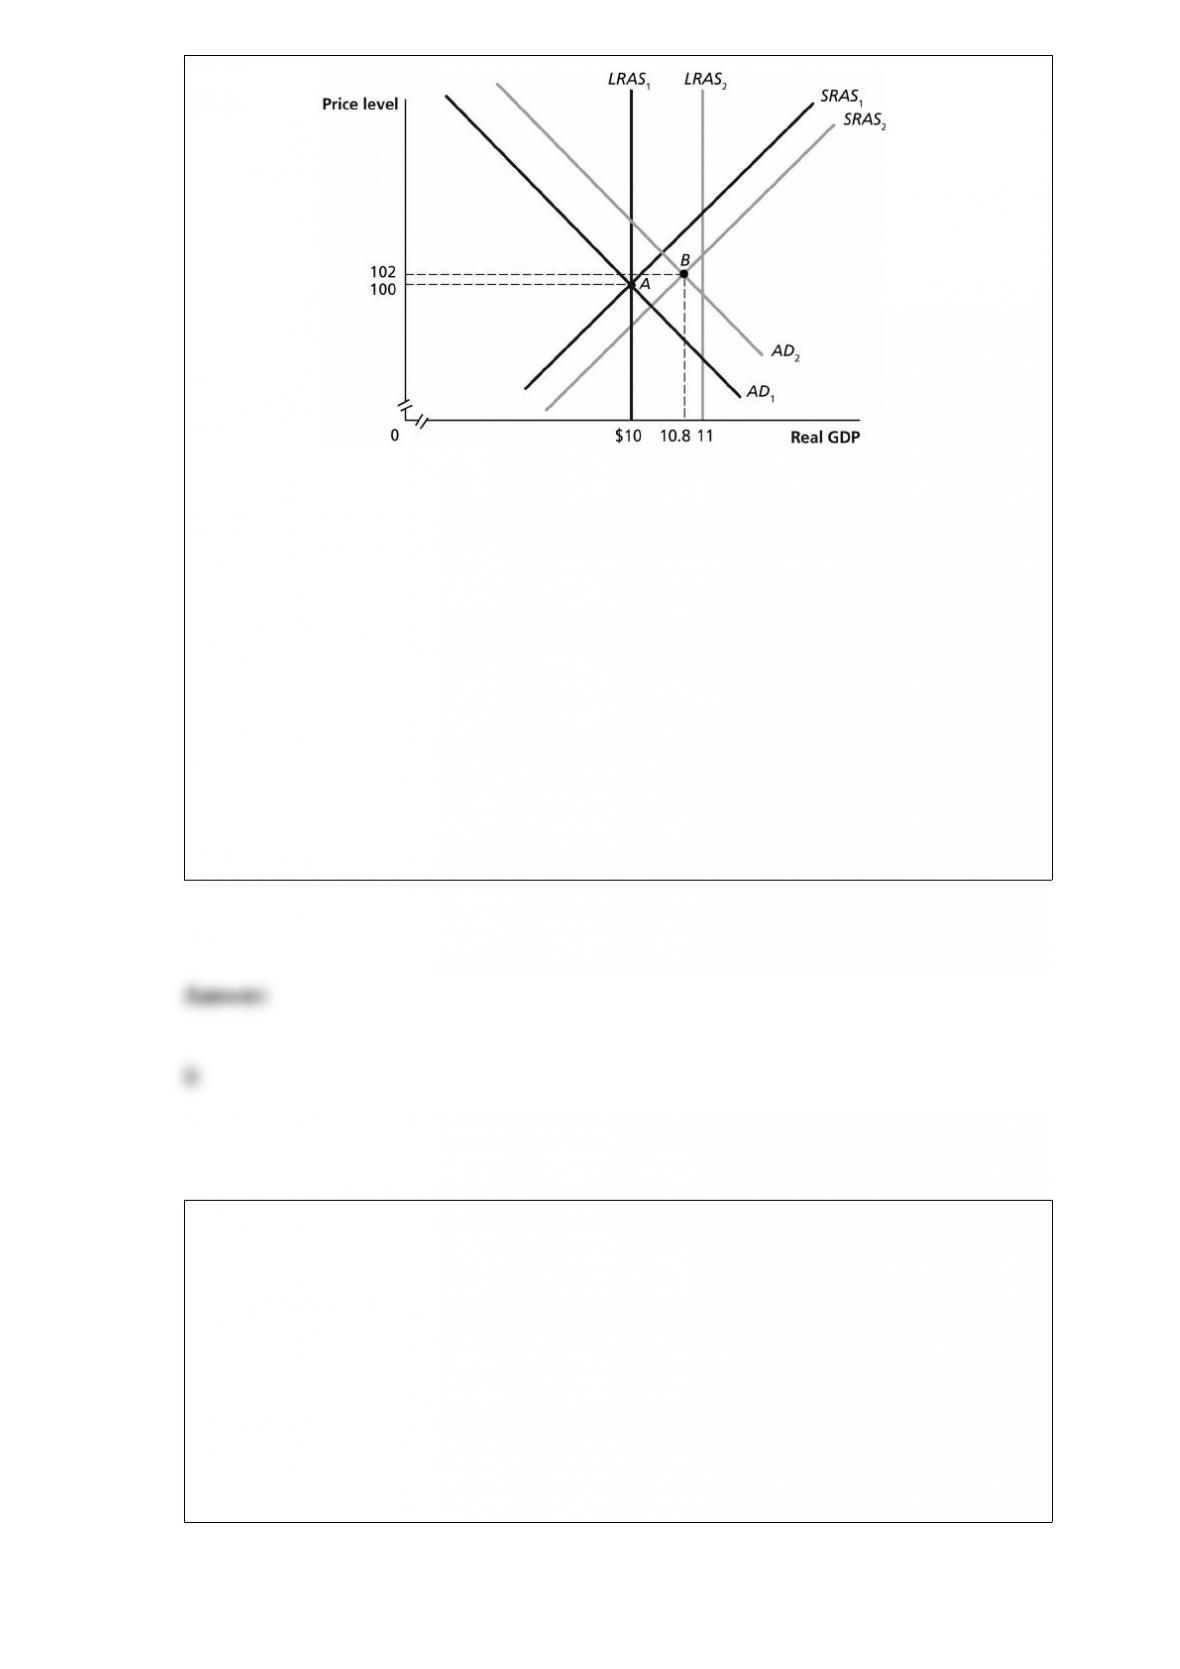
Figure 16-5
In the dynamic model of AD–AS in the figure above, if the economy is at point A in year
1 and is expected to go to point B in year 2, and no fiscal or monetary policy is pursued,
then at point B
A) the unemployment rate is very low.
B) firms are operating below capacity.
C) the economy is above full employment.
D) income and profits are rising.
E) there is pressure on wages and prices to rise.
In Thailand in the late 1990s, there was pressure for the value of the baht to decline as
foreign investors began to
A) sell off investments they had made in Thailand and traded in their baht for dollars.
B) sell off investments they had made in Thailand and traded in their dollars for baht.
C) increase their investments in Thailand and exchanged their baht for dollars.
D) increase their investments in Thailand and exchanged their dollars for baht.

To calculate the price elasticity of supply we divide
A) the percentage change in price by the percentage change in quantity supplied.
B) the percentage change in quantity supplied by the percentage change in price.
C) rise by the run.
D) the average price by the average quantity supplied.
In calculating gross domestic product, the Bureau of Economic Analysis uses the sum
of the market value of final goods and services produced. This means that the BEA
A) simply counts the total number of goods produced in the market place and then adds
them up.
B) values goods at their market prices, multiplies them by the quantity produced, and
then adds them up.
C) simply counts the total number of goods and services produced in the marketplace
and then adds them up.
D) values goods and services at their market prices, multiplies them by the quantity
produced, and then adds them up.

When unemployment is above its natural rate, the inflation rate will eventually
A) increase.
B) decrease.
C) move to its natural rate.
D) become equal to the natural rate of unemployment.
Suppose a negative technological change in the production of disease-resistant wheat
caused the price of wheat to rise. Holding everything else constant, how would this
affect the market for corn (a substitute for wheat)?
A) The supply of corn would decrease and the equilibrium price of corn would increase.
B) The demand for corn would increase and the equilibrium price of corn would
increase.
C) The demand for corn would decrease because consumers could afford to buy less
wheat and corn.
D) The demand for corn would increase and the equilibrium price of corn would
decrease.
Increases in the price level will
A) lower consumption because goods and services are less affordable.
B) raise consumption because some goods and services are more affordable.

C) raise consumption because real wealth increases.
D) lower consumption because real wealth decreases.
Based on the following information, what is the balance on the current account?
Exports of goods and services = $12 billion
Imports of goods and services = $14 billion
Net income on investments = -$4 billion
Net transfers = -$1 billion
Increase in foreign holdings of assets in the United States = $6 billion
Increase in U.S. holdings of assets in foreign countries = -$3 billion A) -$7 billion
B) -$3 billion
C) -$2 billion
D) $1 billion
Consider the following statements:
a. Soda drinkers purchase more soda from a grocery store that sells soda at a lower
price than other rival grocery stores in the area.
b. Homeowners do not take steps to increase security even though they believe it is
more costly to allow burglaries than to install security monitoring equipment.
c. Manufacturers produce less of a particular cell phone when its selling price rises.
Which of the above statements demonstrates that economic agents respond to
incentives?
A) a only.
B) b only.
C) c only.
D) a and b.
E) a, b, and c.
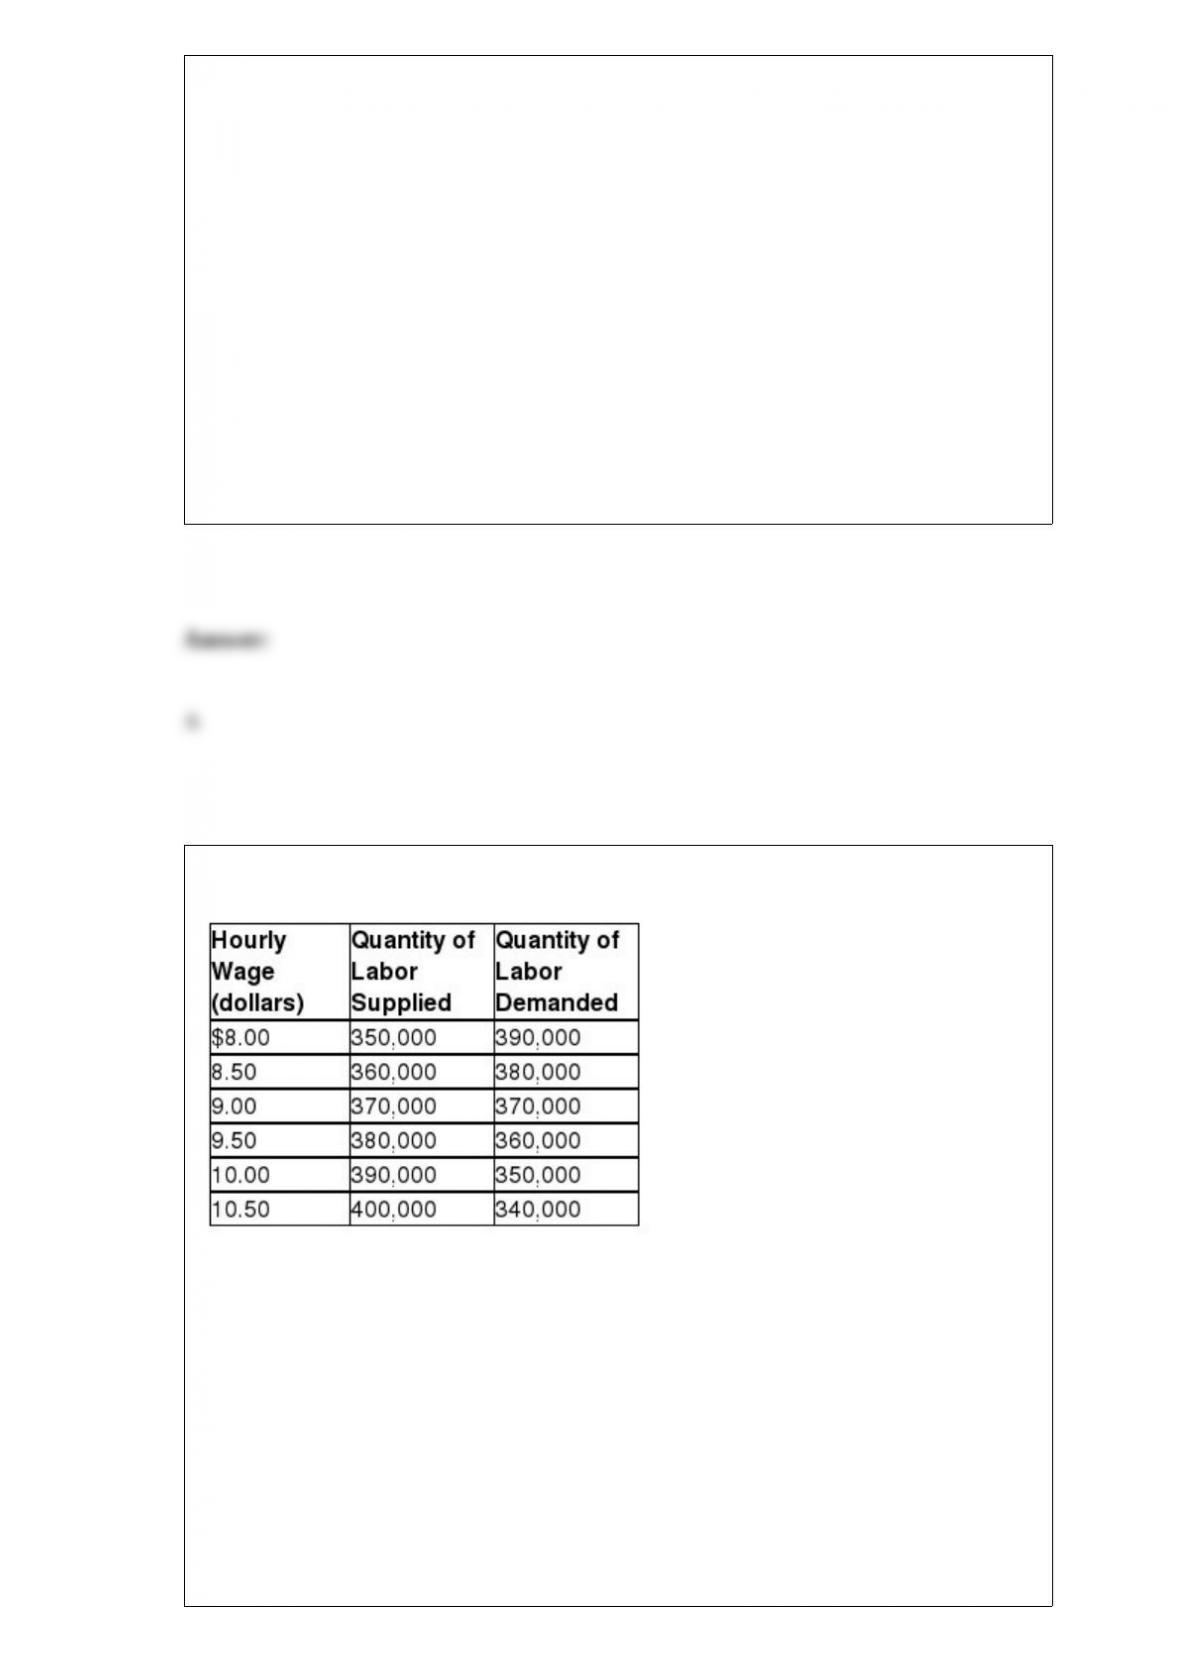
Table 4-4
Table 4-4 shows the demand and supply schedules for the low-skilled labor market in
the city of Westover.
If a minimum wage of $10.00 an hour is mandated, what is the quantity of labor
demanded?
A) 390,000
B) 370,000
C) 350,000

D) 40,000