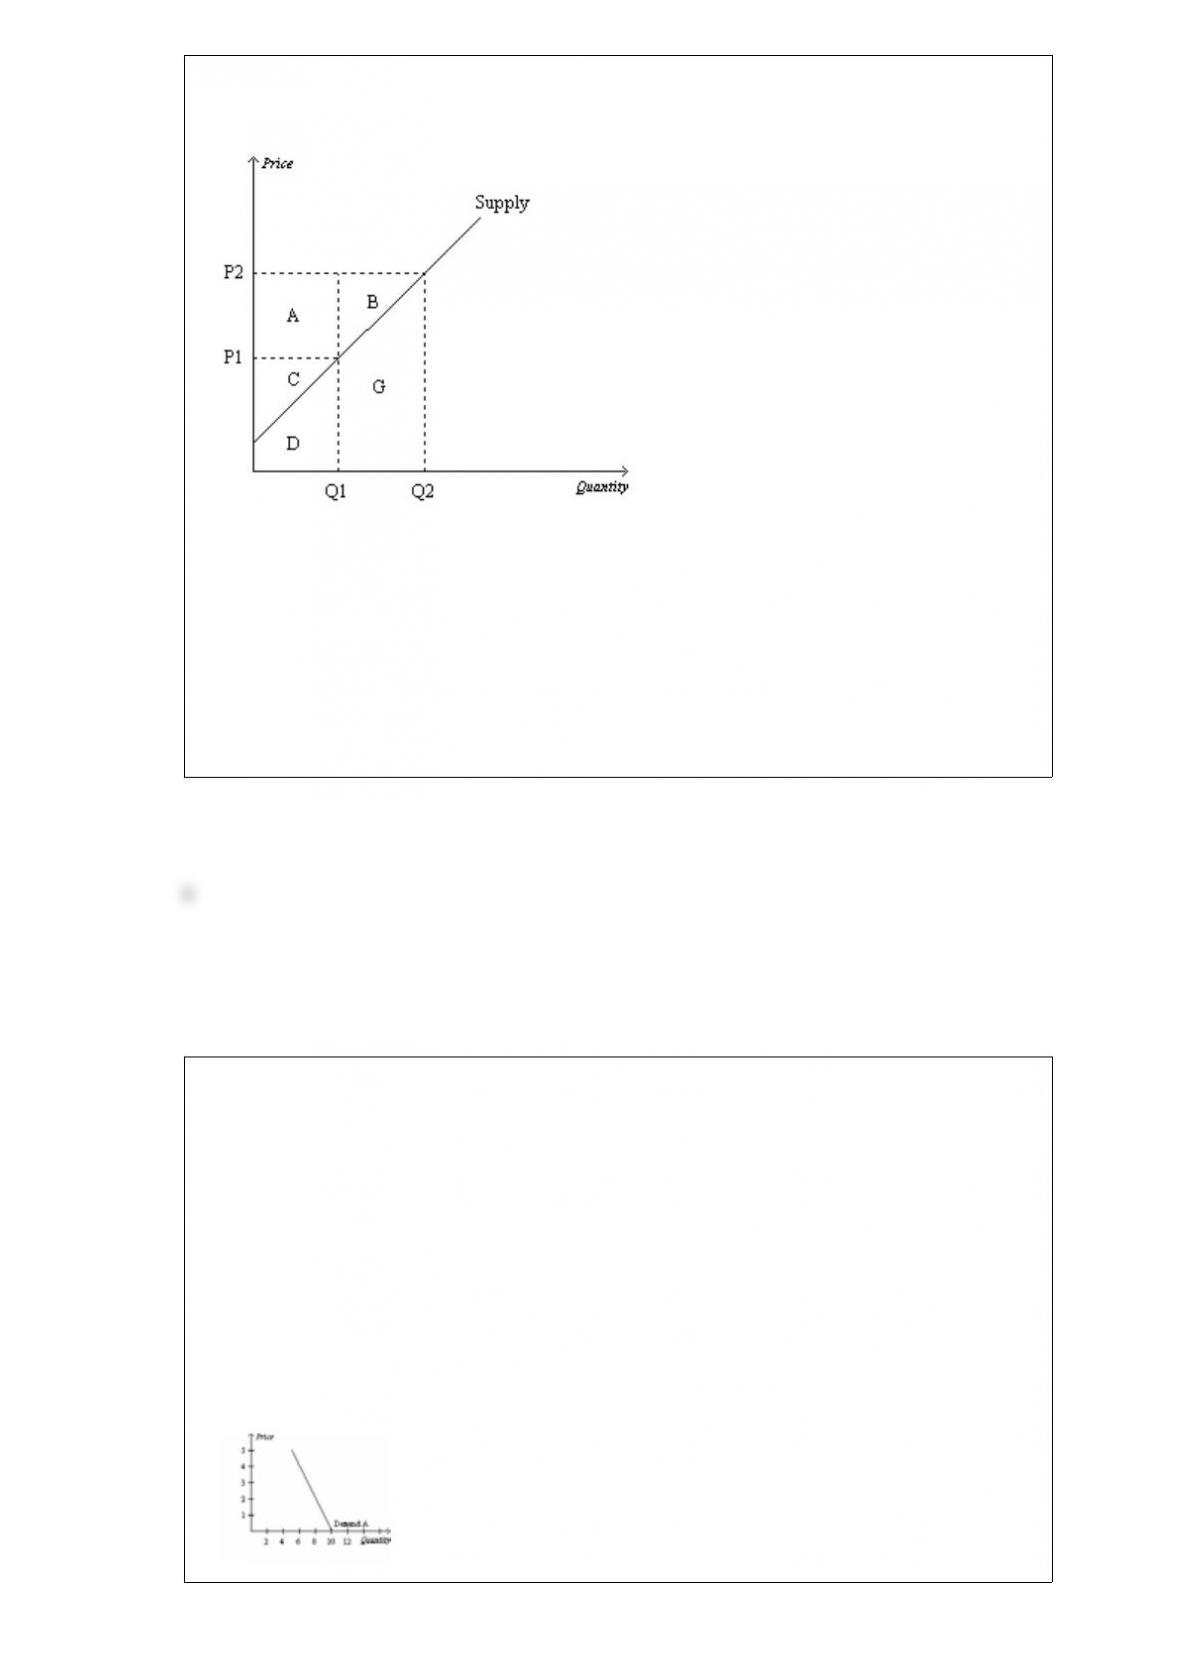
Figure 715
Refer to Figure 715. Area B represents
a. the combined profits of all producers when the price is P2.
b. the increase in producer surplus to all producers as the result of an increase in the
price from P1 to P2.
c. producer surplus to new producers entering the market as the result of an increase in
the price from P1 to P2.
d. that portion of the increase in producer surplus that is offset by a loss in consumer
surplus when the price increases from P1 to P2.
Table 41
PriceQuantity Demanded
by MichelleQuantity Demanded
by LauraQuantity Demanded
by Hillary
$55411
$46613
$37815
$281017
$191219
$0101421
Refer to Table 41. Which of the following illustrates the market demand curve?
a.
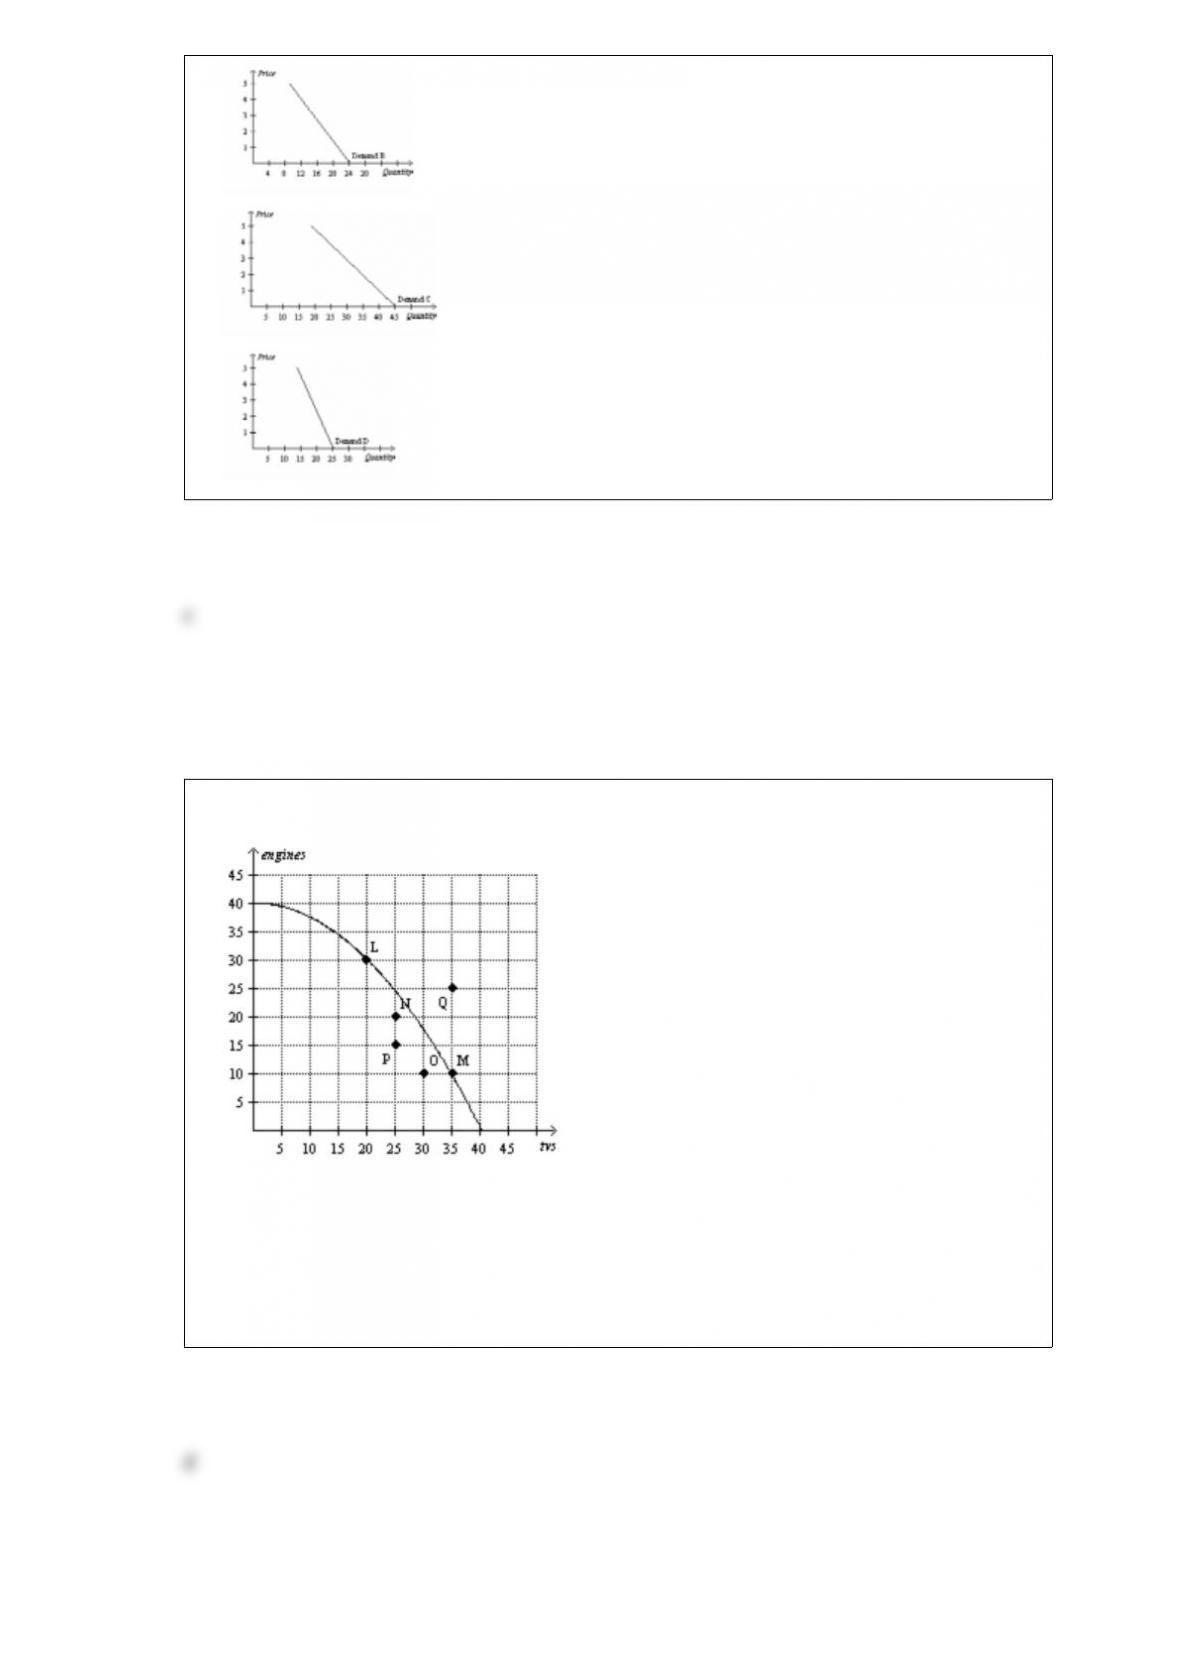
b.
c.
d.
Figure 27
Refer to Figure 27. What is the opportunity cost of moving from point L to point M?
a. zero
b. 15 tvs
c. 20 engines and 15 tvs
d. 20 engines
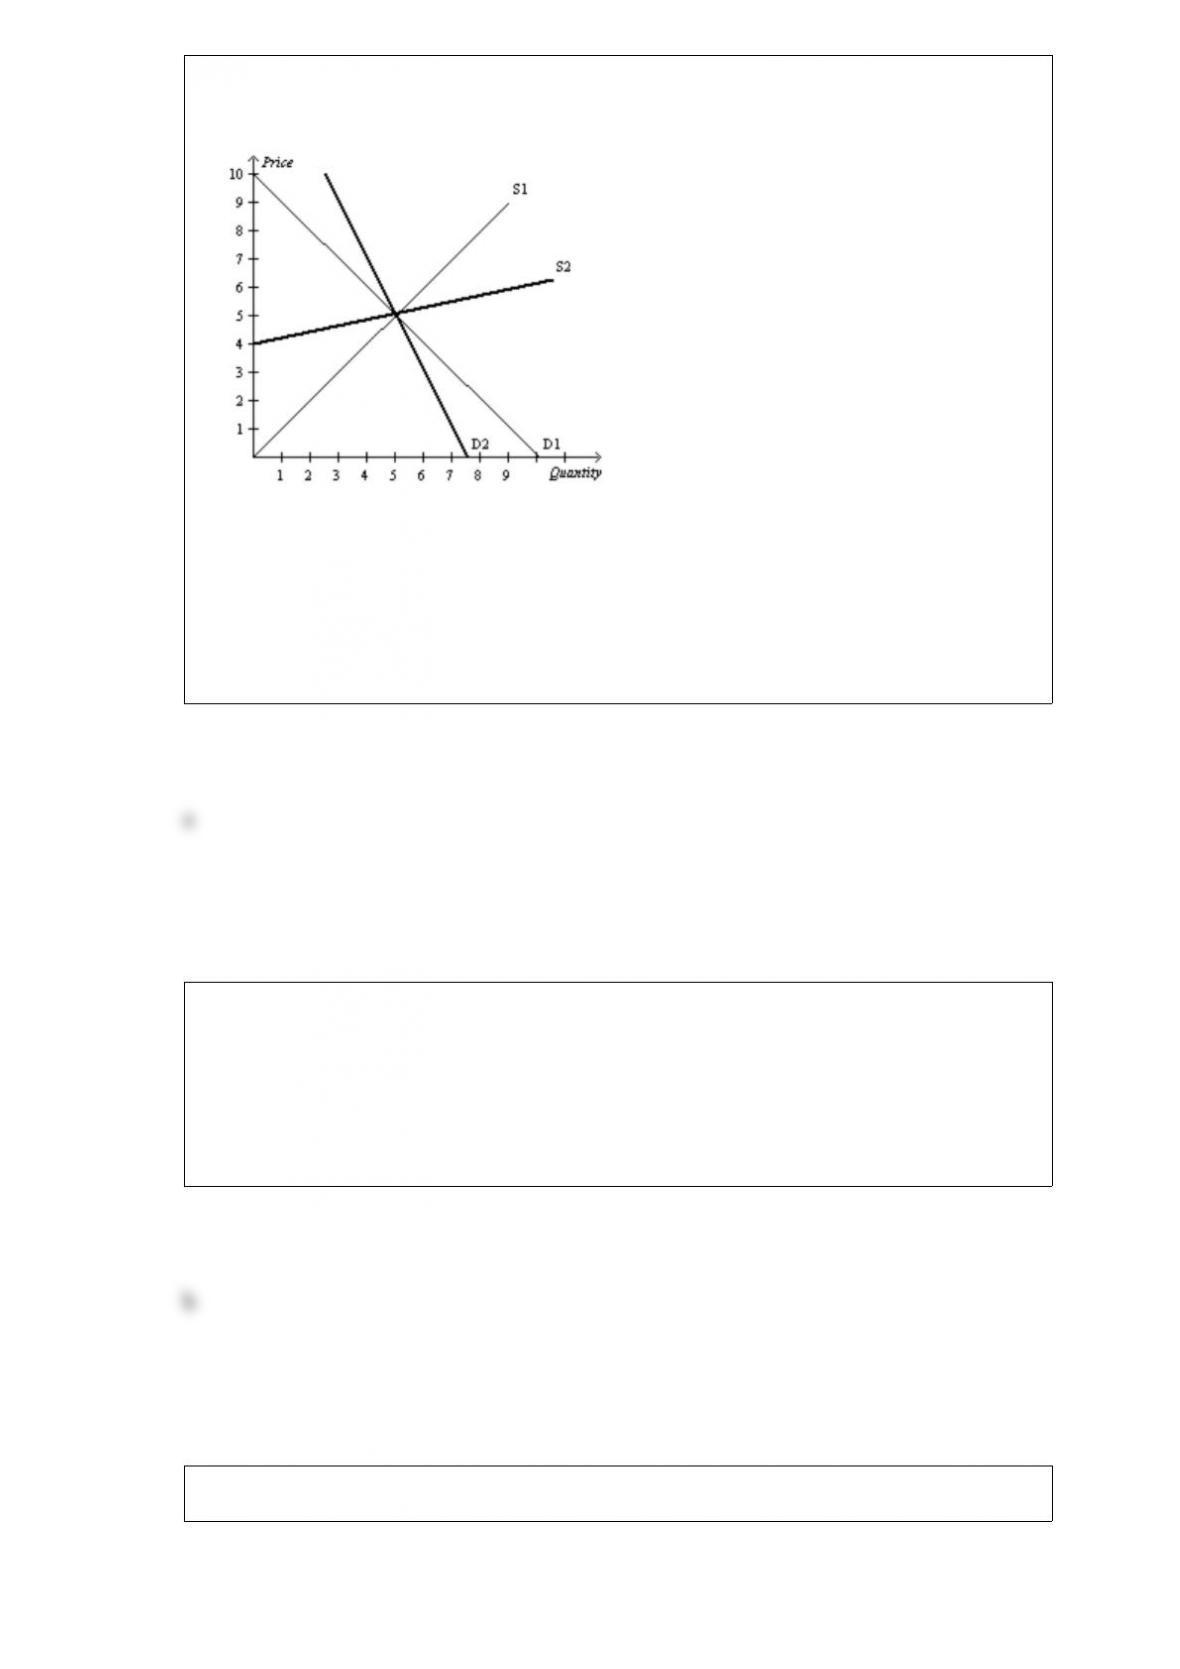
Figure 629
Suppose the government imposes a $2 on this market.
Refer to Figure 629. The buyers and sellers will bear an equal share of the tax burden
if the demand is
a. D1, and the supply is S1.
b. D2, and the supply is S1.
c. D1, and the supply is S2.
d. D2, and the supply is S2.
If the price elasticity of supply is 1.2, and price increased by 5%, quantity supplied
would
a. increase by 4.2%.
b. increase by 6%.
c. decrease by 4.2%.
d. decrease by 6%.
Figure 712
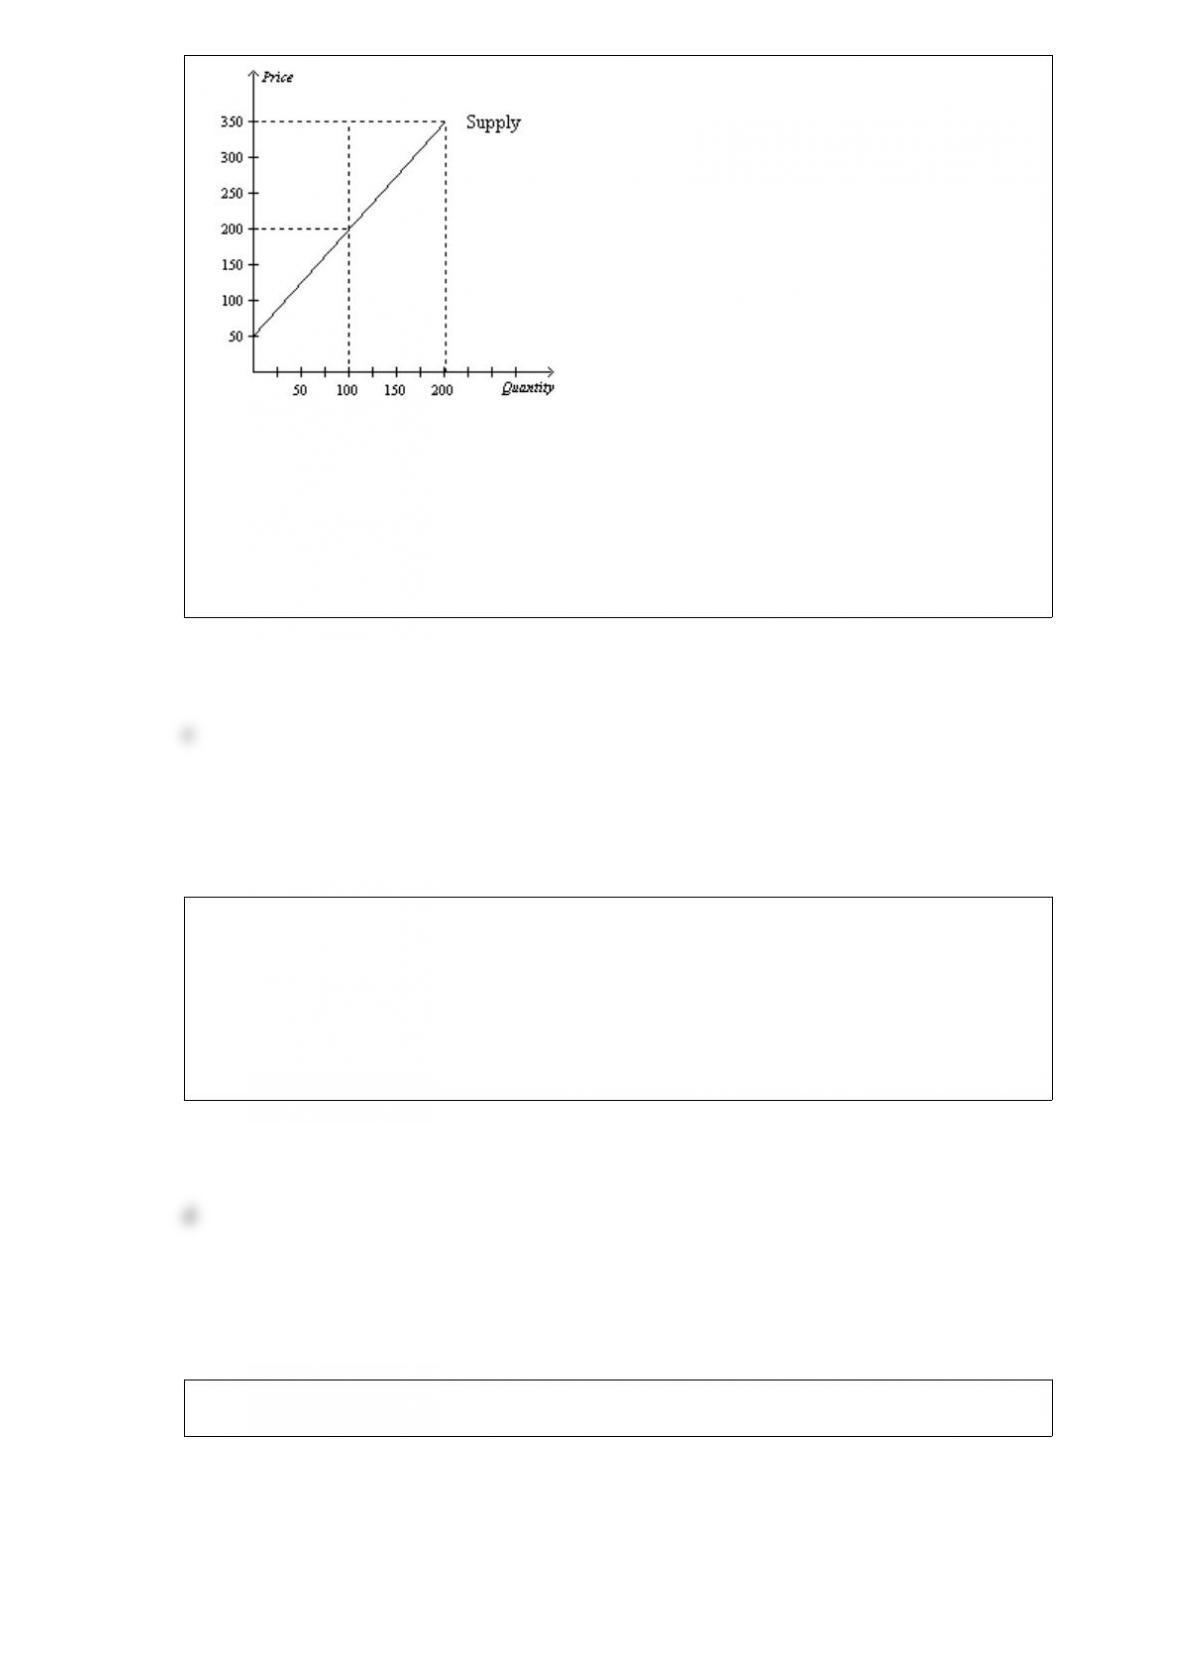
Refer to Figure 712. If the equilibrium price rises from $200 to $350, what is the
producer surplus to new producers?
a. $15,000
b. $3,750
c. $7,500
d. $30,000
The two loops in the circularflow diagram represent
a. the flow of goods and the flow of services.
b. the flow of dollars and the flow of financial assets.
c. the flow of inputs into production processes and the flow of outputs from production
processes.
d. the flows of inputs and outputs and the flow of dollars.
Figure 714
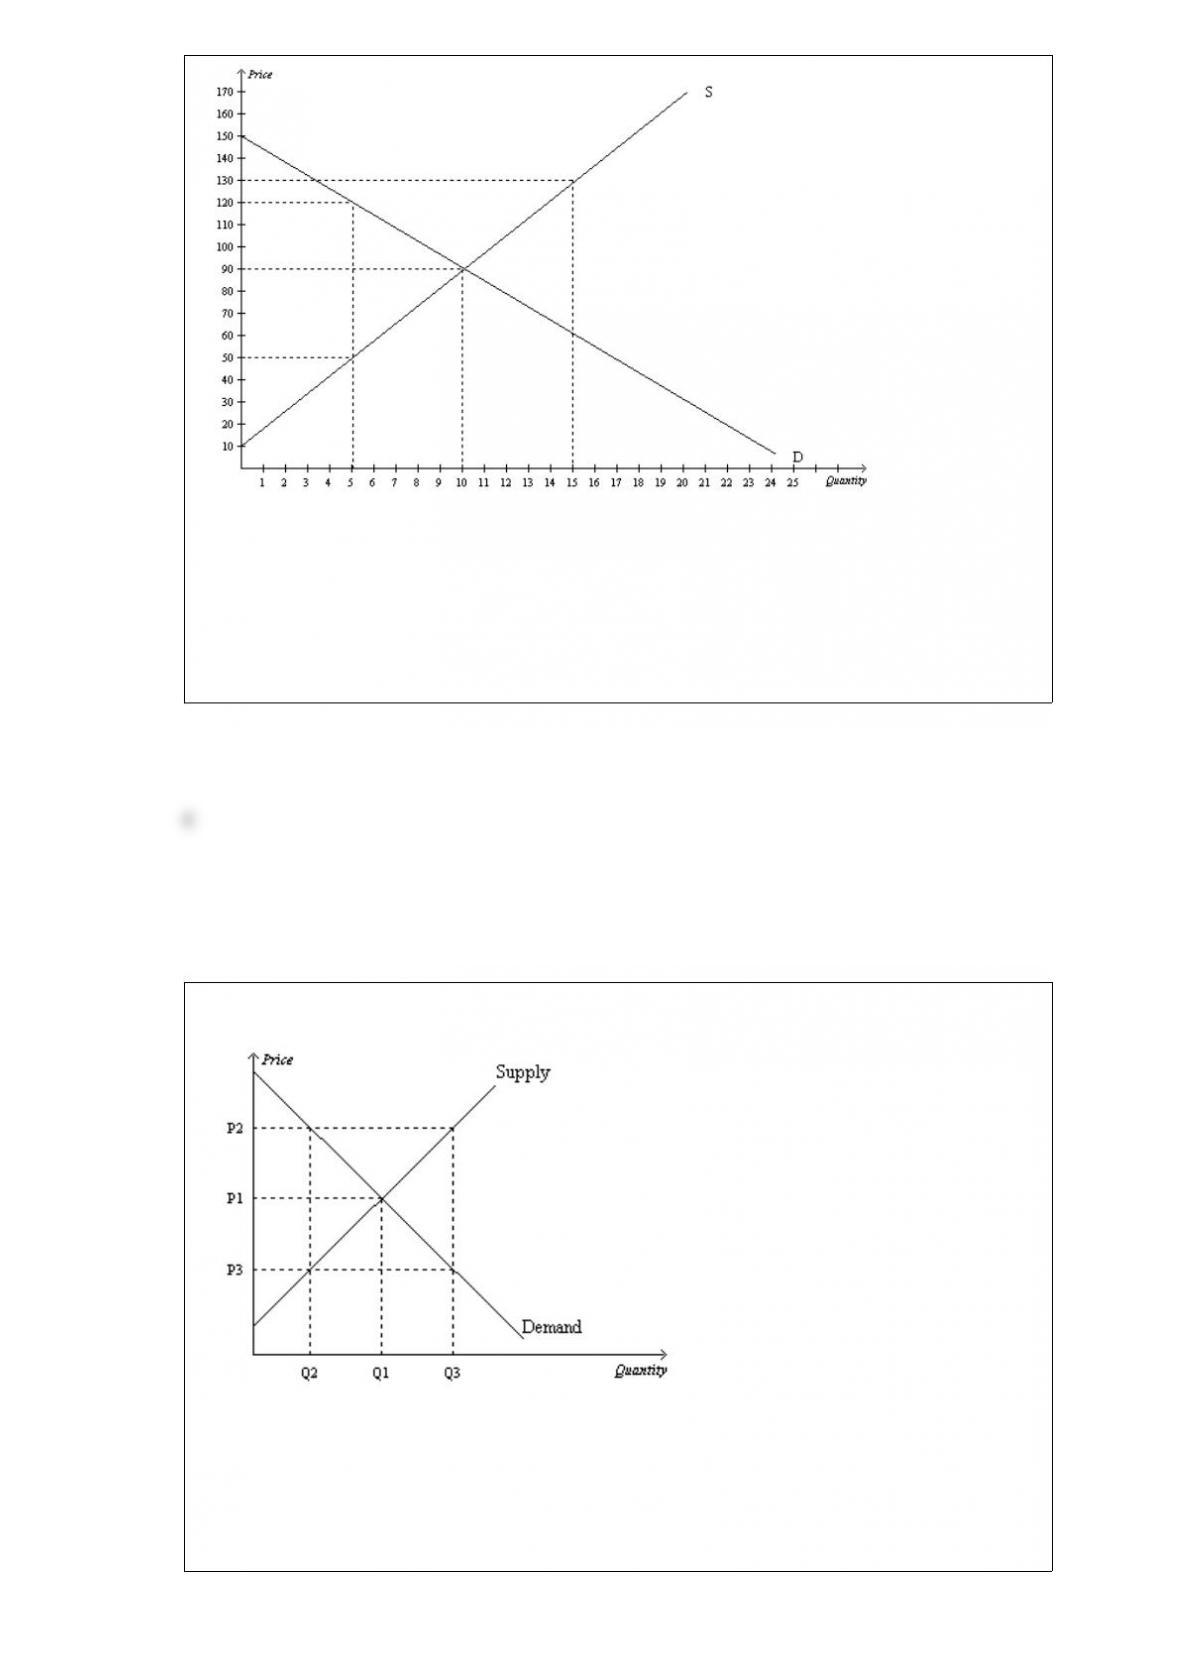
Refer to Figure 714. If the government imposes a price ceiling of $50 in this market,
then producer surplus will decrease by
a. $325.
b. $100.
c. $300.
d. $200.
Figure 728
Refer to Figure 728. At the quantity Q3,
a. the market is in equilibrium.
b. consumer surplus is maximized.
c. the sum of consumer surplus and producer surplus is maximized.
d. the marginal value to buyers is less than the marginal cost to sellers.
A tradeoff exists between a clean environment and a higher level of income in that
a. studies show that individuals with higher levels of income pollute less than
lowincome individuals.
b. efforts to reduce pollution typically are not completely successful.
c. laws that reduce pollution raise costs of production and reduce incomes.
d. employing individuals to clean up pollution causes increases in employment and
income.
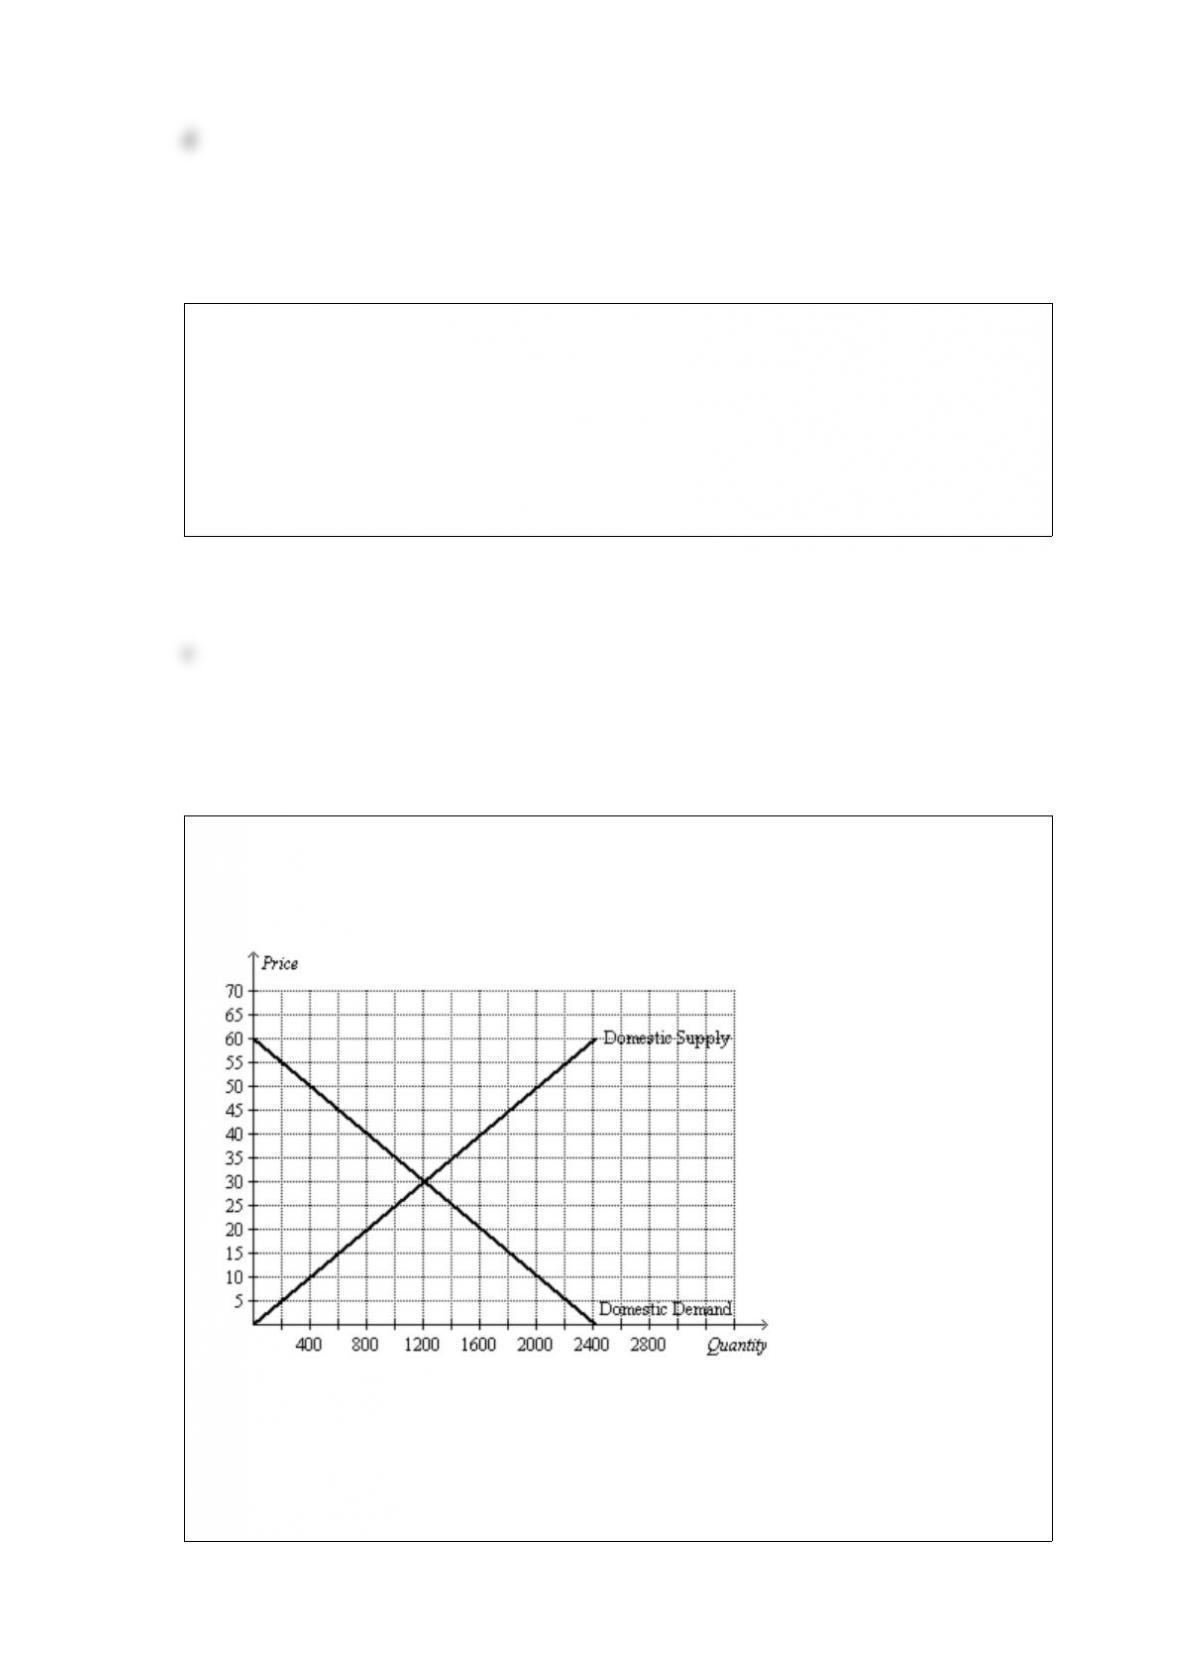
Figure 921
The following diagram shows the domestic demand and domestic supply for a market.
In addition, assume that the world price in this market is $40 per unit.
Refer to Figure 921. Consumer surplus with free trade is
a. $4,000.
b. $8,000.
c. $16,000.
d. $18,000.
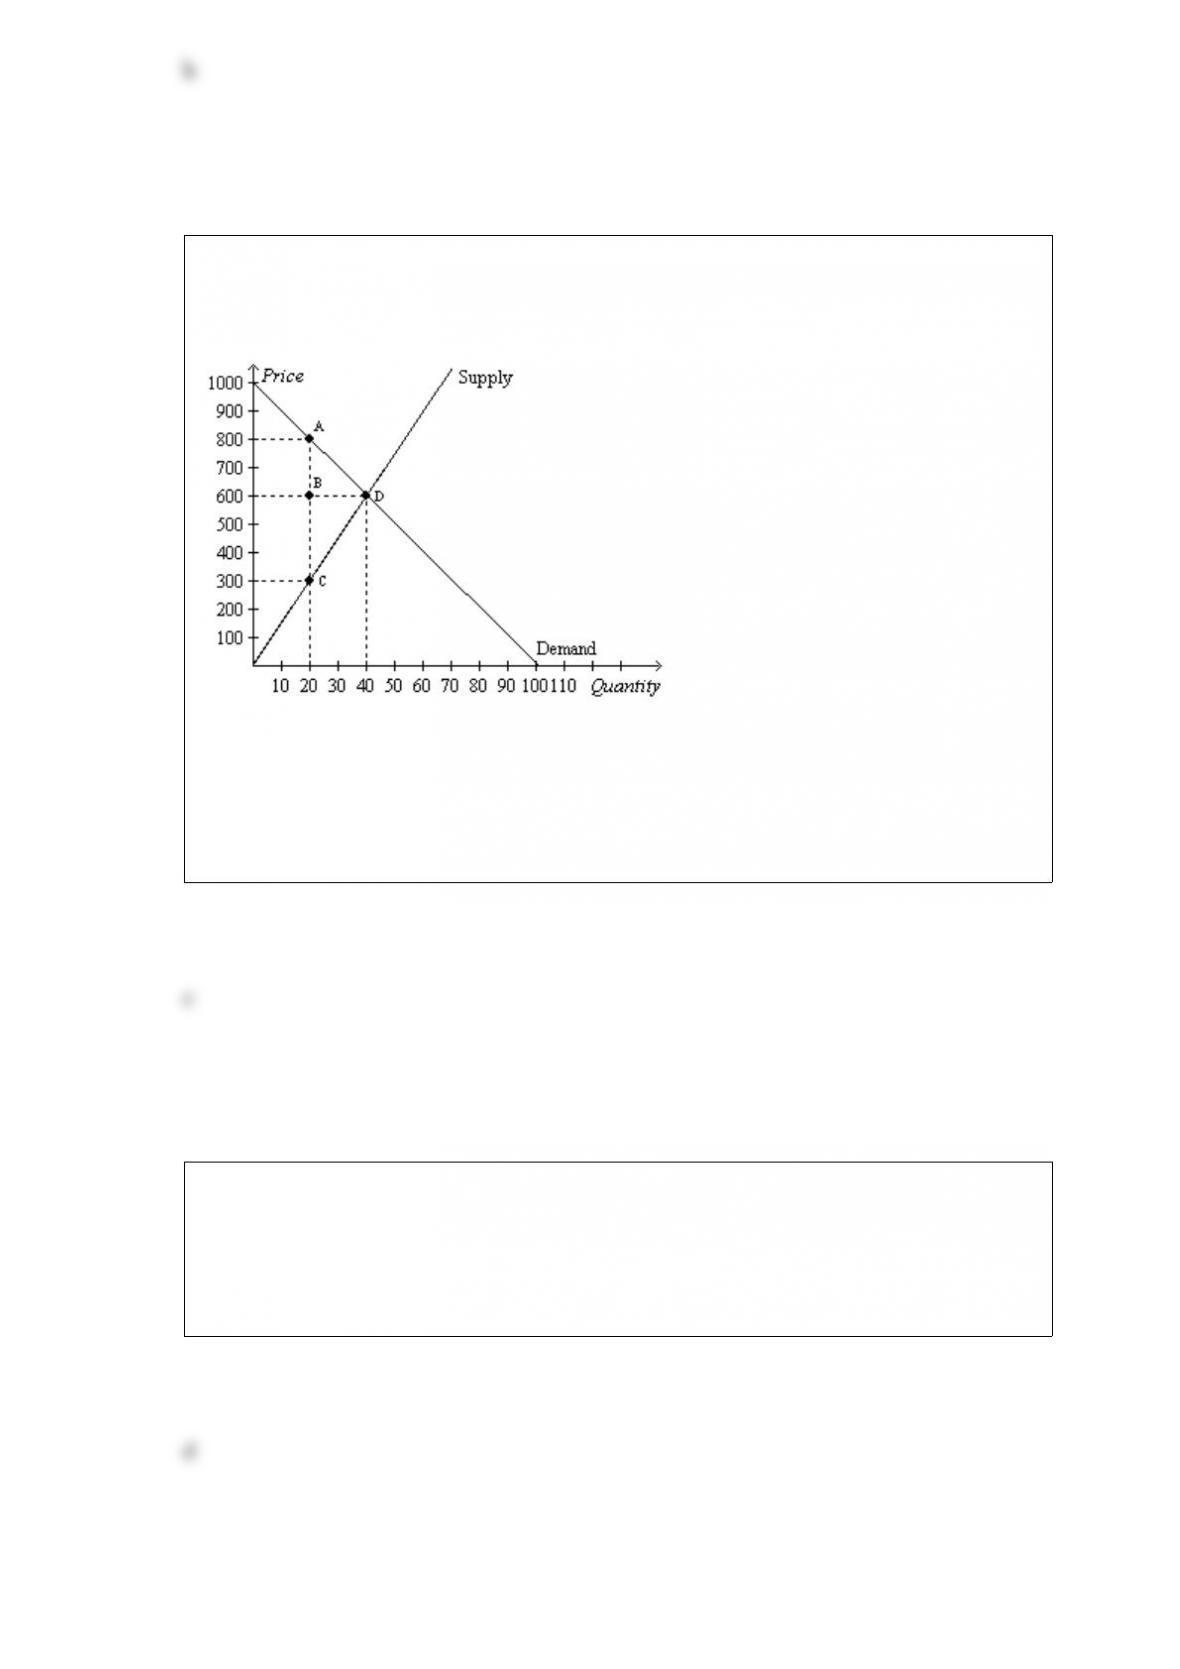
Figure 89
The vertical distance between points A and C represents a tax in the market.
Refer to Figure 89. The consumer surplus without the tax is
a. $2,000.
b. $5,000.
c. $8,000.
d. $16,000.
The tradeoff between inflation and unemployment
a. implies that policies designed to reduce unemployment also reduce inflation.
b. was eliminated by improved economic policies in the 1900s.
c. is a longrun tradeoff, persisting for decades, according to most economists.
d. None of the above are correct.

If a consumer is willing and able to pay $20 for a particular good and if he pays $16 for
the good, then for that consumer, consumer surplus amounts to
a. $4.
b. $16.
c. $20.
d. $36.
Which of the following is not correct?
a. The slope of a line will be a small positive number for a fairly flat upwardsloping
line.
b. The slope of a line will be a large positive number for a steep upwardsloping line.
c. The slope of a line will be a negative number for a downwardsloping line.
d. The slope of a line will be infinite for a horizontal line.
When the “invisible hand” guides economic activity, prices of products reflect
a. only the values that society places on those products.
b. only the costs to society of producing those products.
c. both the values that society places on those products and the costs to society of
producing those products.
d. none of the above; when the “invisible hand” guides economic activity, prices of
products are set by the government in a manner that is thought to be “fair.”
Some goods can be produced at low cost only if they are produced in large quantities.
This phenomenon is called
a. marginal cost of production.
b. marginal benefit of size.
c. economies of scale.
d. economies of production.
In a competitive market, the quantity of a product produced and the price of the product
are determined by
a. a single buyer.
b. a single seller.
c. one buyer and one seller working together.
d. all buyers and all sellers.
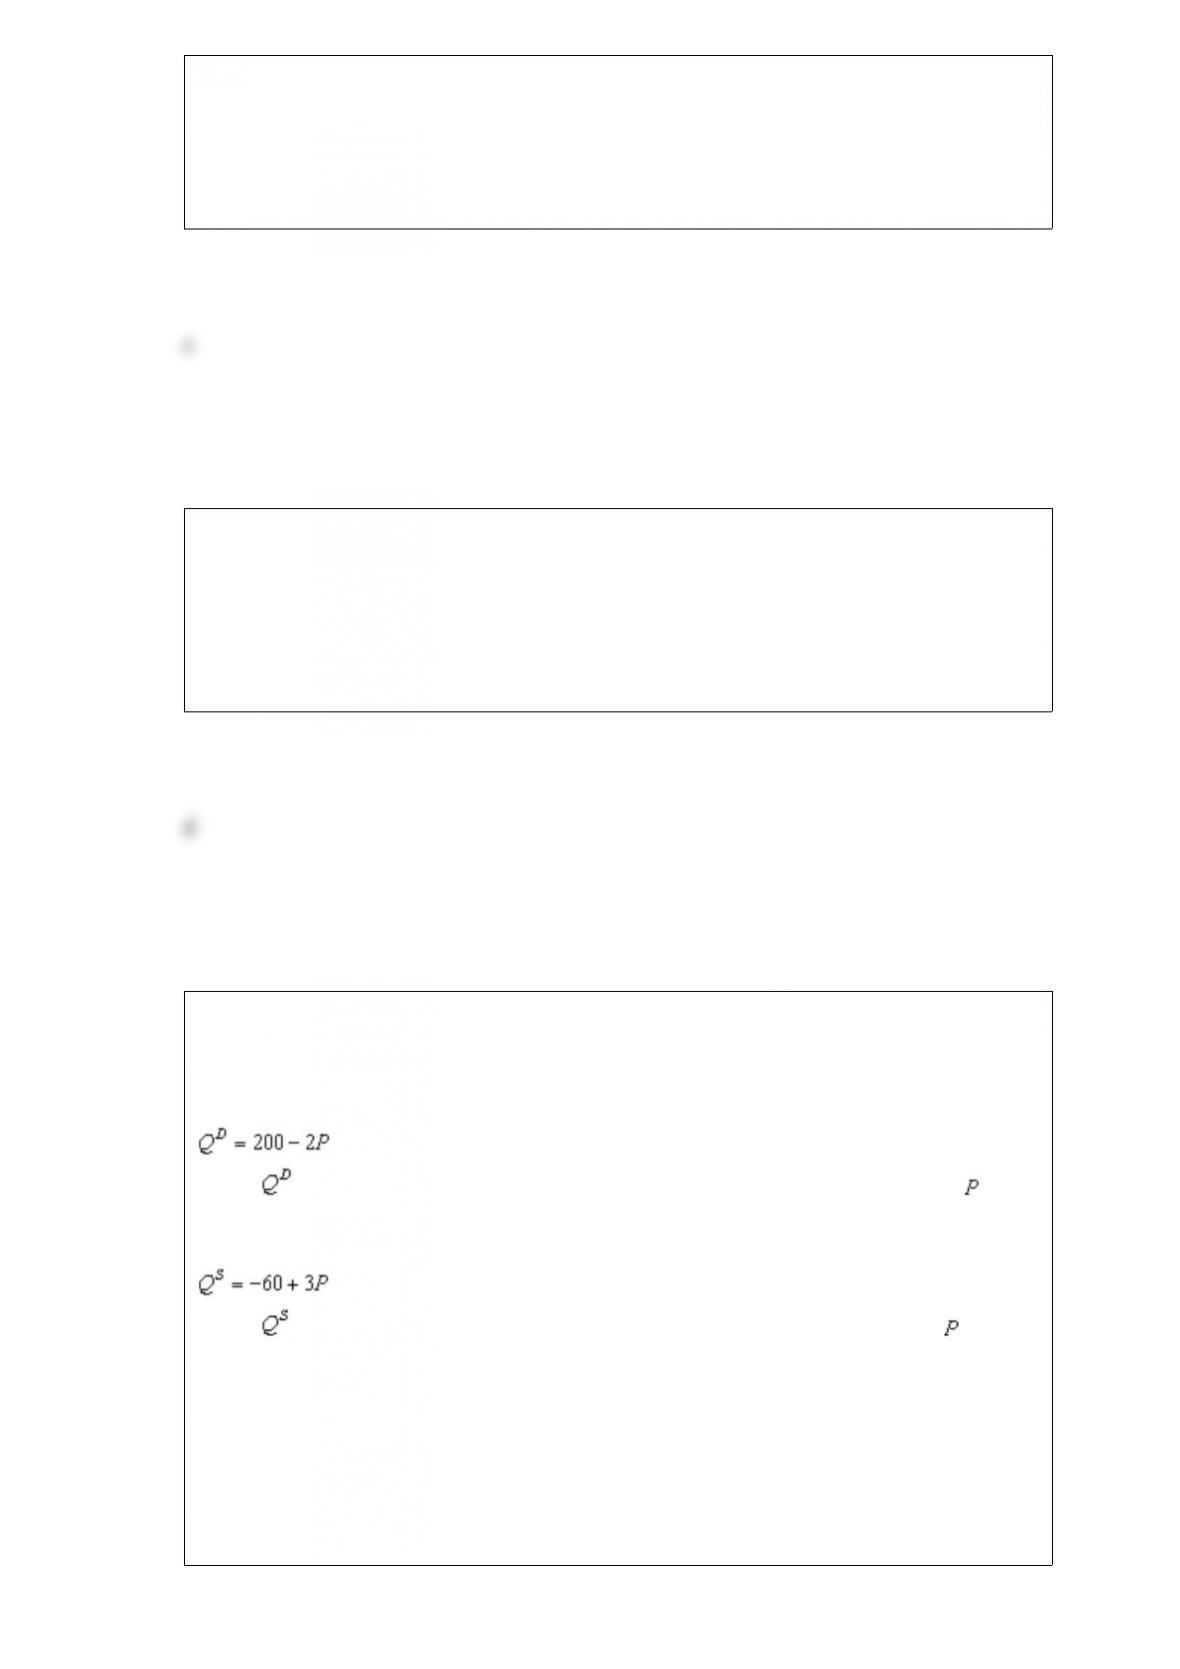
Scenario 92
• For a small country called Boxland, the equation of the domestic demand curve for
cardboard is
,
where represents the domestic quantity of cardboard demanded, in tons, and
represents the price of a ton of cardboard.
• For Boxland, the equation of the domestic supply curve for cardboard is
,
where represents the domestic quantity of cardboard supplied, in tons, and again
represents the price of a ton of cardboard.
Refer to Scenario 92. Suppose the world price of cardboard is $60. Then Boxland’s
gains from international trade in cardboard amount to
a. $145.
b. $160.
c. $210.
d. $320.

Alexis is a lawyer. She bills her clients $100 an hour for her services. She can also mow
her lawn in 30 minutes. She can hire someone to mow her lawn who takes an hour. Of
the following prices, which is the highest Alexis would pay someone to mow her lawn?
a. $99
b. $49
c. $29
d. Alexis would always mow her own lawn because she can do it faster.
Table 74
The numbers in Table 71 reveal the maximum willingness to pay for a ticket to a
Chicago Cubs vs. St. Louis Cardinal’s baseball game at Wrigley Field.
BuyerWillingness to Pay
Jennifer$10
Bryce$15
Dan$20
David$25
Ken$50
Lisa$60
Refer to Table 74. If tickets sell for $25 each, then what is the total consumer surplus
in the market?
a. $25
b. $35
c. $60
d. $110

Scenario 53
The supply of aged cheddar cheese is inelastic, and the supply of bread is elastic. Both
goods are considered to be normal goods by a majority of consumers. Suppose that a
large income tax increase decreases the demand for both goods by 10%.
Refer to Scenario 53. The change in equilibrium price will be
a. greater in the aged cheddar cheese market than in the bread market.
b. greater in the bread market than in the aged cheddar cheese market.
c. the same in the aged cheddar cheese and bread markets.
d. Any of the above could be correct.
Table 77
BuyerWillingness to Pay
Michael$500
Earvin$400
Larry$350
Charles$300
Refer to Table 77. You have four essentially identical extra tickets to the Midwest
Regional Sweet 16 game in the men’s NCAA basketball tournament. The table shows
the willingness to pay of the four potential buyers in the market for a ticket to the game.
You offer to sell the tickets for $400. How many tickets do you sell, and what is the
total consumer surplus in the market?
a. one ticket; $100
b. two tickets; $100
c. two tickets; $0
d. three tickets; $0
If a price ceiling is a binding constraint on a market, then
a. the equilibrium price must be below the price ceiling.
b. the quantity supplied must exceed the quantity demanded.
c. sellers cannot sell all they want to sell at the price ceiling.
d. buyers cannot buy all they want to buy at the price ceiling.

The Laffer curve illustrates that
a. deadweight loss rises by the square of the increase in a tax.
b. deadweight loss rises exponentially as a tax increases.
c. tax revenue first rises, then falls as a tax increases.
d. Both a) and b) are correct.
A movement upward and to the right along a supply curve is called a(n)
a. increase in supply.
b. decrease in supply.
c. decrease in quantity supplied.
d. increase in quantity supplied.
What happens to the total surplus in a market when the government imposes a tax?
a. Total surplus increases by the amount of the tax.
b. Total surplus increases but by less than the amount of the tax.
c. Total surplus decreases.
d. Total surplus is unaffected by the tax.

Figure 22
Refer to Figure 22. If households are buyers in the markets represented by Box C of
this circularflow diagram, then
a. Box C must represent the markets for the factors of production.
b. Box D must represent the markets for goods and services.
c. firms are sellers in the markets represented by Box C.
d. All of the above are correct.
If a tax shifts the supply curve downward (or to the right), we can infer that the tax was
levied on
a. buyers of the good.
b. sellers of the good.
c. both buyers and sellers of the good.
d. We cannot infer anything because the shift described is not consistent with a tax.
Which of the following is an example of a normative, as opposed to positive,
statement?
a. If the price of a product decreases, people’s willingness to buy that product will
increase.
b. Reducing tax rates on the wealthy would benefit the nation.
c. If the national saving rate were to increase, so would the rate of economic growth.
d. The elimination of trade restrictions would increase an economy’s standard of living.
Figure 924
The following diagram shows the domestic demand and supply in a market. Assume
that the world price in this market is $20 per unit.
Refer to Figure 924. Suppose the government imposes a tariff of $10 per unit. With
trade and a tariff, total surplus is
a. $750.
b. $900.
c. $950.
d. $1,550.