In perfect competition
A) the market demand curve and the individual’s demand are identical.
B) the market demand curve is perfectly inelastic while demand for an individual
seller’s product is perfectly elastic.
C) the market demand curve is perfectly elastic while demand for an individual seller’s
product is perfectly inelastic.
D) the market demand curve is downward sloping while demand for an individual
seller’s product is perfectly elastic.
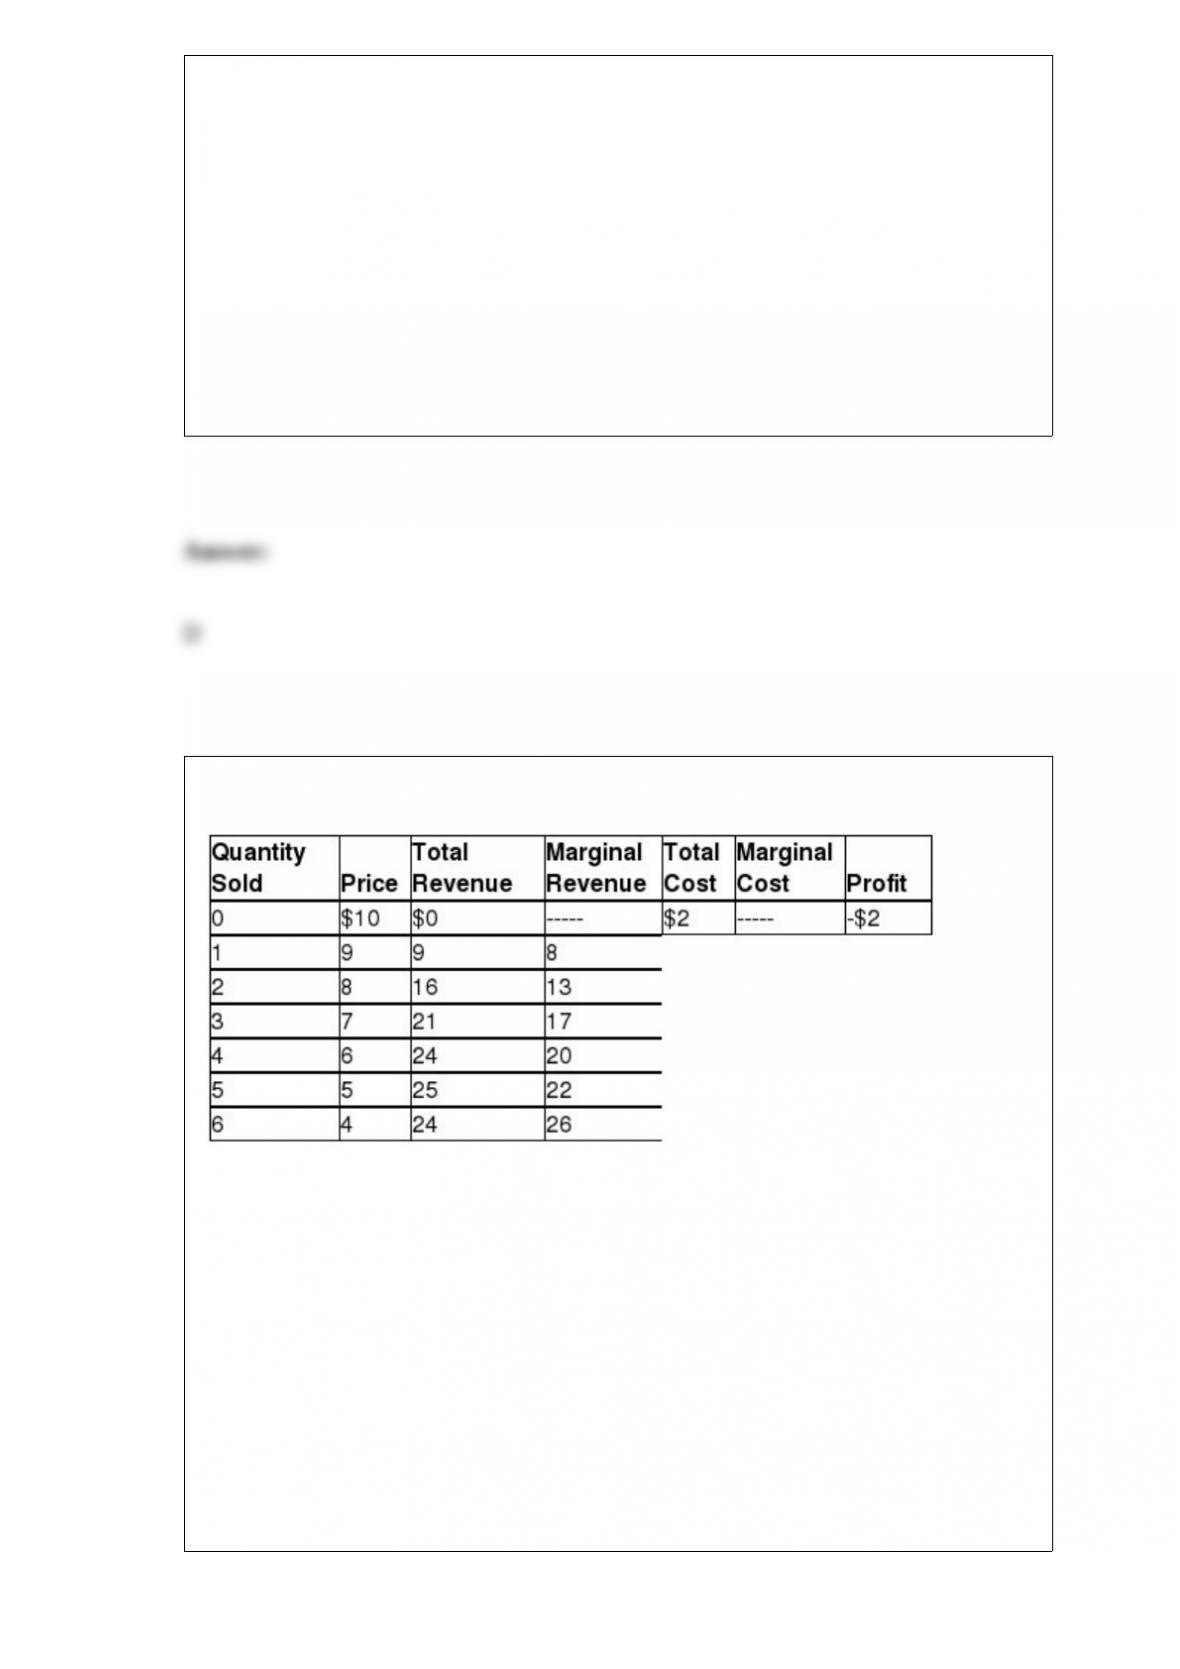
Table 13-4
Table 13-4 lists estimated revenues and costs (per week) for plastic vials (100 vials per
box) for the Victoria Biological Supplies Company. Victoria sells plastic vials to
university and private research laboratories.
At Victoria’s profit-maximizing output
A) profit equals $2.
B) total revenue equals $24 and total cost equals $20.
C) total revenue equals $25 and total cost equals $22.
D) total revenue equals $21 and total cost equals $17.

People hold money as opposed to financial assets because money
A) earns interest.
B) is perfectly liquid.
C) earns no interest.
D) earns a higher return than other financial assets.
Which of the following accurately describes an effect of hurricane Katrina on GDP?
A) GDP would decrease reflecting the costs of cleanup.
B) GDP would increase reflecting the costs of cleanup.
C) GDP would increase reflecting the decrease in production that occurred during the
storm and the productive capacity lost in the storm.
D) GDP would increase well-being.
Which of the following is an example of a compensating wage differential?
A) Nurse anesthetists are paid less than anesthesiologists (who have medical degrees).
B) Workers in a dynamite mine receive higher wages than if they worked in other jobs
that require the same level of skills.
C) In the market for lawyers, top graduates from the top programs earn starting salaries
that are significantly higher than the starting salaries earned by lower-ranked graduates
from the lower-ranked programs.
D) Popular movie stars like George Clooney command much higher salaries than other
talented but lesser-known actors.
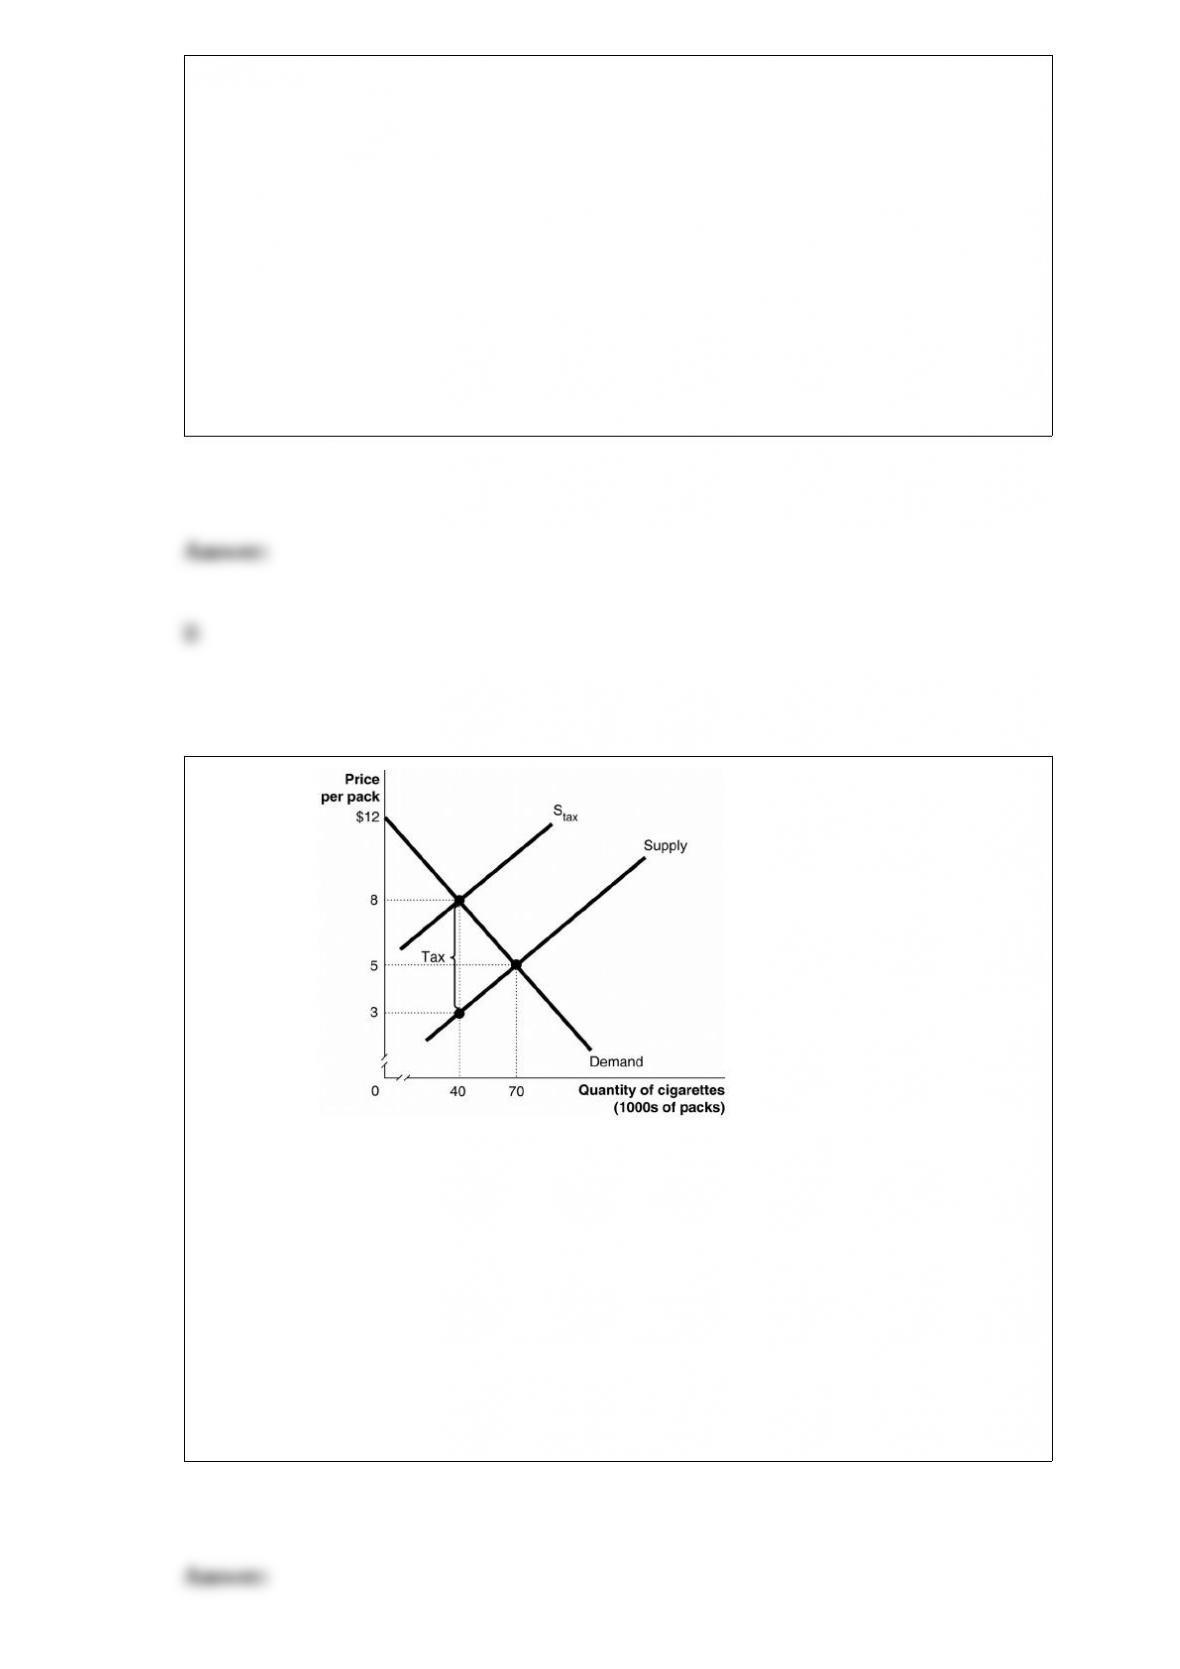
Figure 4-18 Figure 4-18 shows the market
for cigarettes. The government plans to impose a unit tax in this market.
How much of the tax is paid by producers?
A) $45
B) $8
C) $3
D) $2

For each of the following pairs of products state which are complements, which are
substitutes, and which are unrelated.
a. Swim fins and scuba tanks
b. Coca Cola and Volkswagens
c. Printers and ink cartridges
d. Ice and ice chests
e. Heineken and Corona
Suppose Bob works for Mary as a proofreader. Mary and Bob fall deeply in love, marry
and have eight children. Bob stops working for Mary in order to care for the children.
What will be the effect on GDP?
A) GDP will decrease.
B) GDP will increase.
C) GDP will not change.
D) GDP may increase or may decrease depending on inflation.

Figure 4-1 Figure 4-1 shows Arnold’s demand curve for
burritos.
If the market price is $1.00, what is the consumer surplus on the fourth burrito?
A) $0
B) $0.50
C) $1.50
D) $2.25
According to the World Bank, in 2006, China’s GDP was approximately $2.7 trillion (or
$2,700 billion). That same year, India’s GDP was approximately $906.3 billion. With
which of the following populations would China’s standard of living have been
considered higher than India’s that year?
A) China’s population = 1.3 billion; India’s population = 1.1 billion
B) China’s population = 8.3 billion; India’s population = 1.1 billion
C) China’s population = 500 million; India’s population = 125 million
D) China’s population = 3.5 billion; India’s population = 1.1 billion
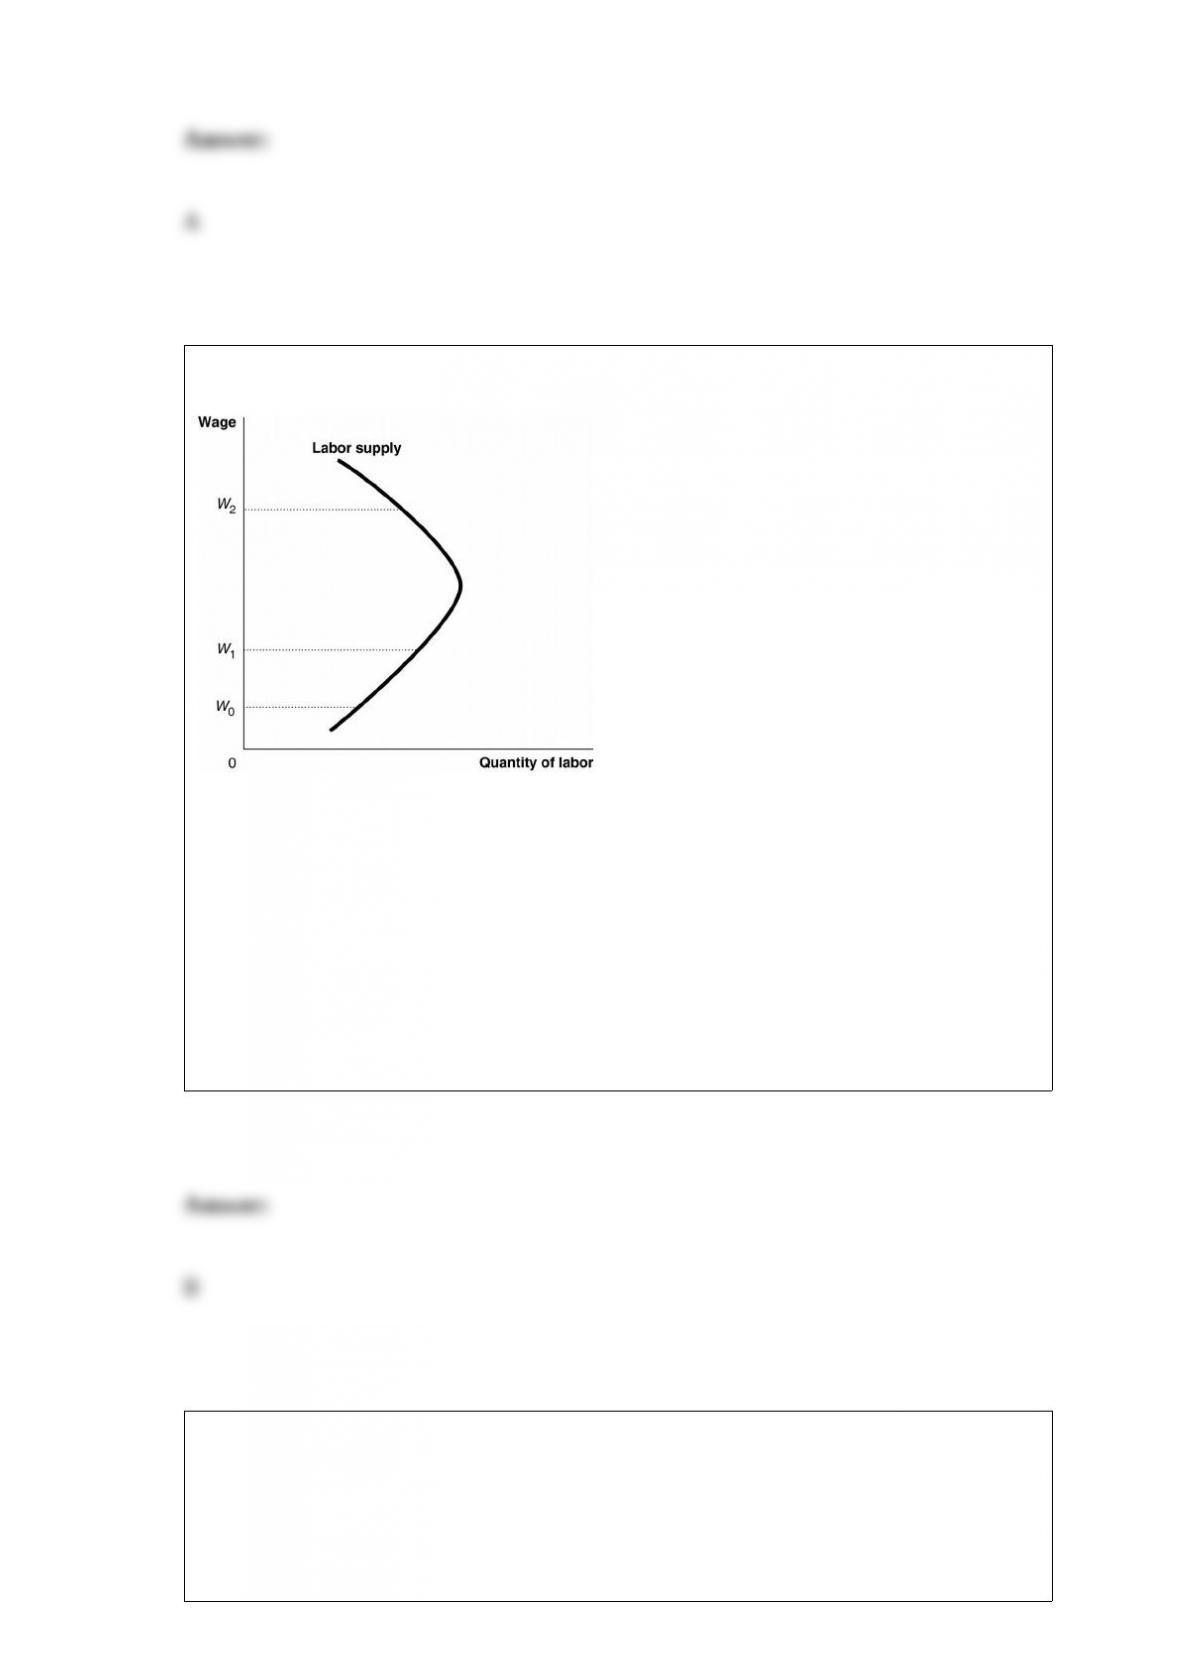
Figure 17-4
Which of the following is true if the wage rate increases from W0 to W1?
A) The income effect is larger than the substitution effect.
B) The substitution effect is larger than the income effect.
C) The income effect and the substitution effect are equal.
D) The supply curve is unit-elastic.
If the quantity of sunglasses supplied is represented by the equation QS = -60 + 4P then
the corresponding price of sunglasses is represented by the equation
A) P = 0.25QS + 15.
B) P = 15QS + 240.
C) P = QS – 7.5.
D) P = 12 – 0.4QS.
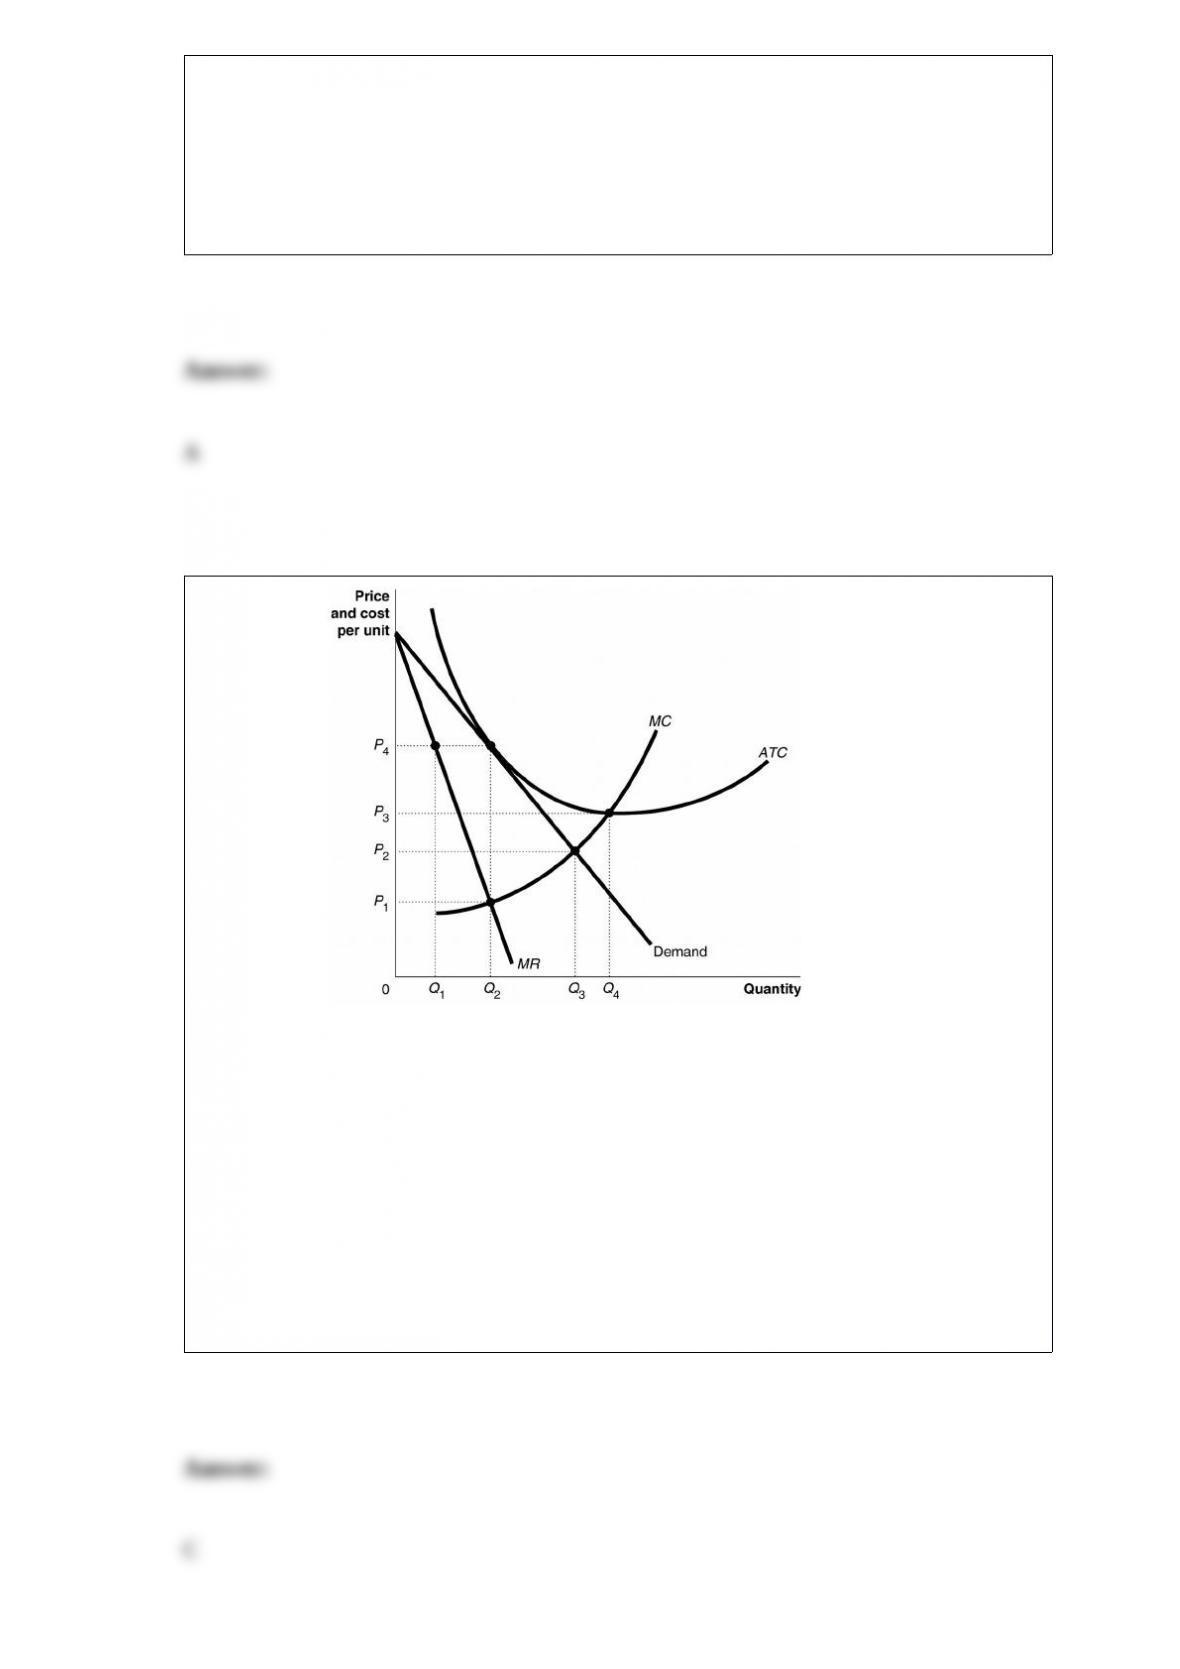
Figure 13-11
What is the allocatively efficient output for the firm represented in the diagram?
A) Q1 units
B) Q2 units
C) Q3 units
D) Q4 units