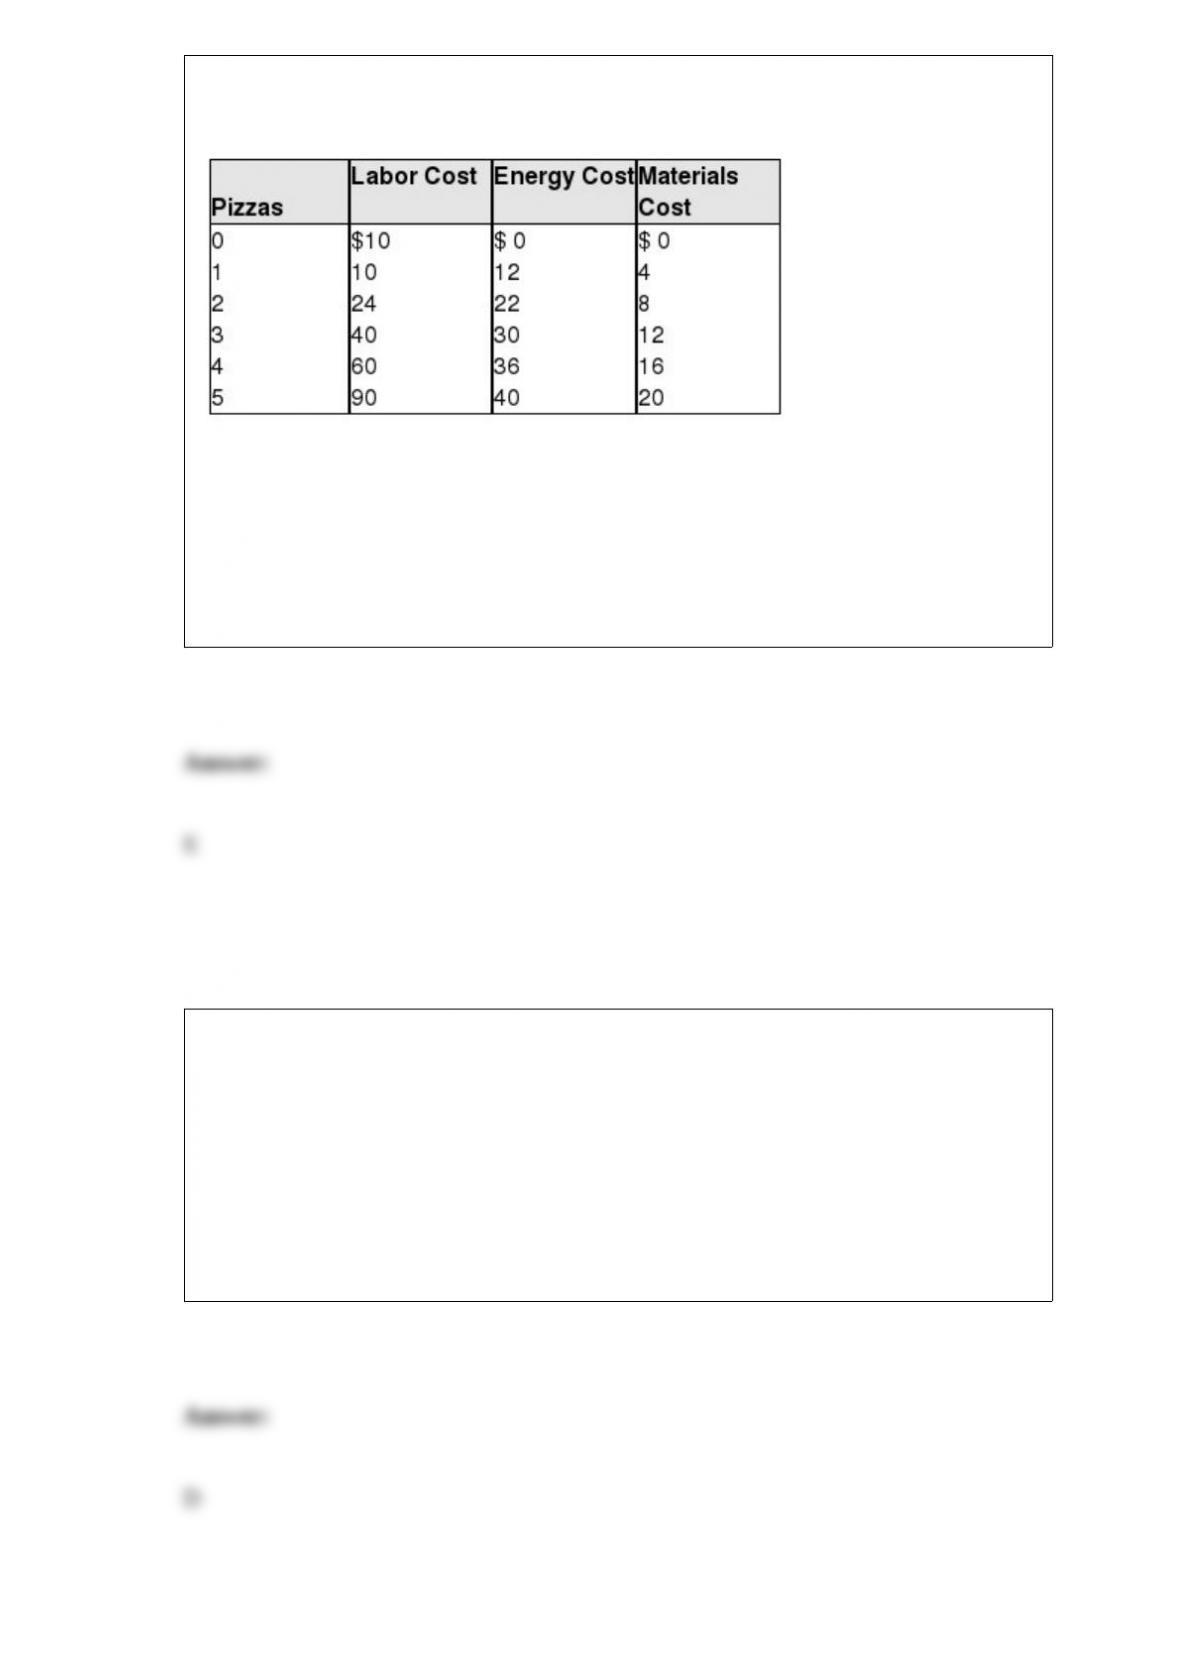
Exhibit 7-2 Cost schedule for pizza production
Exhibit 7-2 shows the labor, energy, and materials cost of making various quantities of
pizzas. The table shows that the materials cost of making pizzas will:
a. increase at a decreasing rate.
b. decrease at a decreasing rate.
c. decrease at an increasing rate.
d. increase at an increasing rate.
e. increase at a constant rate.
Given a production possibilities curve, a point:
a. inside the curve represents unemployment.
b. on the curve represents full employment.
c. outside the curve is currently unattainable.
d. all of these.
Which of the following will not shift the demand curve for televisions?
a. An increase in the price of televisions.
b. An increase in consumer income.
c. An increase in the price of radios (a substitute).
d. An increase in the price of cable service (a complement).
In order to make oil profits as large as possible, OPEC meets to set oil production
quotas for its members. OPEC is best classified as a:
a. monopoly. c. kinked demand industry.
b. cartel. d. price-leadership industry.
An appreciation of one’s currency means that:
a. the country’s exports will become less expensive.
b. the country’s imports will become more expensive.
c. the country’s imports will become less expensive.
d. it now requires more of this currency in exchange for one unit of another currency.
e. it now requires less units of other currencies in exchange for one unit of this currency.
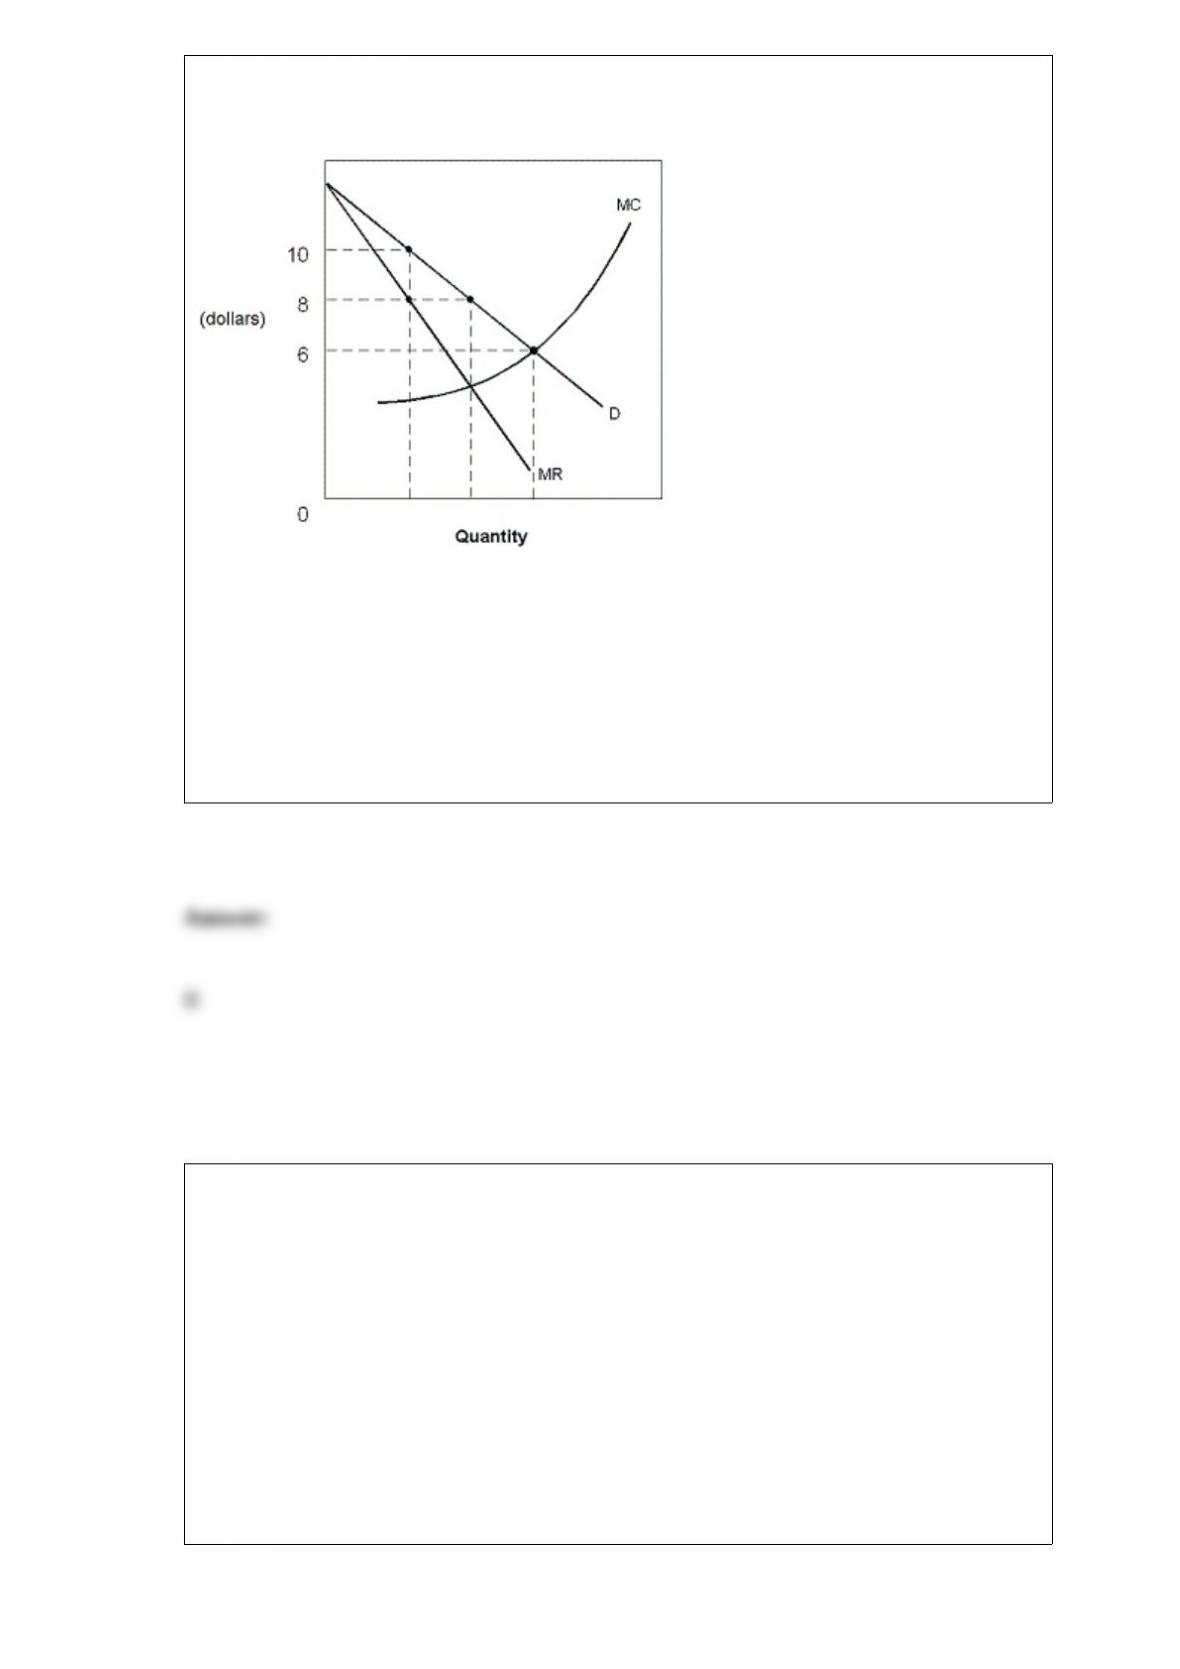
Exhibit 9-7 Monopolist
According to the information provided in Exhibit 9-7, if the Rudd Ice Company was a
monopoly and is currently charging a price of $6, what would you advise Rudd to do?
a. Stay where he is currently operating because he is charging the profit maximizing
price.
b. Increase price and decrease output.
c. Decrease price and increase output.
d. Increase output and hold price constant.
e. Increase price and hold output constant.
When there are positive externalities associated with the consumption of a good, we can
expect the market:
a. demand curve to lie above the social demand curve.
b. demand curve to lie below the social demand curve.
c. supply curve to lie above the social supply curve.
d. supply curve to lie below the social supply curve.
e. demand curve to lie below the social supply curve.

Which of the following antitrust laws broadened the list of illegal price discrimination
practices and is often called the “Chain Store Act”?
a. The Clayton Act. c. The Robinson-Patman Act.
b. The Federal Trade Commission Act. d. The Celler-Kefauver Act.
A cartel maximizes industry profit by:
a. eliminating quotas.
b. producing at the kink in its demand curve.
c. producing where MR = MC.
d. giving secret price concessions.
e. producing more output than a monopoly would.
Exhibit 3A-2 Comparison of Market Efficiency and Deadweight Loss
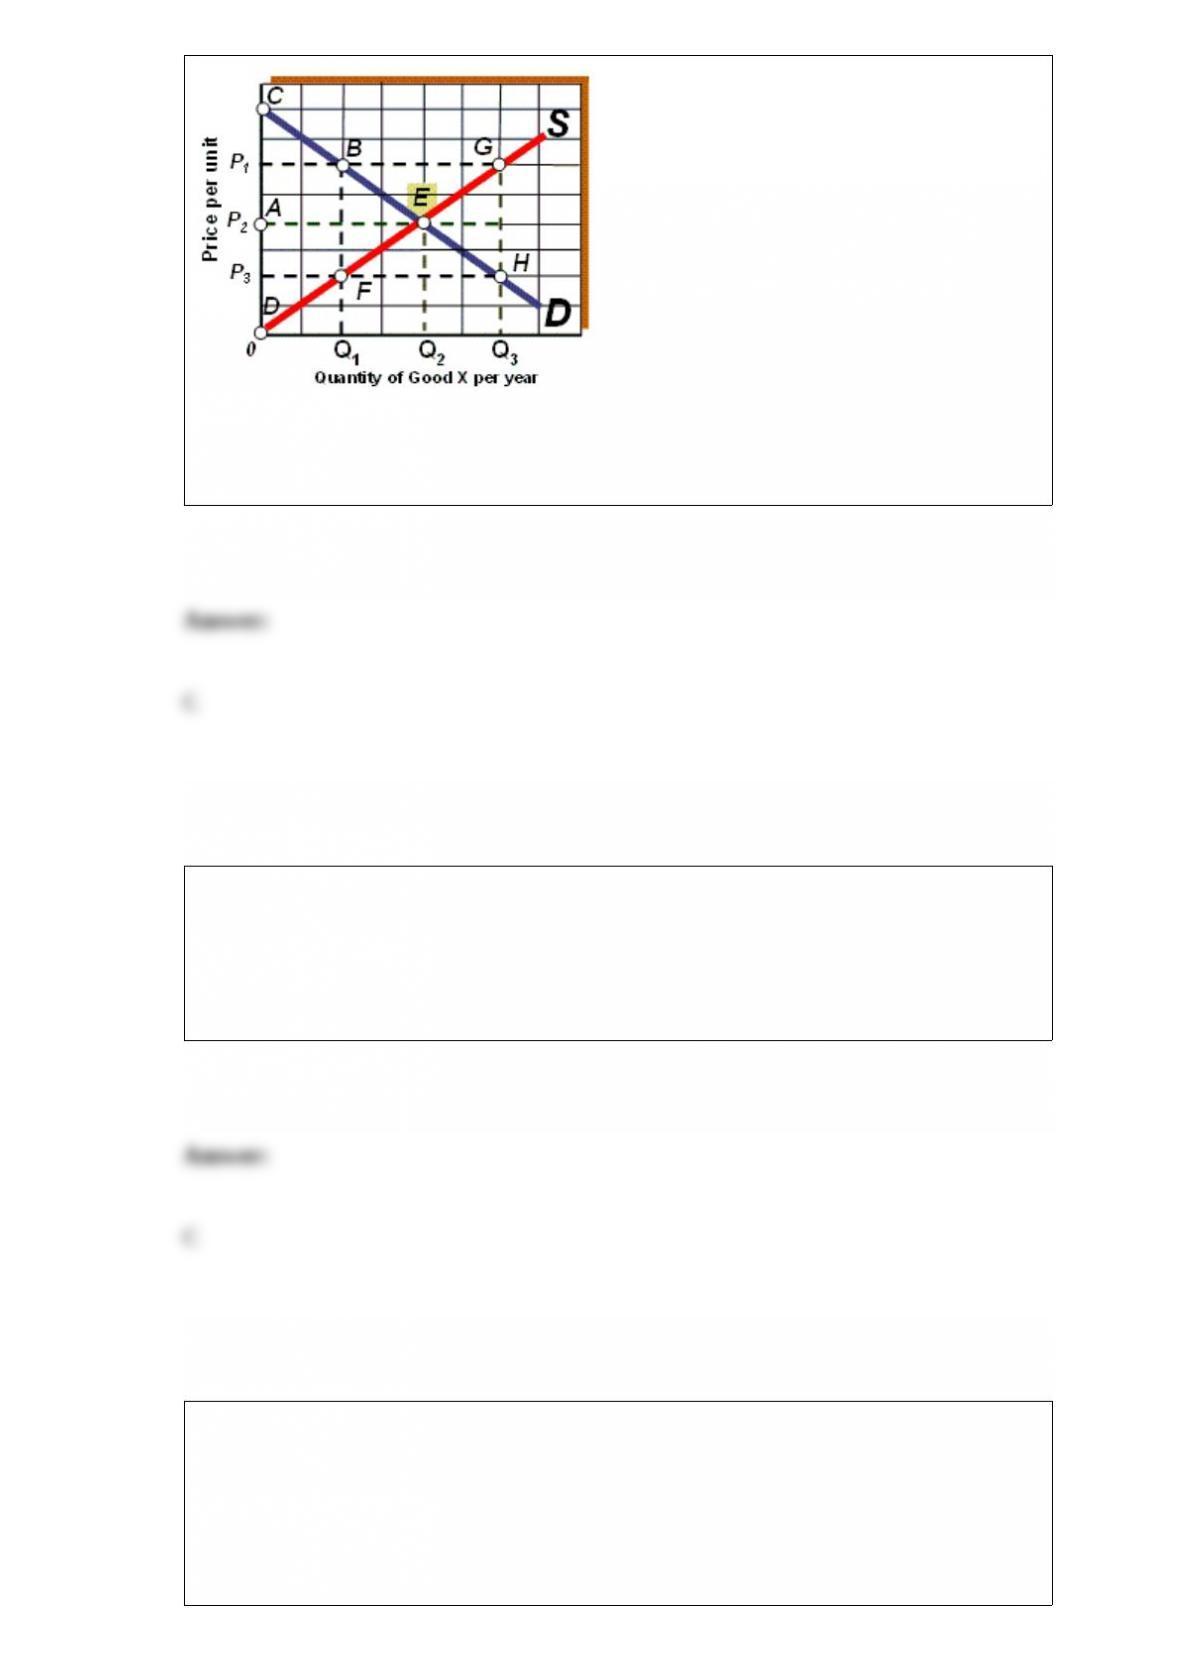
As shown in Exhibit 3A-2, if the market price falls from P2 to P3, then:
a. total surplus increases. c. overproduction increases.
b. deadweight loss decreases. d. underproduction decreases.
The monopolist faces:
a. a perfectly inelastic demand curve.
b. a perfectly elastic demand curve.
c. the entire market demand curve.
d. all of these.
When consumption of a good or service produces benefits or costs that are not reflected
in the market price for the good, this is known as a(n):
a. externality. c. nonexcludable resource.
b. common pool problem. d. public good.

Which of the following would be most likely to improve the standard of living of the
residents of a less-developed country?
a. The development of strong labor unions.
b. A sharp increase in the legal minimum wage.
c. An increase in expenditures on education and capital investment.
d. Rapid growth rate of the money supply.
Government regulators can achieve efficiency for a natural monopoly by setting a price
ceiling equal to the intersection of the demand curve and the:
a. marginal revenue curve. c. marginal cost curve.
b. average cost curve. d. average fixed cost curve.
Which of the following most accurately indicates the implications of an economy’s
production possibilities curve?
a. If all the resources of an economy are being used efficiently, more of one good can be
produced only if less of another good is produced.
b. If all the resources of an economy are being used efficiently, it is generally possible
to produce more of one good without having to sacrifice the production of other goods.
c. Over time, it is generally impossible for a country to expand its production of goods.
d. An economy will automatically move toward a point that lies outside of the
production possibilities constraint unless proper government policy constrains
production.
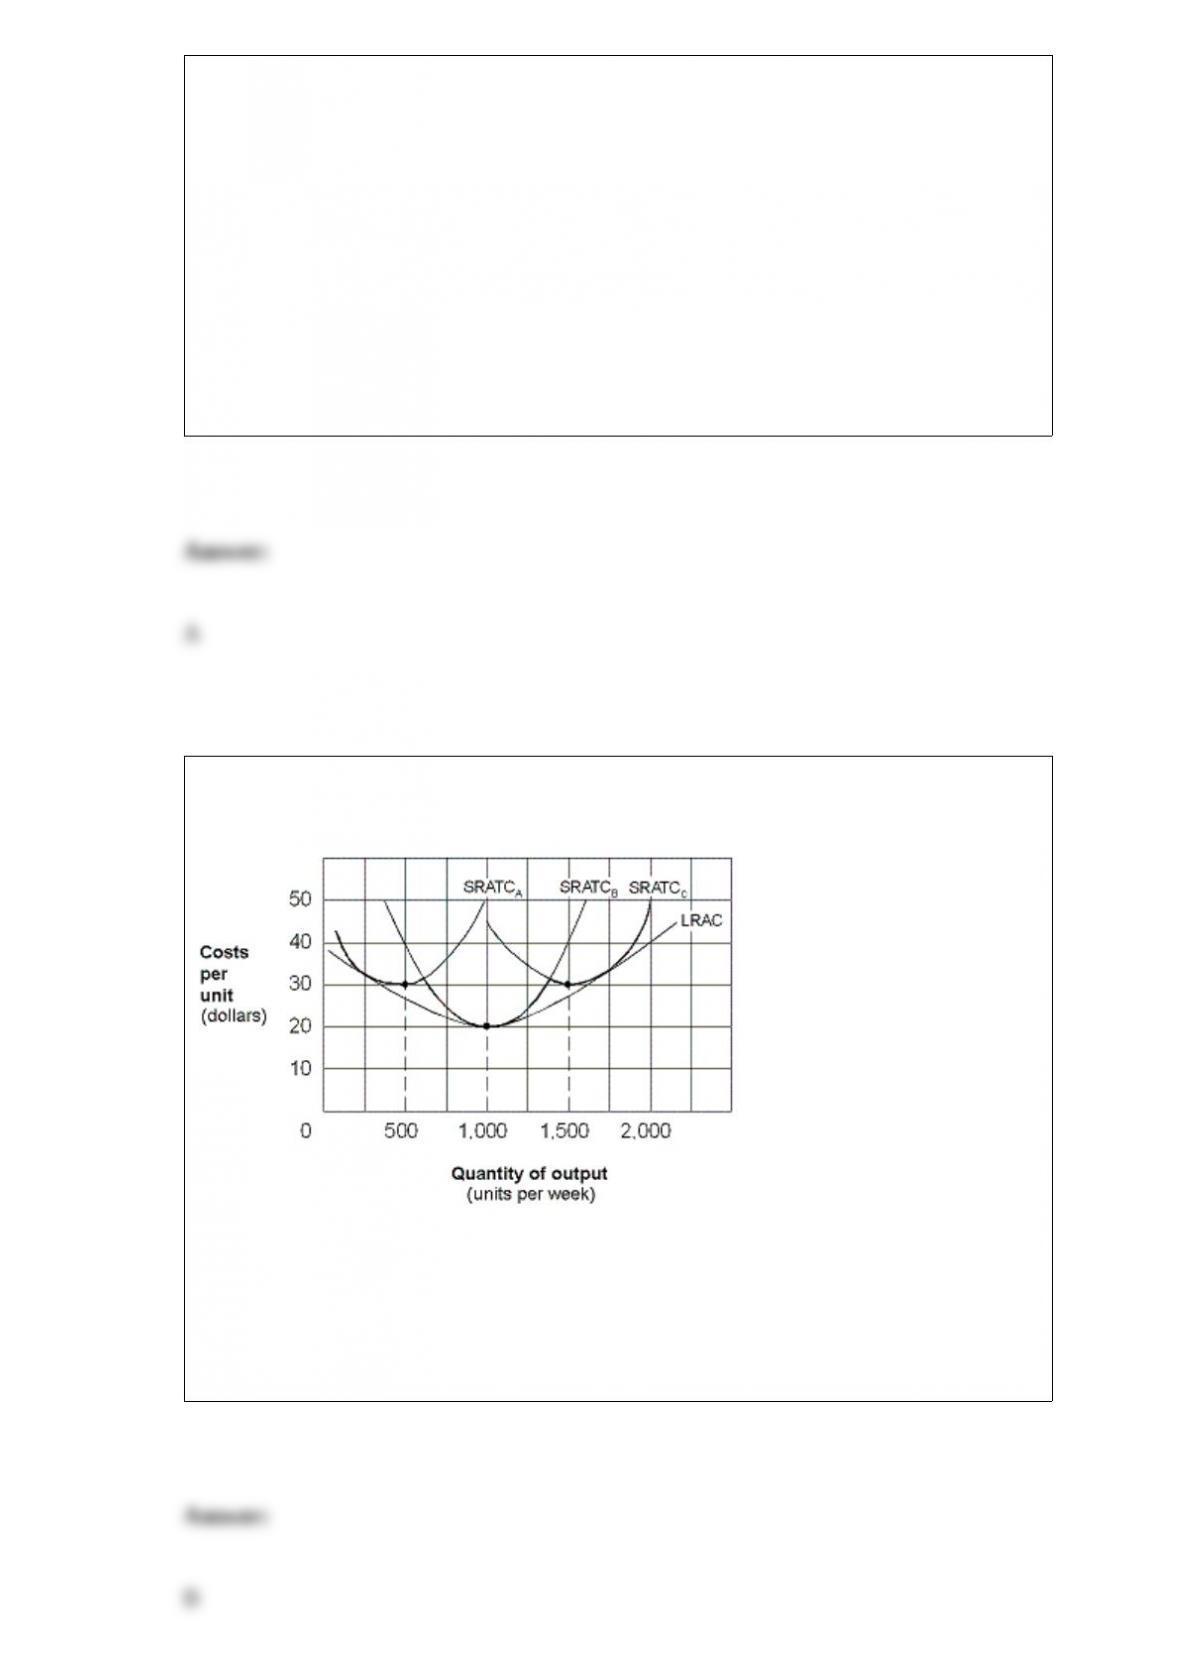
Exhibit 7-15 Long-run average cost
In Exhibit 7-15, short-run average total cost, short-run marginal cost, and long-run
average cost are all equal at which level of output per week?
a. 500 units.
b. 1,000 units.
c. 1,500 units.
d. 2,000 units.

Consumer equilibrium is a condition in which total utility cannot increase by spending
more of a given budget on one good and spending ____ on another good.
a. an equal amount
b. more
c. less
d. zero
Marginal utility will generally decrease when:
a. more of a particular good is consumed.
b. less of a particular good is consumed.
c. average utility is the least.
d. per capita utility is the least.
e. the TU curve’s slope is positive rather than negative.
Utility is defined as the:
a. sense of pleasure or satisfaction derived from consuming goods and services.
b. cost of acquiring goods and services.
c. profits consumers earn from consuming goods and services.
d. monetary value to consumers of goods and services.
e. desire to consume goods and services.
According the Coase Theorem, the private sector can achieve social efficiency if the
government:
a. establishes and enforces property rights.
b. imposes taxes to serve as proxies for external costs.
c. set rigorous environmental standards.
d. encourages competition with antitrust laws.
Marginal cost is defined as the increase in total cost resulting from an increase in:
a. one unit of output.
b. output of 100 units.
c. a firm’s plant size.
d. one unit of labor.
If some resources were used inefficiently, the economy would operate outside its
production possibilities curve.

The statement “American workers are lazy” is an example of positive economic
analysis.
Surpluses cause prices to fall while shortages cause prices to rise.
Adam Smith argued that government should actively intervene in market to improve
economic performance.

Assume demand is held constant and supply increases. The result is a decrease in the
equilibrium price and an increase in the equilibrium quantity of the item bought and
sold.
Typically, marginal utility is higher when a person consumes less of a good.