
A minimum wage policy induces an:
A) excess demand for labor.
B) excess supply of labor.
C) efficient market outcome.
D) elastic labor supply response.
Scenario 12.3:
Suppose a stream is discovered whose water has remarkable healing powers. You
decide to bottle the liquid and sell it. The market demand curve is linear and is given as
follows:
P = 30 – Q
The marginal cost to produce this new drink is $3.
Refer to Scenario 12.3. What will be the price of this new drink in the long run if the
industry is a Cournot duopoly?
A) $3
B) $9
C) $12
D) $13.50
E) none of the above

When the TR and TC curves have the same slope,
A) they are the furthest from each other.
B) they are closest to each other.
C) they intersect each other.
D) profit is negative.
E) profit is zero.
Which of the following is true concerning the substitution effect of a decrease in price?
A) It will lead to an increase in consumption only for a normal good.
B) It always will lead to an increase in consumption.
C) It will lead to an increase in consumption only for an inferior good.
D) It will lead to an increase in consumption only for a Giffen good.

In equilibrium, the price of a transferable emissions permit
A) is constrained to the amount the government first charged for it.
B) equals the marginal cost of abatement for all firms.
C) equals the marginal cost of abatement for the firm with the highest cost, and exceeds
the marginal cost of abatement of other firms.
D) equals the marginal cost of abatement for the firm with the lowest cost, and is less
than the marginal cost of abatement of other firms.
E) equals the marginal social cost of emissions.
The difference between the marginal social cost and the private cost of a common
property resource represents:
A) the social discount rate.
B) a deadweight loss.
C) is generally negative because the people who use the resources assign higher value
to them than other members of society.
D) the opportunity cost of reducing the resource by one unit for other members of
society.

The short run is
A) less than a year.
B) three years.
C) however long it takes to produce the planned output.
D) a time period in which at least one input is fixed.
E) a time period in which at least one set of outputs has been decided upon.
Which of the following statements is NOT true?
A) If an economic theory is proven to be untrue, then it must be discarded.
B) If an economic theory is proven to be untrue, then it may be modified or discarded.
C) Economic theories provide the basis for making predictions.
D) Economic models are specific representations of economic theories.
Suppose the local market for legal services has an upward sloping supply curve, PL =
150 + 0.0001QL where PL is the price of legal services and QL is the number of hours
of legal services. If the equilibrium price of legal services is $250 per hour, what is the
aggregate economic rent earned by lawyers in this market?

A) $50,000
B) $1,000,000
C) $50,000,000
D) $100,000,000
The market for paper in a particular region has the supply and demand curves:
QD = 160,000 – 2,000P QS = 40,000 + 2,000P,
where Q is measured in hundred-pound lots, and P is price per hundred-pound lot.
There is currently no attempt to regulate the dumping of effluent into streams and rivers
by the paper mills. As a result, dumping is widespread. The marginal external cost
associated with the paper production is given by the expression:
MEC = 0.0002Q.
a. Calculate the competitive price and output, assuming that no attempt is made to
monitor or regulate the dumping of effluent.
b. Determine the socially optimal levels for price and output. If your answers in (a) and
(b) are different, explain the source of the difference.
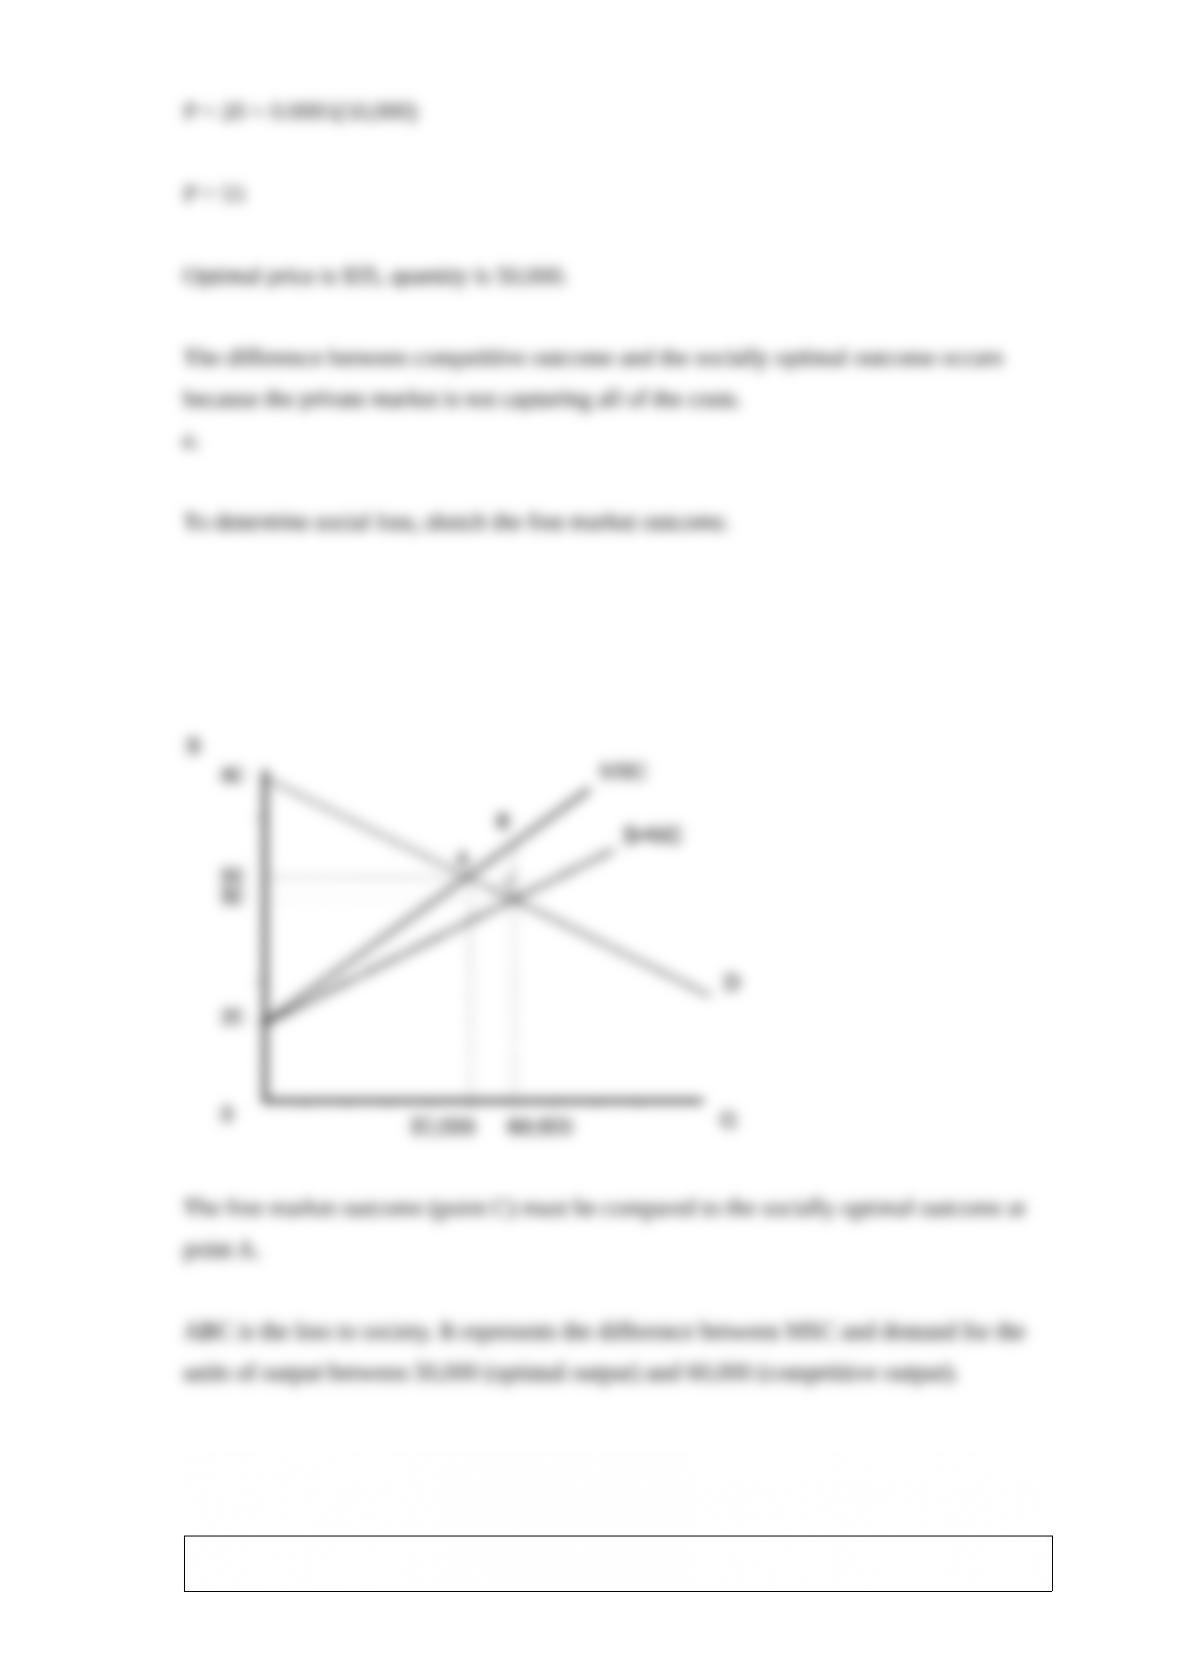
c. Sketch a diagram showing the costs or benefits to society of allowing the market to
operate in an unregulated fashion.
The formula for finding the present value of an amount M that will be received one year

from now, when the interest rate is R, is
A) M × (1 + R/100).
B) M × (1 + R).
C) M / (1 + R).
D) M / R.
E) M / (100R).
Scenario 2:
Sam and Sally are the only consumers in an economy where tee shirts and candy are the
only commodities that are consumed. The marginal utility schedule for each appears
below.
Sam tee shirts MU(tee shirts) Candy MU(Candy)
1 10 1 6
2 9 2 5
3 8 3 4
4 7 4 5
5 6 5 4
Sally tee shirts MU(tee shirts) Candy MU(Candy)
1 24 1 12
2 19 2 9
3 18 3 8
4 14 4 7

5 10 5 3
There are 7 candies and 7 tee shirts total in the economy.
Consider the case when the goods are redistributed such that Sam has 3 tee shirts and 3
candies. Sally has 4 tee shirts and 4 candies.
What is Sally’s marginal rate of substitution of tee shirts for candy at the current
distribution?
A) 7/2.
B) 2
C) 1/2.
D) It is impossible to determine without the prices of each commodity.
Some firms provide stock options to managers as an incentive to work hard and
increase the value of the firm. A typical option contract gives the manager the right to
buy the firm’s stock at a set price (known as the exercise price). If the firm’s stock value
increases and moves above the exercise price, then the manager’s option becomes more
valuable. What is the potential problem with this incentive scheme?
A) The incentive does not include a performance benchmark, so it cannot be optimal.
B) There is a dynamic incentive problem — the manager may focus too much on the
firm’s short-run stock value and not on actions that are in the best interest of the firm for
the long run.
C) The incentive value depends on the firm’s stock value, which cannot be influenced
by the amount of work or effort exerted by the manager.
D) There are no problems with this incentive scheme.

If we take the production function and hold the level of output constant, allowing the
amounts of capital and labor to vary, the curve that is traced out is called:
A) the total product.
B) an isoquant.
C) the average product.
D) the marginal product.
E) none of the above
Arbitraging price differences between two markets is generally not possible if:
A) there are positive costs of transporting the products from one market to the other.
B) the transportation costs are larger than the difference in prices.
C) the government has prohibited exchange between the two markets.
D) A and C above
E) B and C above
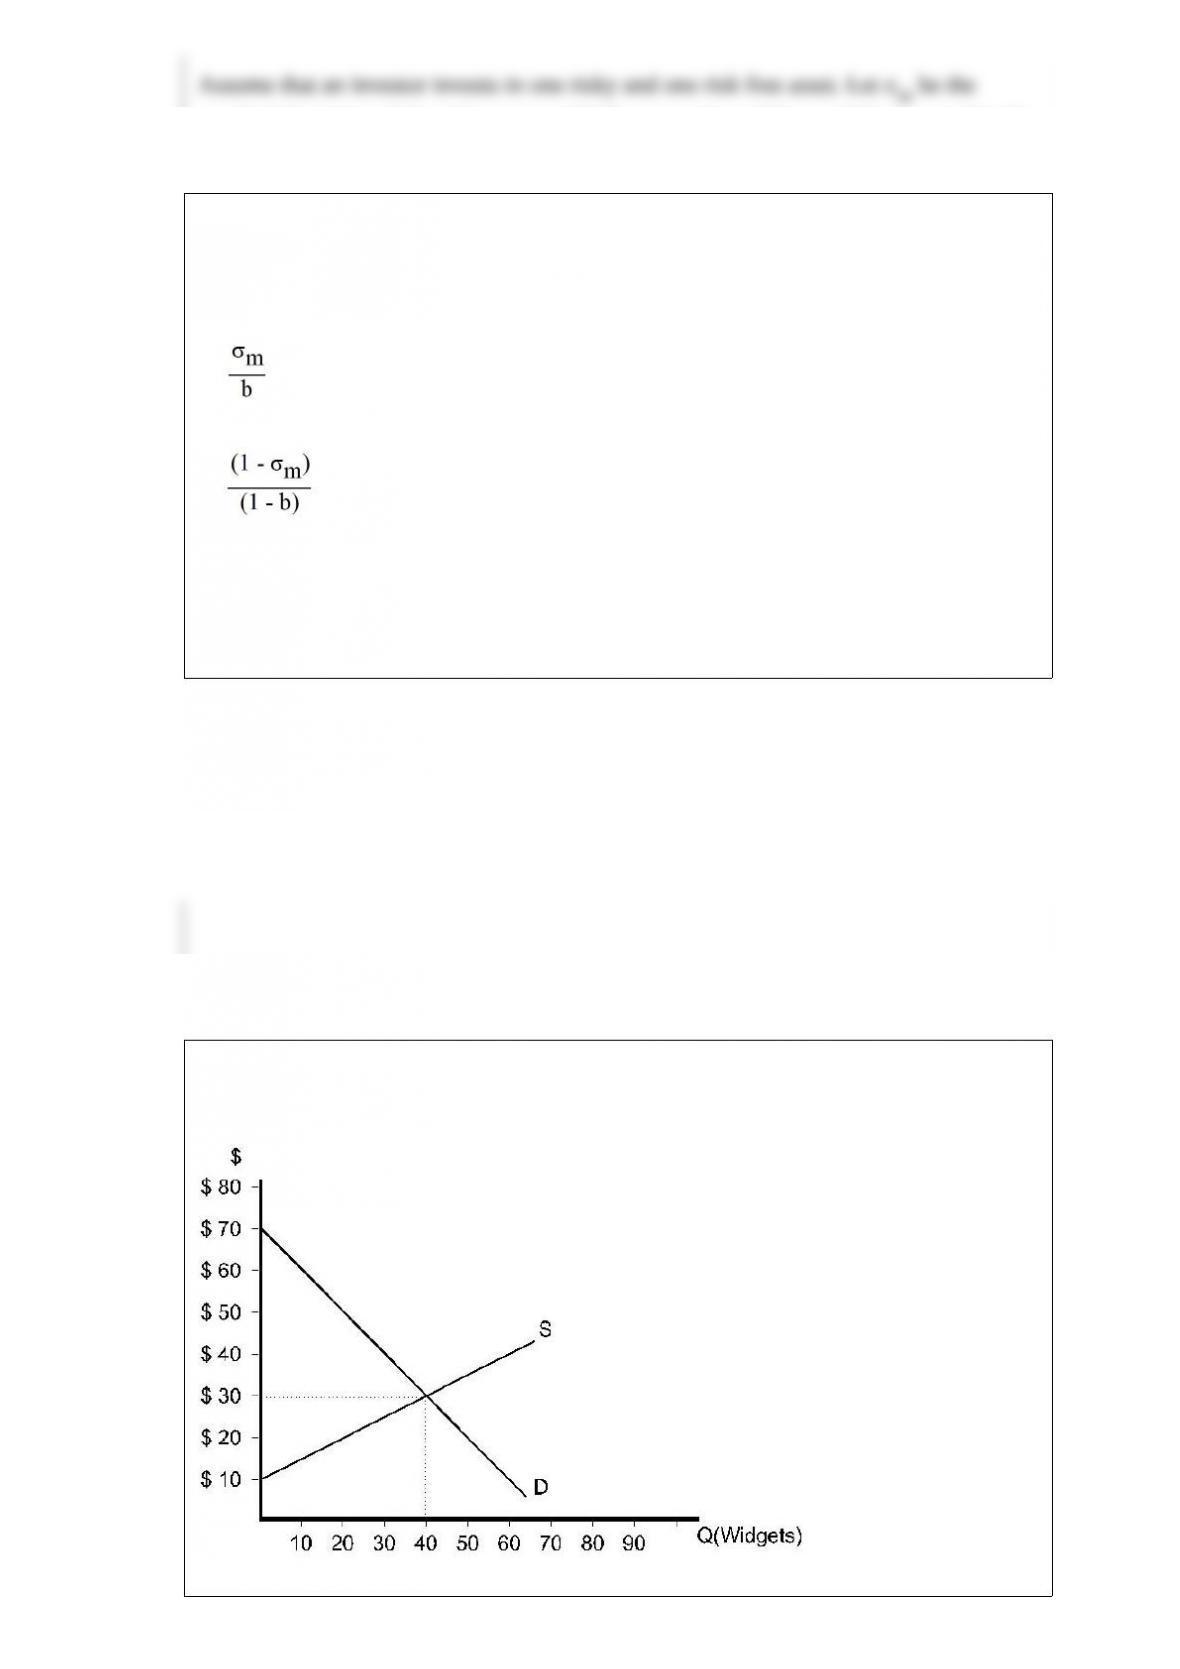
Assume that an investor invests in one risky and one risk free asset. Let σm be the
standard deviation of the risky asset and b the proportion of the portfolio invested in the
risky asset. The standard deviation of the portfolio is then equal to ________.
A)
B)
C) (1 – b) σm
D) b σm
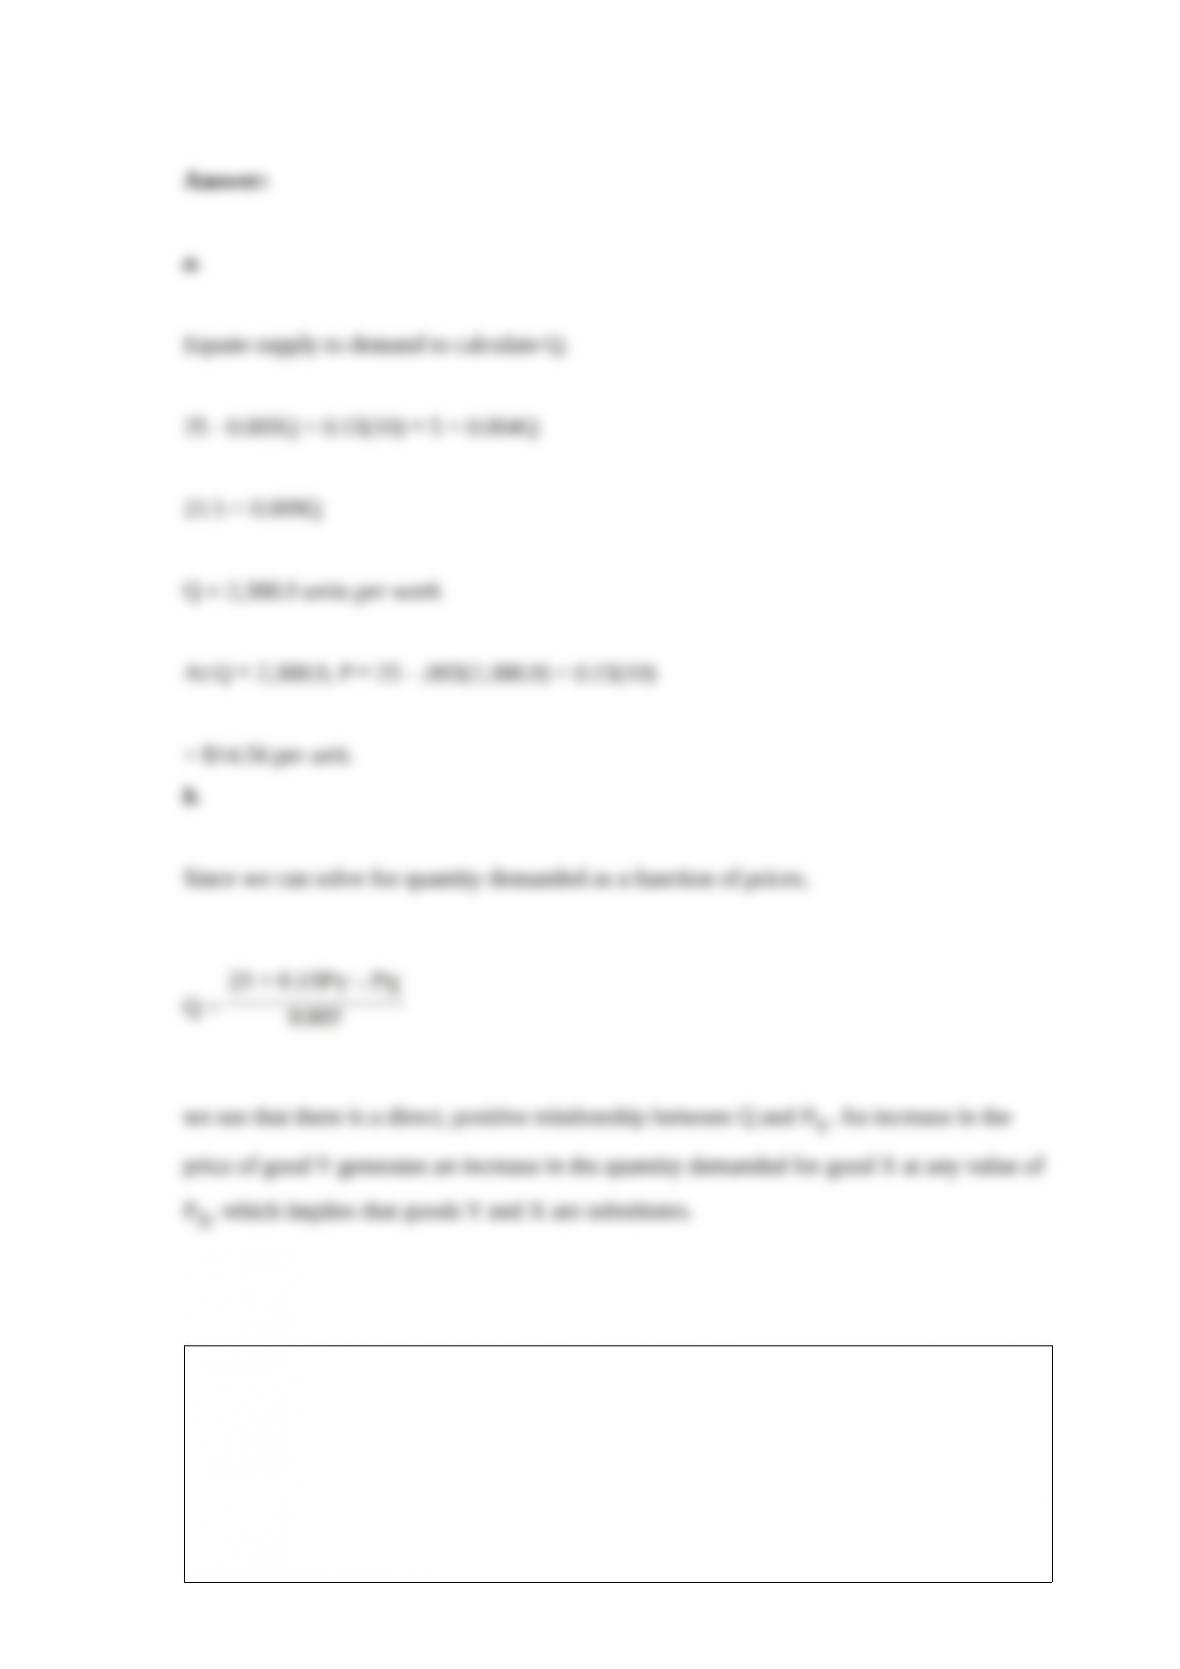
Figure 9.1

Refer to Figure 9.1. If the government establishes a price ceiling of $20, the resulting
deadweight loss will be
A) $0.
B) $20.
C) $30.
D) $300.
E) $600.
The real discount rate and the nominal discount rate differ in their treatment of
A) risk. .
B) market return.
C) inflation.
D) expected risk.
If capital is measured on the vertical axis and labor is measured on the horizontal axis,
the slope of an isoquant can be interpreted as the

A) rate at which the firm can replace capital with labor without changing the output
rate.
B) average rate at which the firm can replace capital with labor without changing the
output rate.
C) marginal product of labor.
D) marginal product of capital.
In the text, the authors present evidence that the market for free agents in professional
baseball is subject to the lemons problem. How could a prospective free agent
overcome this problem when seeking a new contract?
A) Agree to accept a lower salary with a new team.
B) Rely on standardization to avoid the asymmetric information problem.
C) Decide to negotiate only with their current team.
D) Develop a reputation as a reliable and productive player.
To enforce the optimum level of emissions a government could set an emissions
standard at the quantity
A) where the MSB curve crosses the MCA curve.

B) located at the vertical intercept of the MSB curve.
C) located at the horizontal intercept of the MSB curve.
D) located at the vertical intercept of the MCA curve.
E) located at the horizontal intercept of the MCA curve.
Scenario 3:
Consider the following information.
Melissa Qwerty was killed in a freak typewriter accident. Her family sued the
typewriter company for the value of the income loss her death represented. The family
demanded $X in compensation.
$X would be higher if Ms. Querty’s
A) income and the interest rate were higher.
B) income and the interest rate were lower.
C) income were higher and the interest rate were lower.
D) income were lower and the interest rate were higher.
E) mortality rate and growth in income were lower.

The presence of pollution in the trucking industry leads in the long run to dynamic
inefficiencies because
A) marginal external cost rises over time.
B) marginal external cost is constant over time.
C) average private cost in trucking is lower than average social cost, so that some
trucking firms remain in the industry (or are induced to enter) when efficiency calls for
them to leave (or stay out).
D) average private cost in trucking is higher than average social cost, so that some firms
trucking firms exit the industry when efficiency calls for them to stay (or for more firms
to enter).
E) fewer resources are devoted to transportation than the economy really needs.
Which of the following is true in long-run equilibrium for a firm in monopolistic
competition?
A) MC = ATC.
B) MC > ATC.
C) MC < ATC.
D) Any of the above may be true.

The market for used cars in a particular region includes both high-quality and
low-quality cars. High-quality cars are sold primarily to quality-sensitive customers,
while low-quality cars are sold to price-sensitive buyers. The submarkets for
high-quality and low-quality cars can be described by the supply and demand curves:
QD
H = 160,000 12.5PH
QS
H = – 48,000 + 13.5PH
QD
L = 110,000 – 12.5PL
QS
L = 20,000 + 10PL,
where QD
H, QS
H refer to the quantities demanded and supplied of high-quality cars,
QD
L, QS
L refer to the quantities demanded and supplied of low-quality cars, PH and PL
refer to the prices of high-quality and low-quality cars. All quantities are measured in
cars per month, prices are measured in dollars.
a. Assuming that buyers and sellers are both able to distinguish low-quality and
high-quality cars, determine the price and quantity that will prevail in each submarket.
b. Examine the case where sellers are able to accurately determine used-car quality but
buyers are not. You may assume that buyers assume that all cars are of average quality
so that an average demand curve is appropriate. Determine the price and quantity in
each submarket.
c. Using diagrams, analyze the additional developments in the market until final
long-run equilibrium is reached. You must describe the eventual outcome, but no
calculations are required for this part of the problem.
Equating QD
QD
A = 135,000 – 12.5P

Which of the following is NOT an example of consumer behavior consistent with the
standard assumptions of microeconomic theory?
A) A concern for fairness can influence purchasing patterns.
B) When demand increases, all else being equal, consumers expect price to rise.
C) After a snowstorm, the demand for snow shovels increases.
D) Snow shovels and snow plows are substitute goods.
E) none of the above
An increase in technology that enhances labor productivity will likely result in:
A) a decrease in labor employment and an increase in the wage rate.
B) an increase in labor employment and an increase in the wage rate.
C) a decrease in labor employment and a decrease in the wage rate.
D) an increase in labor employment and a decrease in the wage rate.
E) employers using less labor and more capital while the wage effect is unknown.

Collusion can earn higher prices and higher profits under the Bertrand model, but why
is this an unlikely outcome in practice?
A) Firms prefer to remain independent of other firms so that their pricing plans can be
more flexible over time.
B) The collusive firms have an incentive to gain market share at the expense of the
other firms by cutting prices.
C) The federal antitrust authorities have an easier time catching firms that collude on
price rather than quantity.
D) none of the above
Scenario 4.4:
The demand curve for the new computer game, Rock and Roll Trivia, is given as
follows:
Q = 200 – 5P – .1Pc – .5Pd + .2A – I
where P is the price of the game
Pc is the price of a computer
Pd is the price of a diskette
A is the level of advertising
Q is the level of incomeSee the information in Scenario 4.4. Suppose P = 10, Pc = 100,
Pd = 2, A = 5, and I = 50. What is the income elasticity of demand?
A) 0
B) 5/9
C) 1

D) 9/5
E) none of the above
Which of the following functions is least likely to represent a real demand curve?
A) Q = 120 – 2P
B) Q = 120 – 3P + 2I
C) Q = 120/P
D) Q = 120 + 3P – 2I
E) Q = 120/(Pa + Pb)
Suppose the private marginal cost of pumping water from an aquifer remains constant
as the quantity of water pumped increases, and the marginal social cost is upward
sloping. If the demand for water shifts to the right as population increases, then the
amount of water pumped based only on private costs ________ and the social cost of
the common property resource ________.
A) decreases, decreases.
B) decreases, increases
C) increases, decreases

D) increases, increases
Which of the following is NOT an assumption regarding people’s preferences in the
theory of consumer behavior?
A) Preferences are complete.
B) Preferences are transitive.
C) Consumers prefer more of a good to less.
D) All of the above are basic assumptions about consumer preferences.
The inverse demand curve for product X is given by:
PX = 25 – 0.005Q + 0.15PY,
where PX represents price in dollars per unit, Q represents rate of sales in pounds per
week, and PY represents selling price of another product Y in dollars per unit. The
inverse supply curve of product X is given by: PX = 5 + 0.004Q.
a. Determine the equilibrium price and sales of X. Let PY = $10.
b. Determine whether X and Y are substitutes or complements.
The budget constraint for a consumer who only buys apples (A) and bananas (B) is PAA
+ PBB = I where consumer income is I, the price of apples is PA, and the price of
bananas is PB. To plot this budget constraint in a figure with apples on the horizontal
axis, we should use a budget line represented by the slope-intercept equation:
A) A = -I/PA + (PB/PA)B

B) A = I/PA – (PB/PA)B
C) B = -I/PB + (PA/PB)A
D) B = I/PB – (PA/PB)A
You operate a car detailing business with a fixed amount of machinery (capital), but you
have recently altered the number of workers that you employ per hour. Three employees
can generate an average product of 4 cars per person in each hour, and five employees
can generate an average product of 3 cars per person in each hour. What is the marginal
product of labor as you increase the labor from three to five employees?
A) MP = 3 cars
B) MP = 1.5 cars
C) MP = 15 cars
D) MP = -1 cars