Consider the following statements:
a. Consumers rent more DVDs from a video store that rents DVDs at a lower price than
other rival video stores in the area.
b. Department stores take steps to increase security since they believe it is more costly
to allow shoplifting than to install expensive security monitoring equipment.
c. Farmers produce more cotton when its selling price falls. Which of the above
statements demonstrates that economic agents respond to incentives?
A) a only
B) b only
C) c only
D) a and b
E) a, b, and c
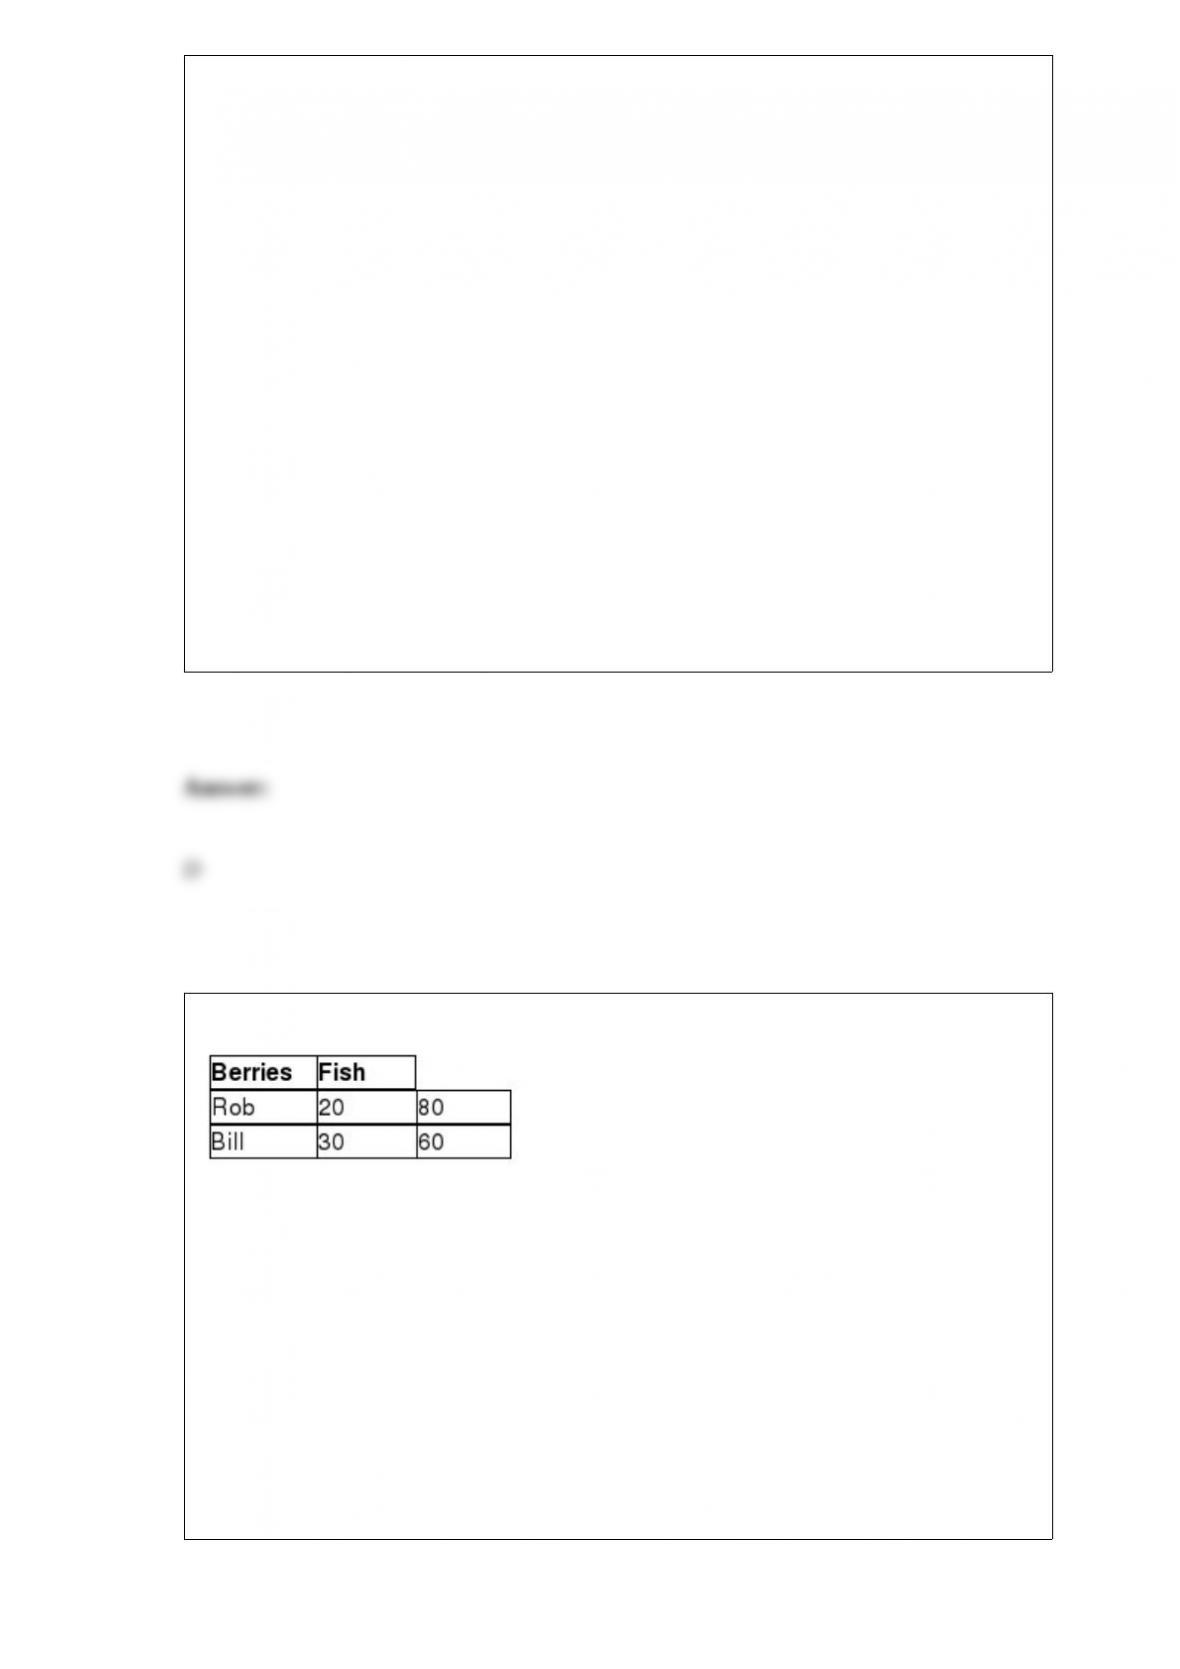
Table 7-1
Rob Crusoe and Bill Friday spent their week-long vacation on a desert island where
they had to find and make their own food. Rob and Bill spent one day each fishing and
picking berries. The table lists the pounds of output Rob and Bill produced. Use the
table above to select the statement that accurately interprets the data in the table.
A) Rob has a comparative advantage in catching fish.
B) Bill has an absolute advantage in catching fish.
C) Bill has a comparative advantage in catching fish.
D) Rob has a comparative advantage in picking berries and catching fish.

The experience of Paul Volcker’s fight against inflation during the late 1970s and early
1980s indicates that firms and workers may have
A) had adaptive expectations.
B) had rational expectations but didn’t trust Fed announcements.
C) preferred high unemployment to high inflation.
D) Both A and B are correct answers.
If real GDP grows by 3% in 2011, 3.2% in 2012, and 2.5% in 2013, what is the average
annual growth rate of real GDP?
A) 2.6%
B) 2.9%
C) 3.1%
D) 4.2%

Which of the following is not one of the ways that the German government ended the
hyperinflation of the 1920s?
A) negotiating a new agreement with the Allies (the United States, Great Britain,
France, and Italy) that reduced its reparations payments
B) reducing government expenditures and raising taxes to balance its budget
C) raising the required reserve ratio to reduce bank loans
D) replacing the existing mark with a new mark
Which of the following statements is generally true?
A) Rivalry is less the larger the number of firms in an industry.
B) The smaller the number of firms in an industry, the greater the rivalry.
C) The larger the number of firms in an industry, the greater the rivalry.
D) The degree of rivalry in an industry is largely independent of the number of firms.
In the United States in 2013, the Bureau of Economic Analysis began counting
spending on research and development as ________, which counts as a part of GDP.
A) investment
B) consumption
C) depreciation

D) intermediate goods
According to ________, the economy is normally at potential GDP.
A) the short-run Phillips curve
B) the adaptive expectations theory
C) new Keynesian economists
D) real business cycle models
An increase in United States net foreign direct investment would occur if
A) United States citizens have increased the value of foreign stocks and bonds they
own.
B) United States citizens have increased their building or purchasing of facilities in
foreign countries.
C) net foreign investment increases.
D) net capital flows decrease.
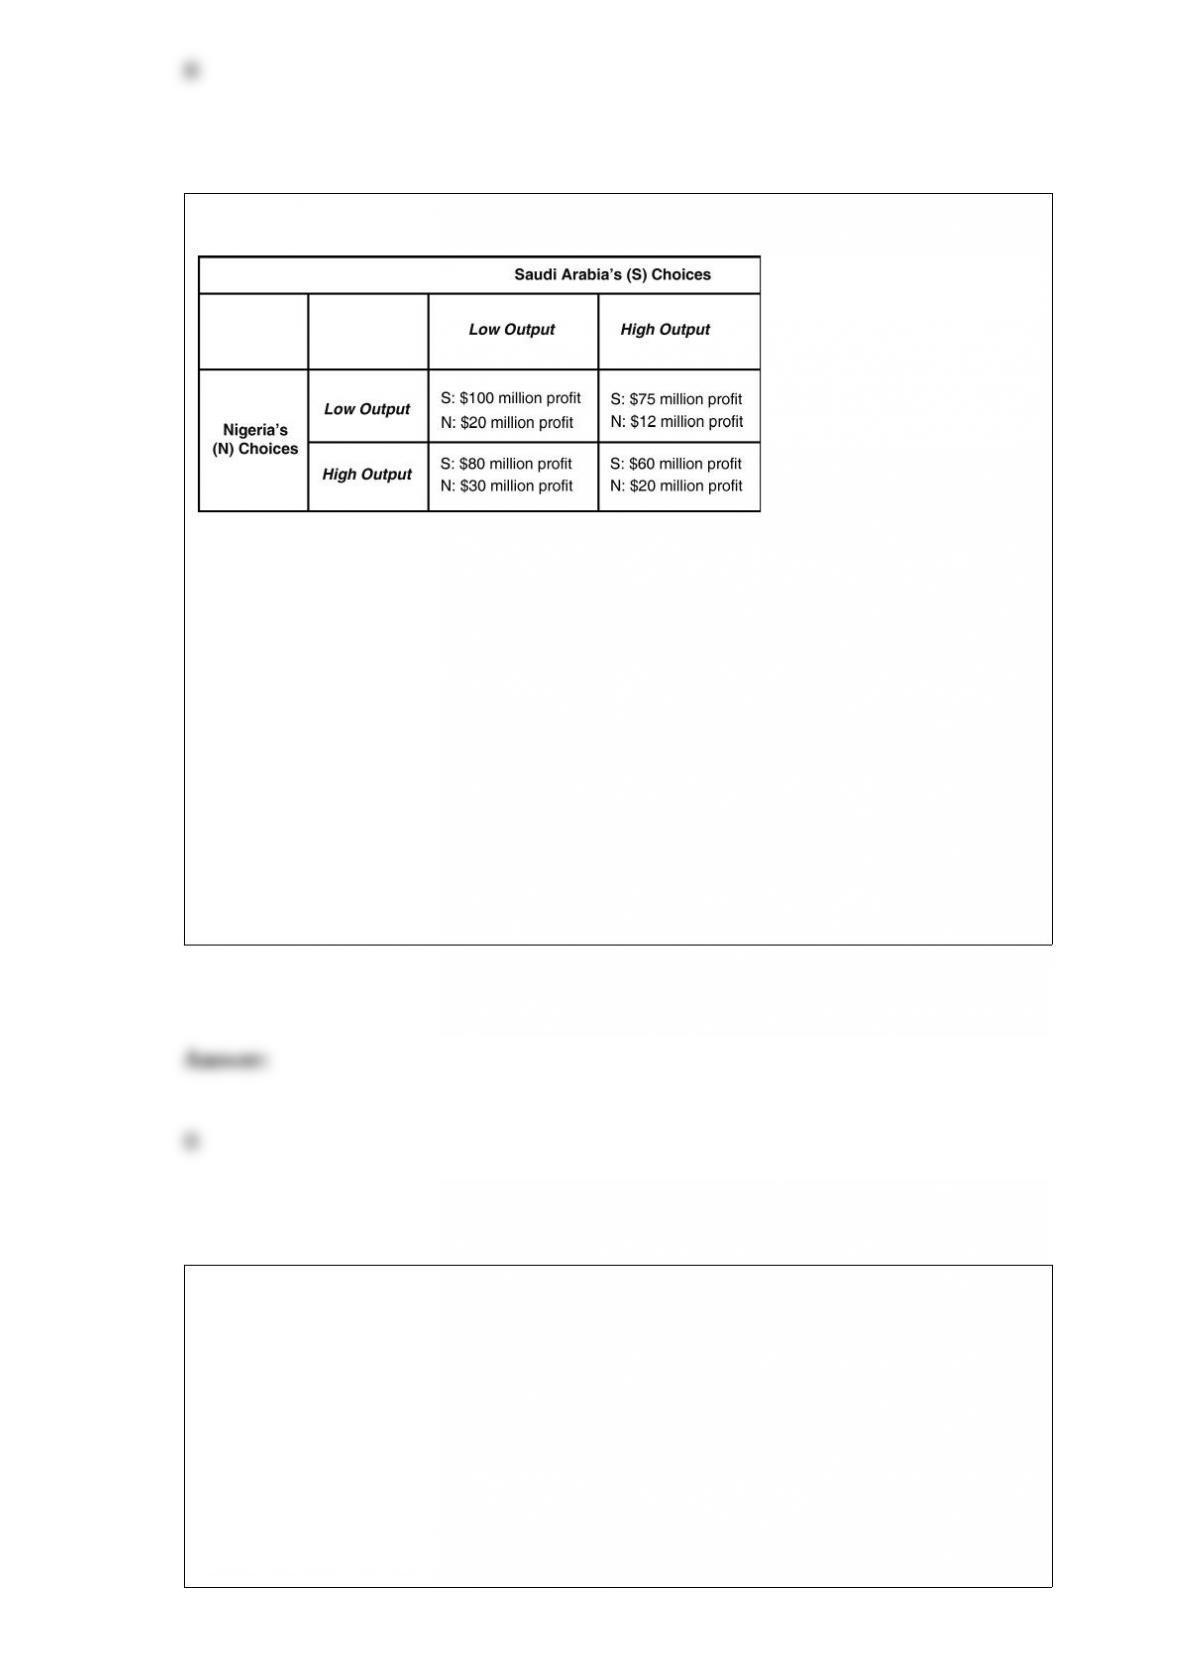
Table 14-3
Suppose OPEC has only
two producers, Saudi Arabia and Nigeria. Saudi Arabia has far more oil reserves and is
the lower cost producer compared to Nigeria. The payoff matrix in Table 14-3 shows
the profits earned per day by each country. “Low output” corresponds to producing the
OPEC assigned quota and “high output” corresponds to producing the maximum
capacity beyond the assigned quota. Is there a dominant strategy for Saudi Arabia and,
if so, what is it?
A) Yes, the dominant strategy is to produce a high output.
B) Yes, the dominant strategy is to produce a low output.
C) No, there is no dominant strategy.
D) Yes, it has a dominant strategy depending on what Nigeria does.
Which of the following statements best represents the opinion of many economists
regarding the impact that changes in tax laws have had on recent changes in income
inequality in the United States?
A) Reductions in income tax rates have favored high-income individuals more than
low-income individuals. As a result, reductions in federal income tax rates have led to
more income inequality.
B) Reductions in income tax rates have created greater incentives for low-income
individuals to work, save and invest. As a result, reductions in federal income tax rates
have led to less income inequality.
C) Reductions in income tax rates probably have had little impact on the distribution of
income.
D) Reductions in income tax rates have been offset by increases in corporate income tax
rates and payroll taxes. As a result, greater income inequality in the 1990s has been
followed by a more equal distribution of income since 2001.
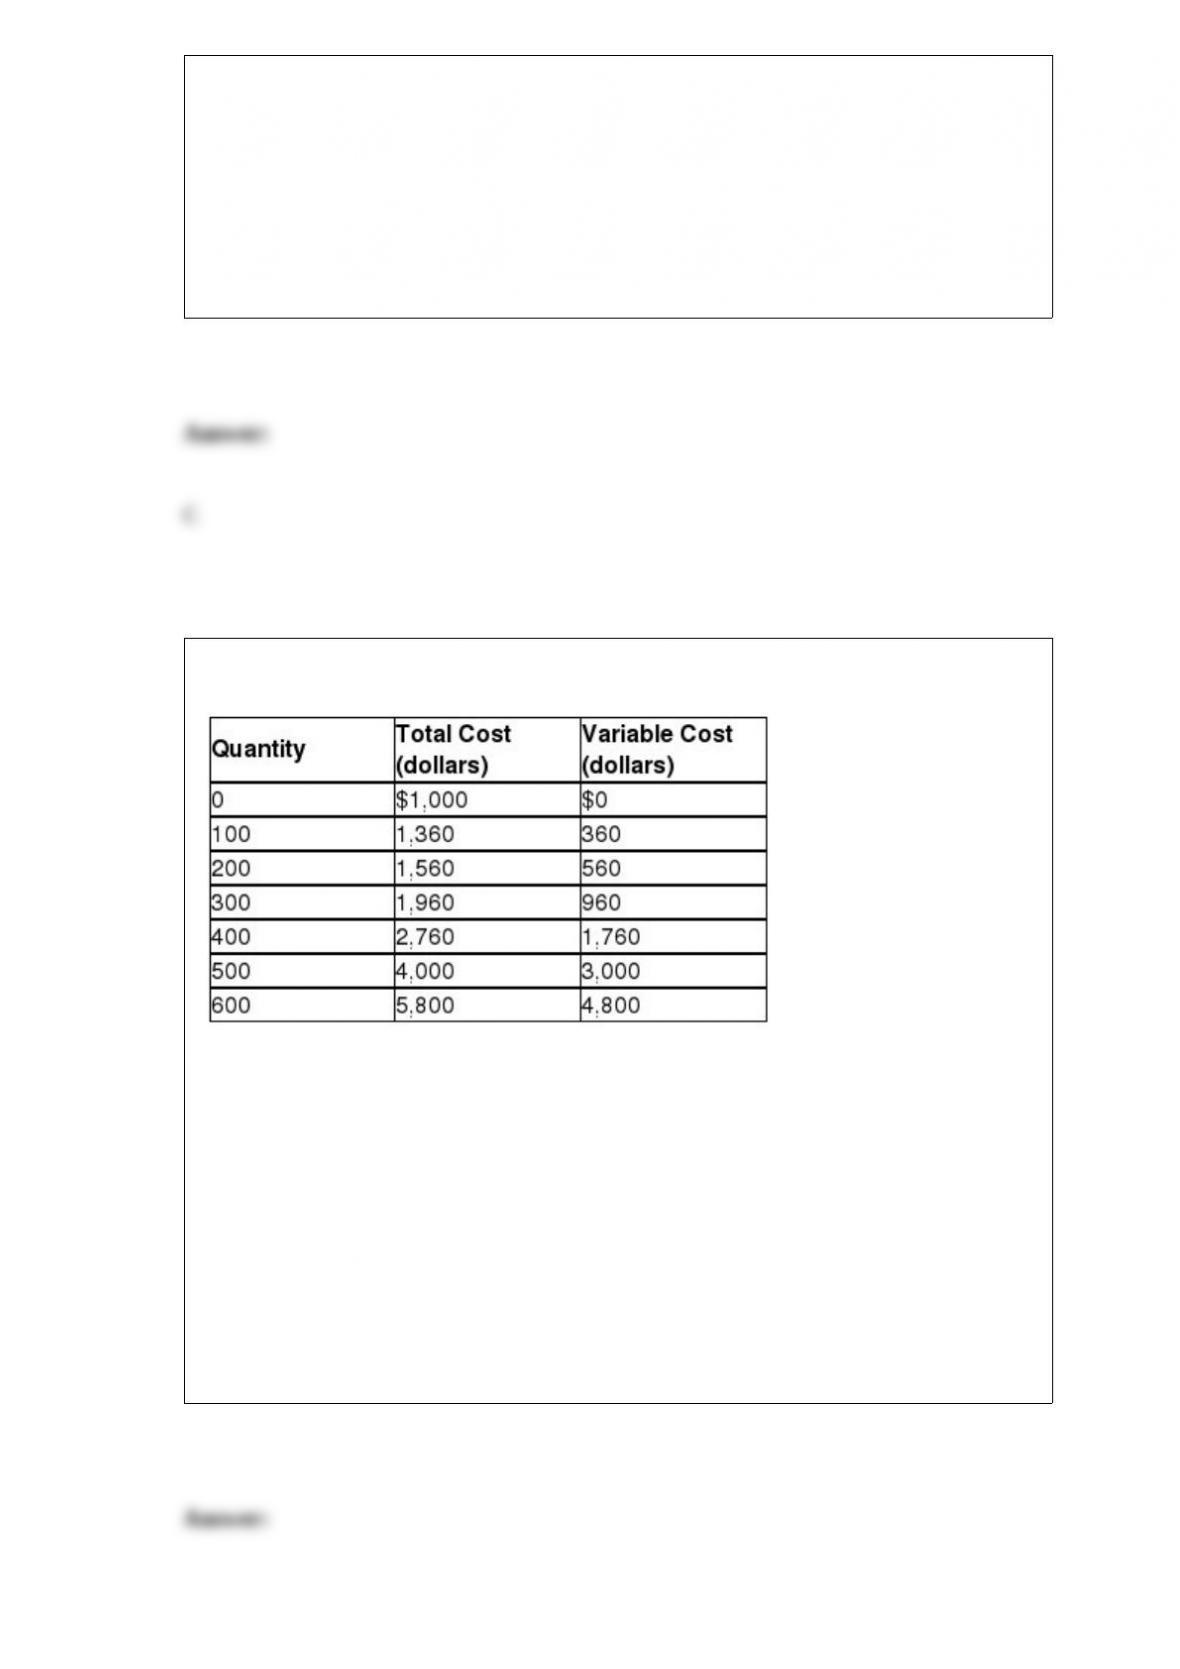
Table 12-1
Table 12-1 shows the short-run cost data of a perfectly competitive firm that produces
plastic camera cases. Assume that output can only be increased in batches of 100 units.
If the market price of each camera case is $8 and the firm maximizes profit, what is the
amount of the firm’s profit or loss?
A) $0 (it breaks even)
B) loss of $1,000
C) profit of $440
D) loss of $440
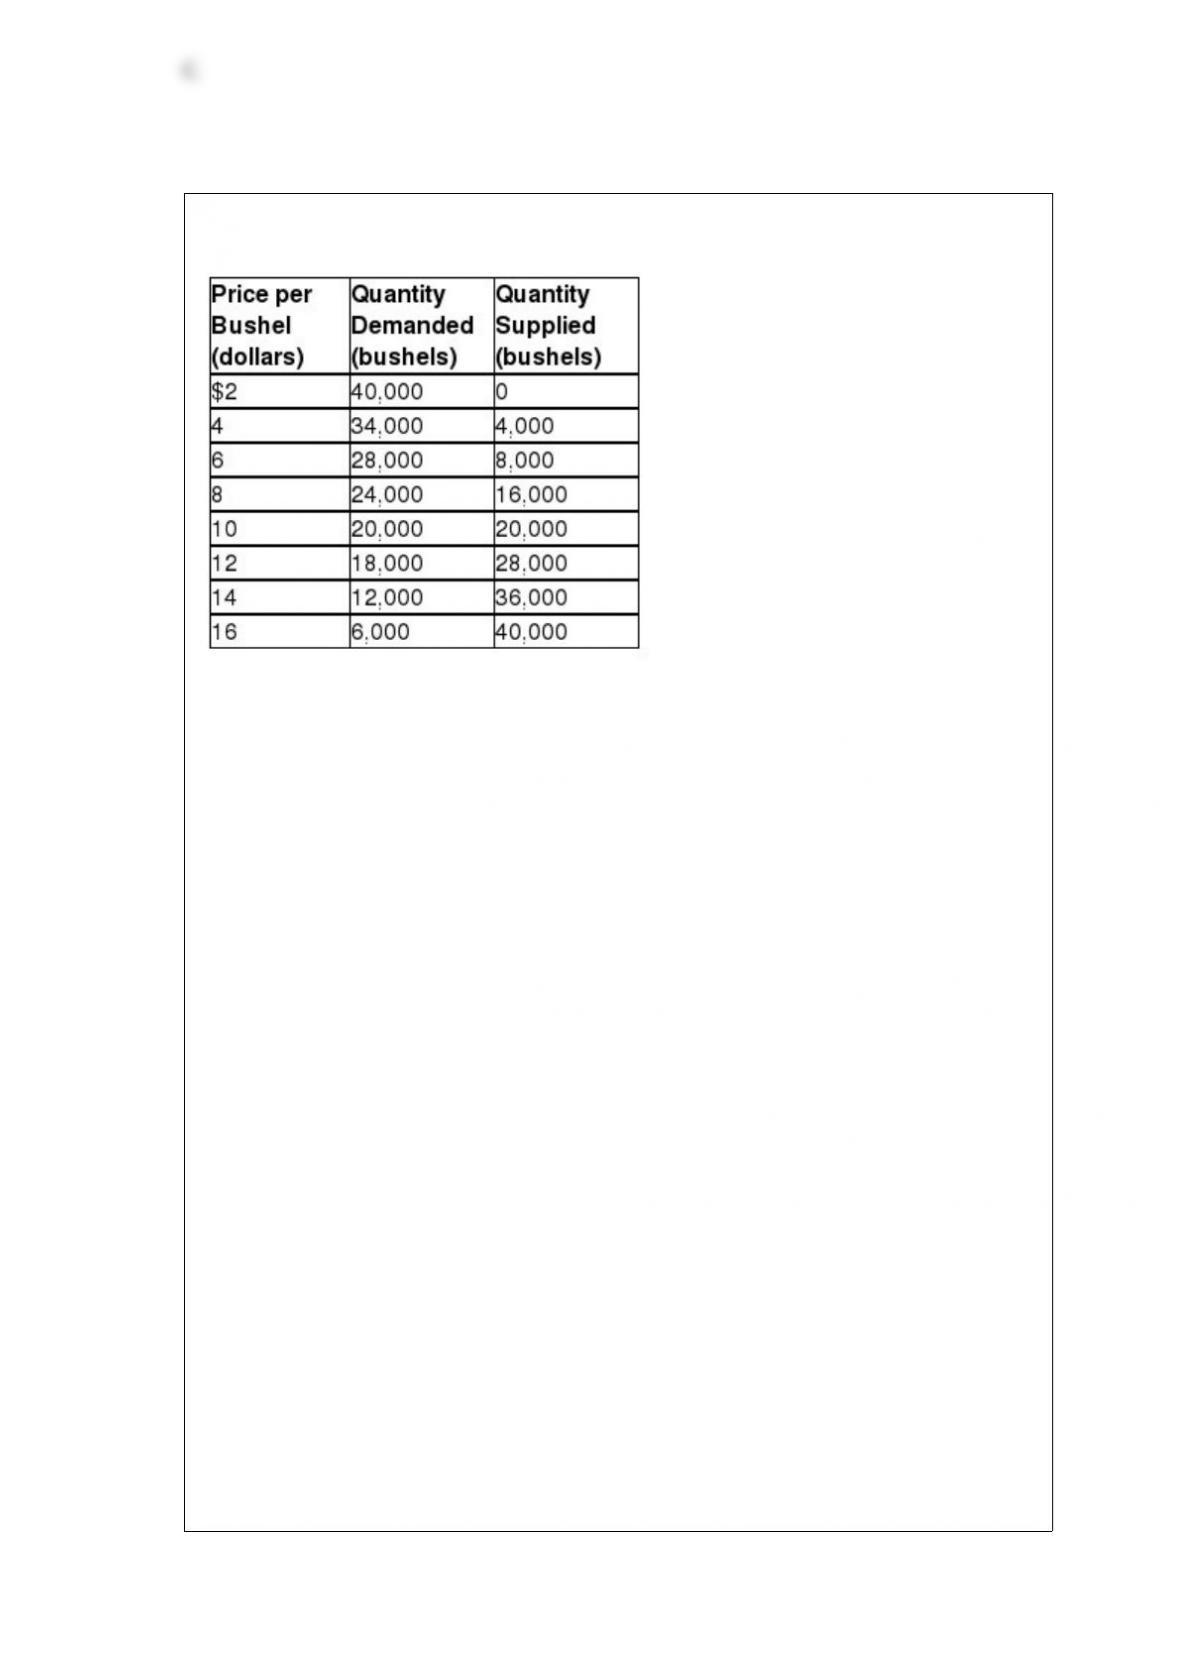
Table 4-9
Table 4-9 above contains information about the corn market. Answer the following
questions based on this table.
An agricultural price floor is a price that the government guarantees farmers will
receive for a particular crop. Suppose the federal government sets a price floor for corn
at $12 per bushel.
a. What is the amount of shortage or surplus in the corn market as result of the price
floor?
b. If the government agrees to purchase any surplus output at $12, how much will it
cost the government?
c. If the government buys all of the farmers’ output at the floor price, how many bushels
of corn will it have to purchase and how much will it cost the government?
d. Suppose the government buys up all of the farmers’ output at the floor price and then
sells the output to consumers at whatever price it can get. Under this scheme, what is
the price at which the government will be able to sell off all of the output it had
purchased from farmers? What is the revenue received from the government’s sale?
e. In this problem we have considered two government schemes: (1) a price floor is
established and the government purchases any excess output and (2) the government
buys all the farmers’ output at the floor price and resells at whatever price it can get.
Which scheme will taxpayers prefer?
f. Consider again the two schemes. Which scheme will the farmers prefer?
g. Consider again the two schemes. Which scheme will corn buyers prefer?
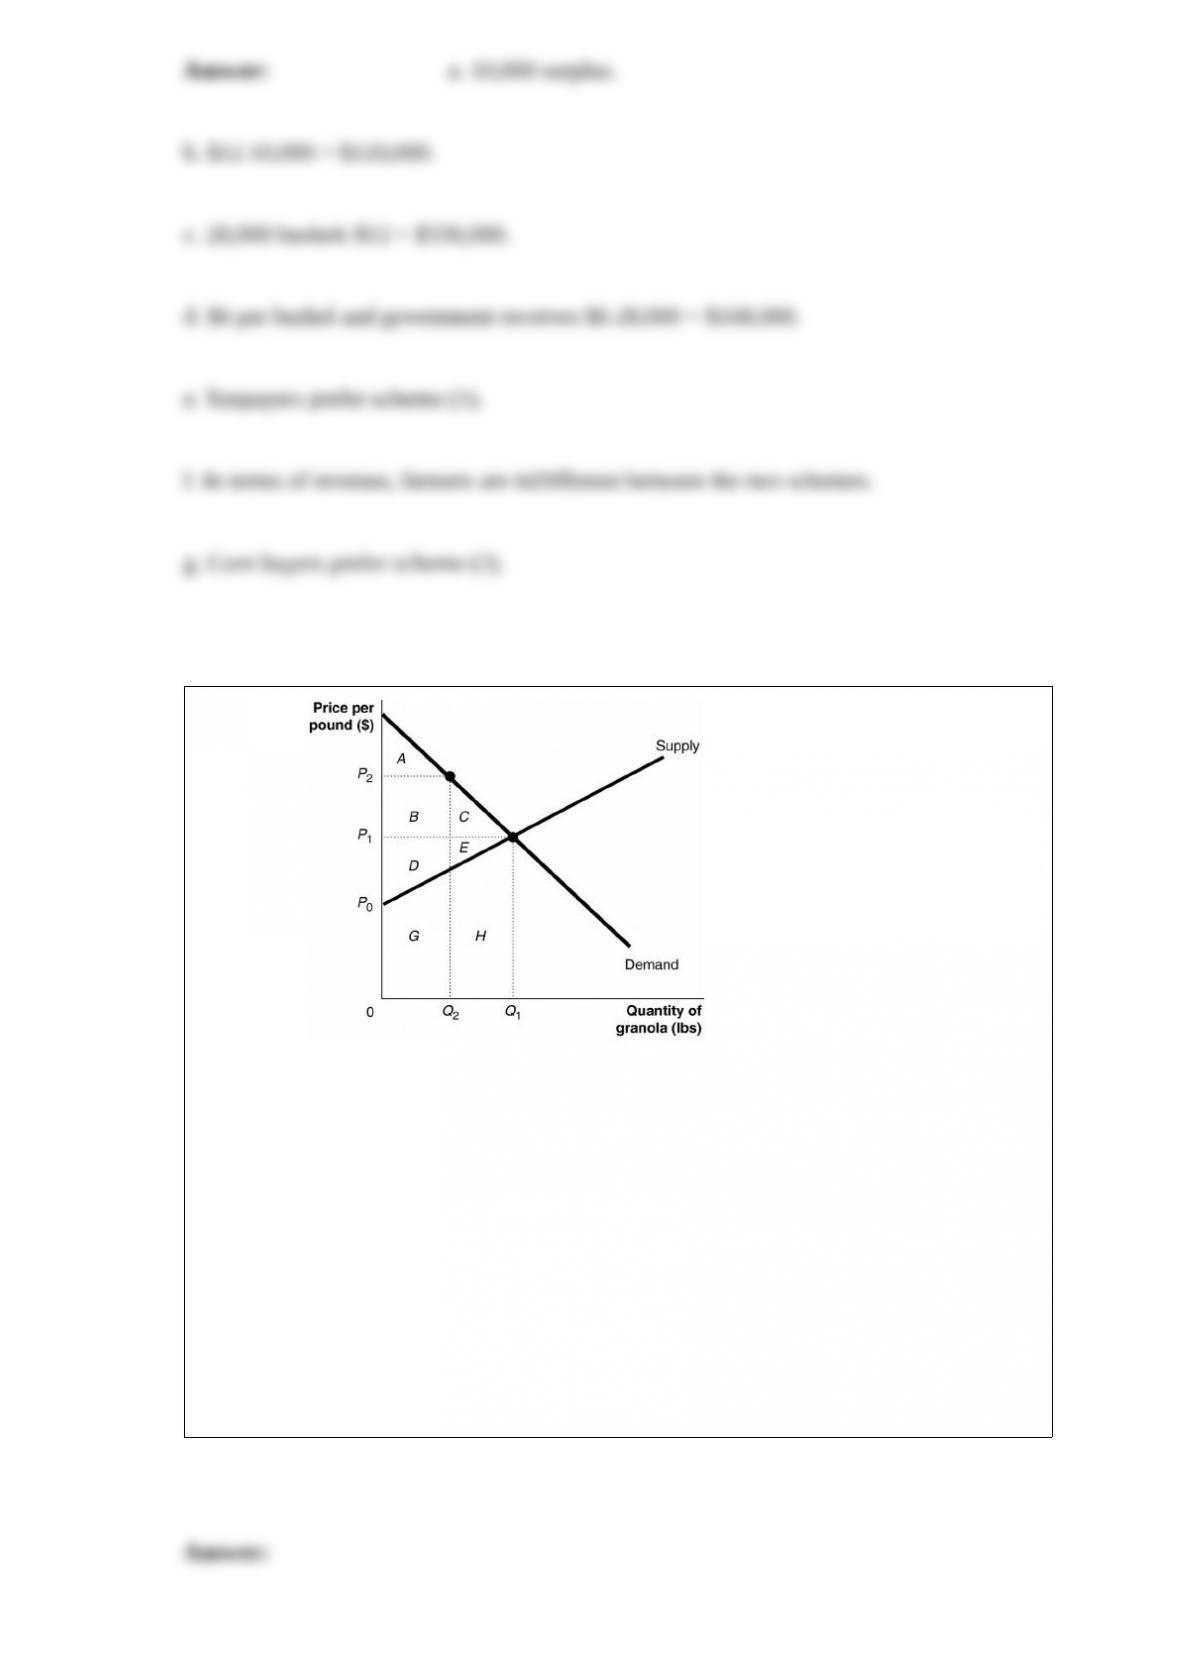
Figure 4-6 Figure 4-6 shows the market for
granola. The market is initially in equilibrium at a price of P1 and a quantity of Q1.
Now suppose producers decide to cut output to Q2 in order to raise the price to P2.
What area represents consumer surplus at P2?
A) A
B) A + B
C) B + C
D) A + B + D + E
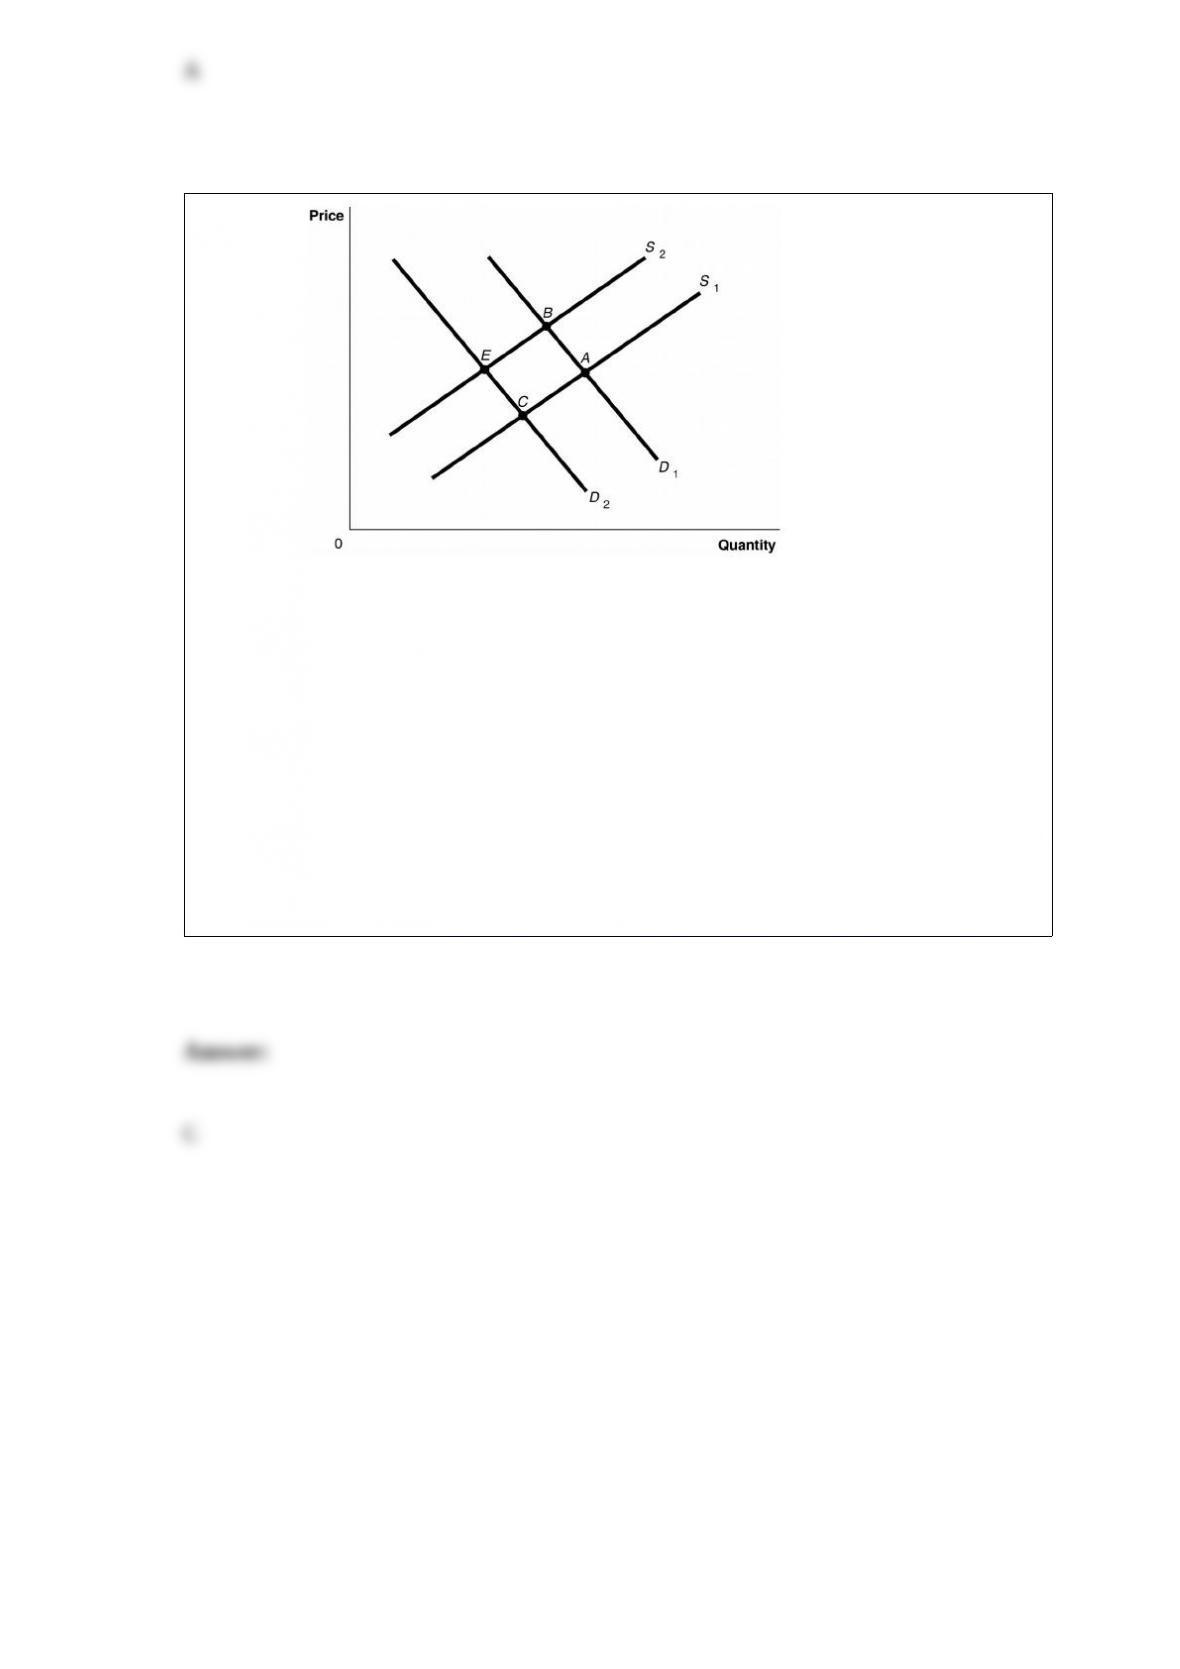
Figure 3-8
The graph in this figure illustrates an initial competitive equilibrium in the market for
apples at the intersection of D1 and S1 (point A). If there is a shortage of apples how
will the equilibrium point change?
A) The equilibrium point will move from A to B.
B) The equilibrium point will move from A to C.
C) There will be no change in the equilibrium point.
D) The equilibrium point will move from A to E.