
A new tool that the Fed started using in late 2008 was that it began to pay interest on the
reserves banks hold in their federal reserve accounts.
The change in cost resulting from producing one additional unit of output is
Suppose the same basket of goods costs $200 in the U.S. and 100 pounds in Britain and
that the exchange rate is $3 per pound. According to purchasing power parity, if the two
countries’ price levels do not change, what will happen to exchange rate?
a. The pound would appreciate until the exchange rate reaches $3 per pound.
b. The pound would depreciate until the exchange rate reaches $2 per pound.
c. The pound would depreciate until the exchange rate reaches $0.50 per pound.
d. The dollar price of a pound would remain at $10.
e. The pound would appreciate until the exchange rate reaches $4 per pound.
The monopolistic competitor in Figure 11-4 will maximize its economic profits, or
minimize its losses, by
Suppose that the income elasticity of demand for college education is 1.3. This
indicates that
The lower the price of a foreign currency, the more expensive that foreign country’s
goods and services are to individuals in the domestic economy.
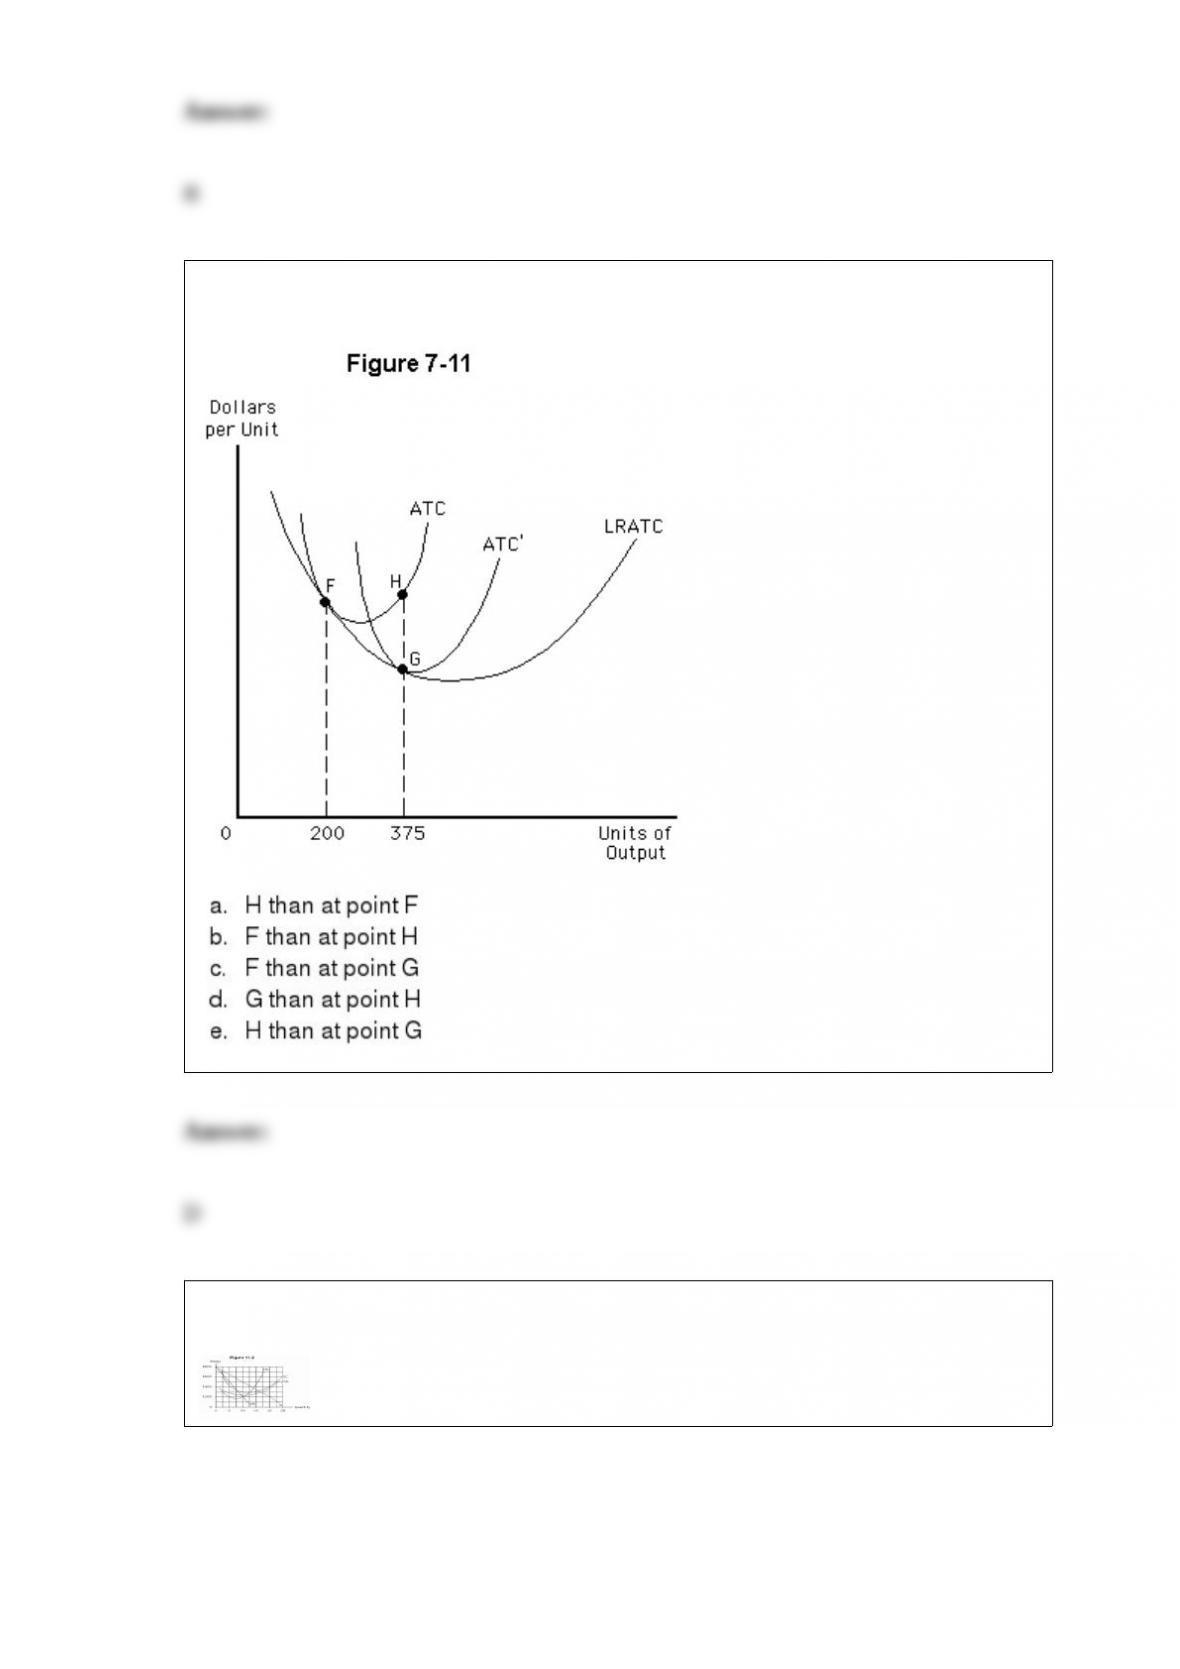
The firm depicted in Figure 7-11 has a larger plant size at point
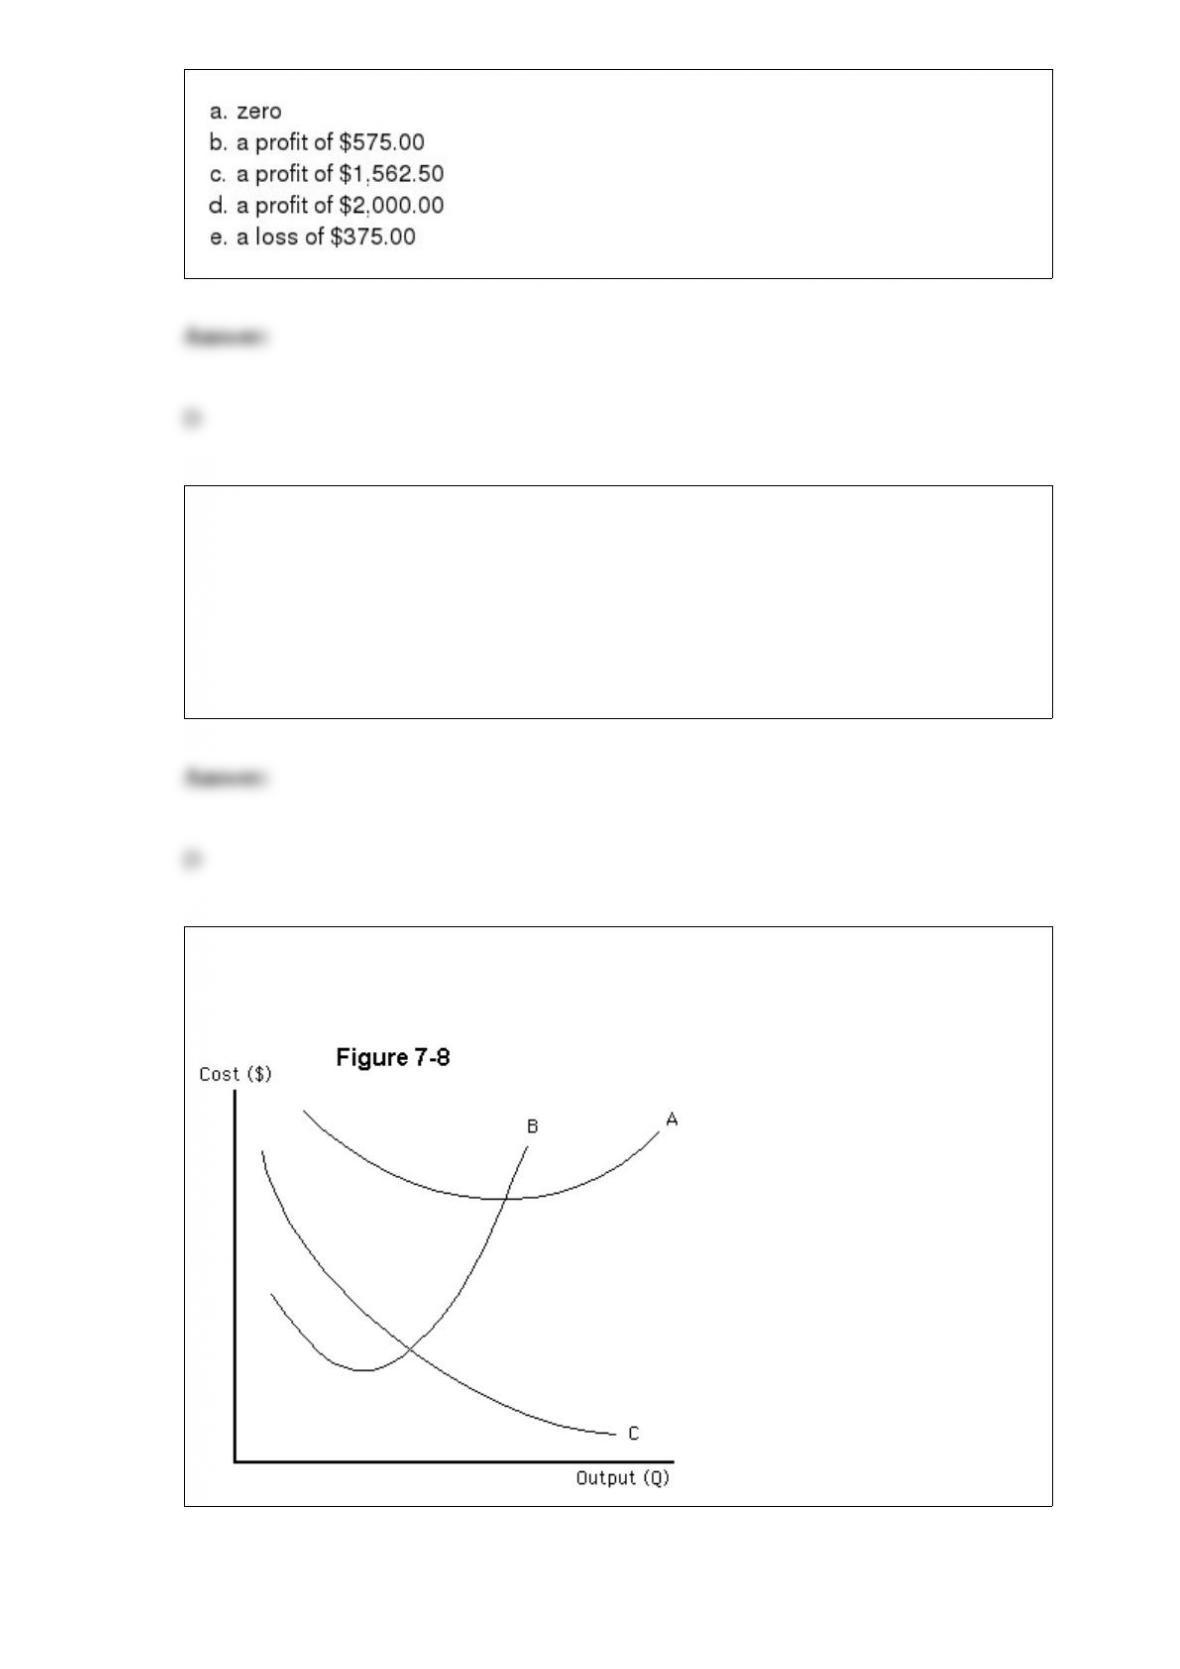
The maximum total economic profit, or minimum economic loss, for the
monopolistically competitive firm in Figure 11-2 is
What would happen if the Fed tried to keep employment above the full-employment
level?
a. The long-run aggregate supply curve would shift to the right.
b. The aggregate supply curve would shift downward.
c. Unemployment would increase.
d. The price level would increase.
e. The aggregate demand curve would shift to the left.
Figure 7-8 shows three different cost curves, labeled A, B, and C, for a firm. Which of
these curves could most likely represent average total cost?
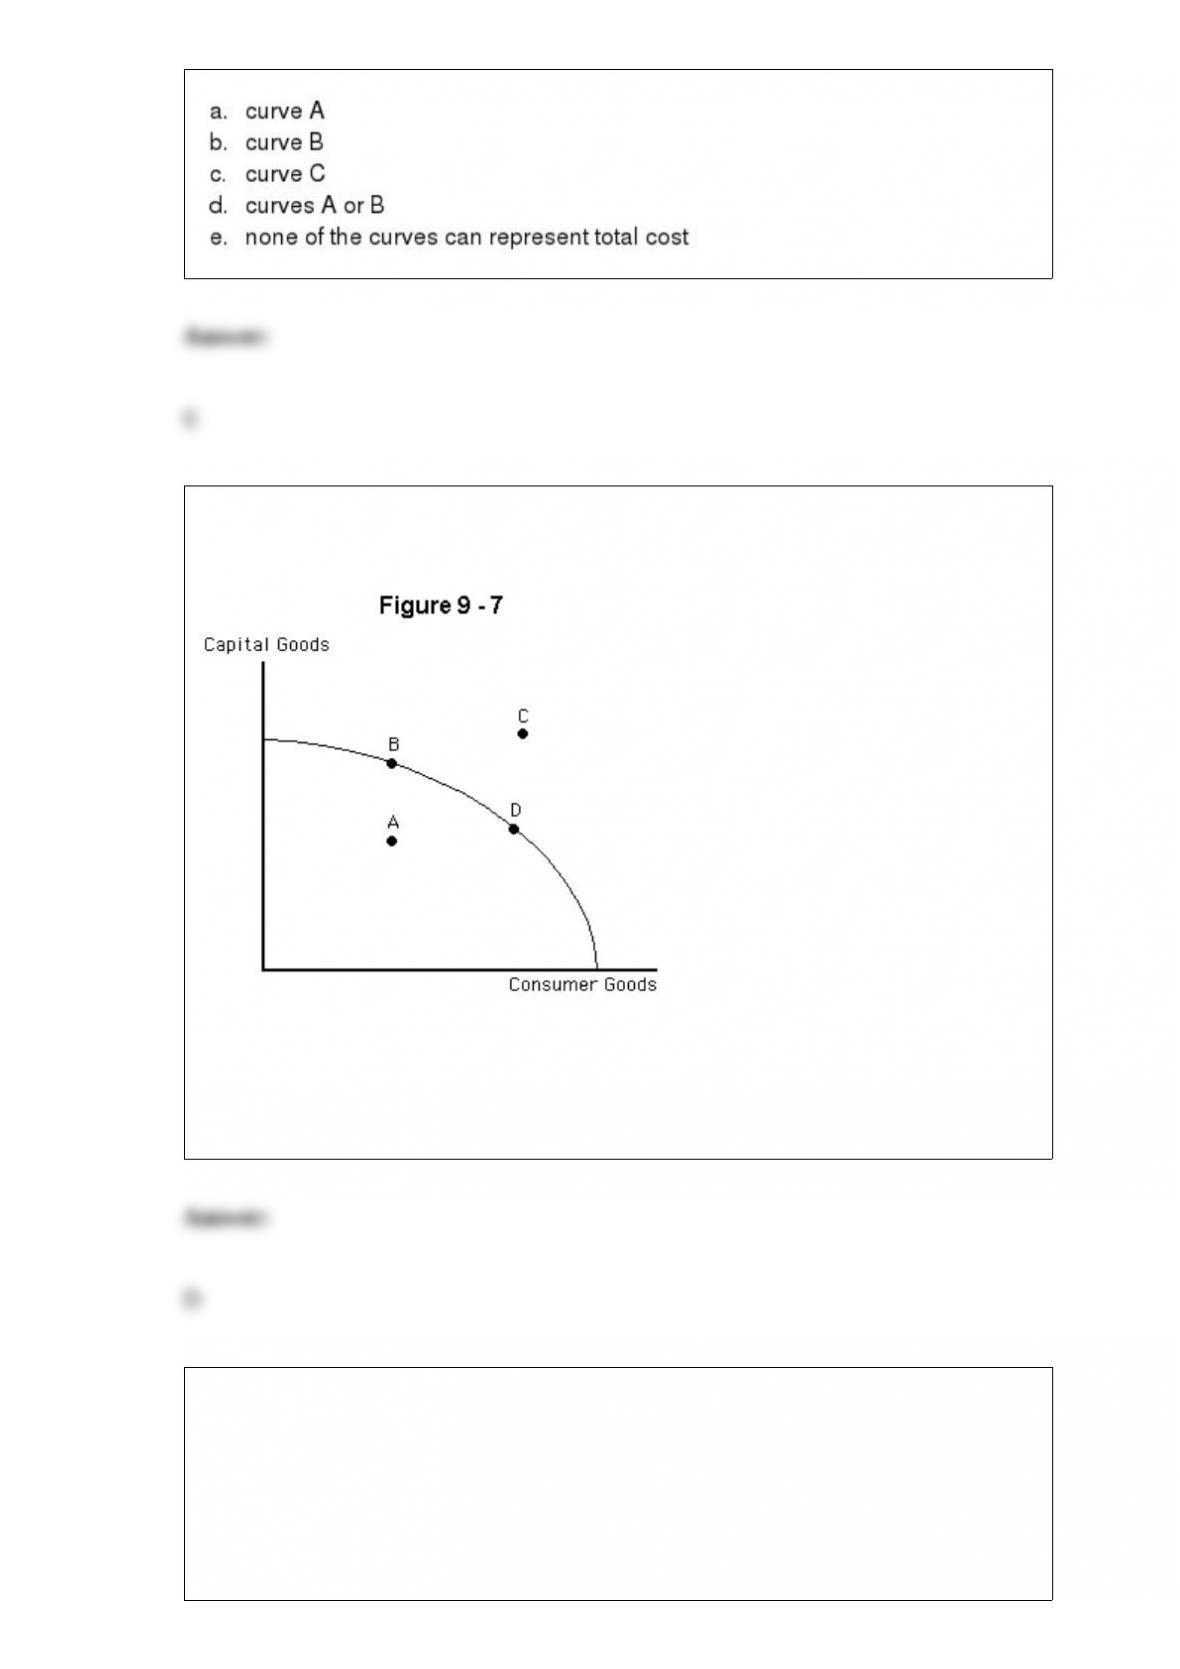
Refer to Figure 9-7. Everything else equal, which efficient production point will result
in the least economic growth?
a. A
b. B
c. C
d. D
e. all points would promote growth equally
If autonomous consumption decreases, which of the following combinations of events
would be most likely to occur?
a. An upward shift of the aggregate expenditure line, a rightward shift of the money
demand curve, and a leftward shift of the aggregate demand curve
b. A downward shift of the aggregate expenditure line, a leftward shift of the money
demand curve, and a leftward shift of the aggregate demand curve
c. A downward shift of the aggregate expenditure line, a leftward shift of the money
demand curve, and a rightward shift of the aggregate demand curve
d. A downward shift of the aggregate expenditure line, a rightward shift of the money
demand curve, and a rightward shift of the aggregate demand curve
e. An upward shift of the aggregate expenditure line, a rightward shift of the money
demand curve, and a rightward shift of the aggregate demand curve.
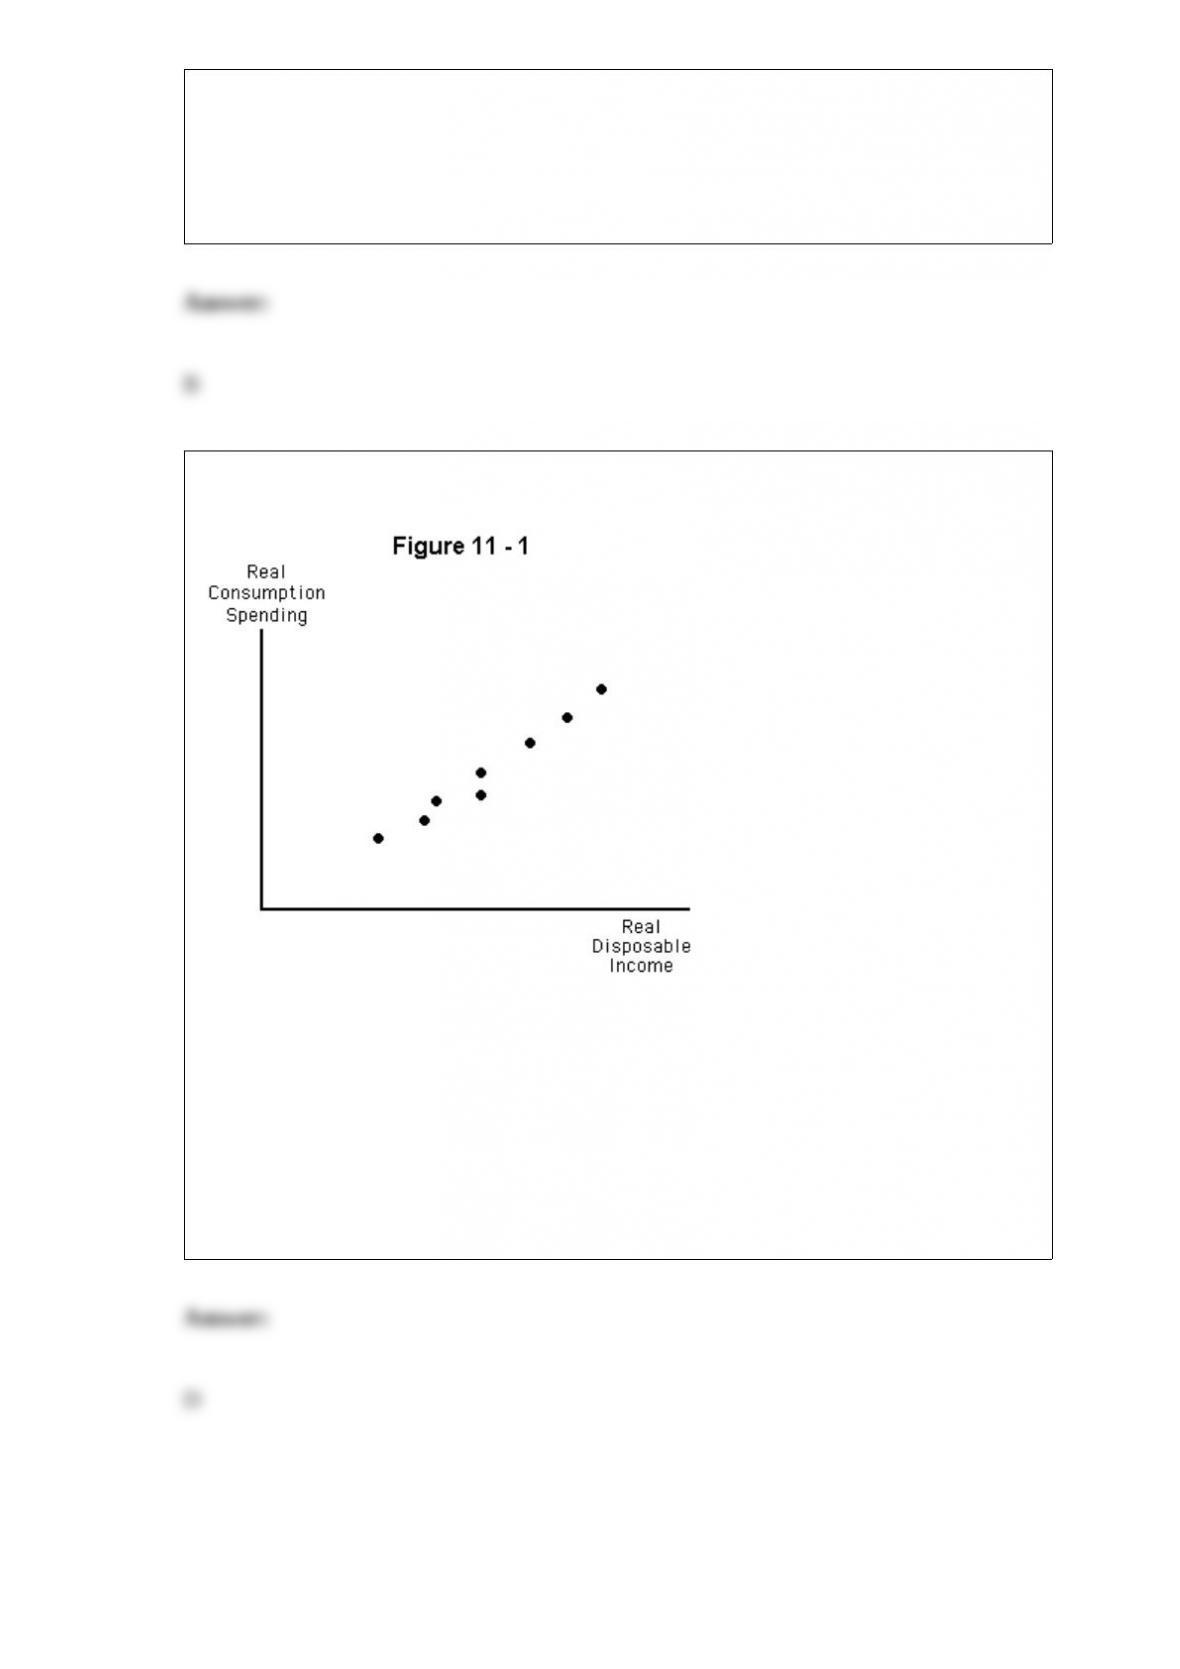
Refer to Figure 11-1. The graph shows
a. a negative and relatively stable relationship between real consumption and real
disposable income
b. a negative, but unstable, relationship between real consumption and real disposable
income
c. a positive, but unstable, relationship between real consumption and real disposable
income
d. a positive and relatively stable relationship between real consumption and real
disposable income
e. no discernible relationship between real consumption and real disposable income