
Which of the following events would increase the price elasticity of demand for
Chicago Bears tickets that sell at a price of $20?
a. b and c.
b. The Bears are having a successful season.
c. The visiting team is having a successful season.
d. The Bears have been defeated in their previous seven games.
e. The weather on game day will be warm.
When the production possibilities curve is bowed out, resources are:
a. equally well-suited to production of both goods.
b. not being used efficiently.
c. not equally suited to the production of both types of goods.
d. increasing as more of one good is produced.
e. of an inferior quality.
Exhibit 12-9 Negative Income Tax
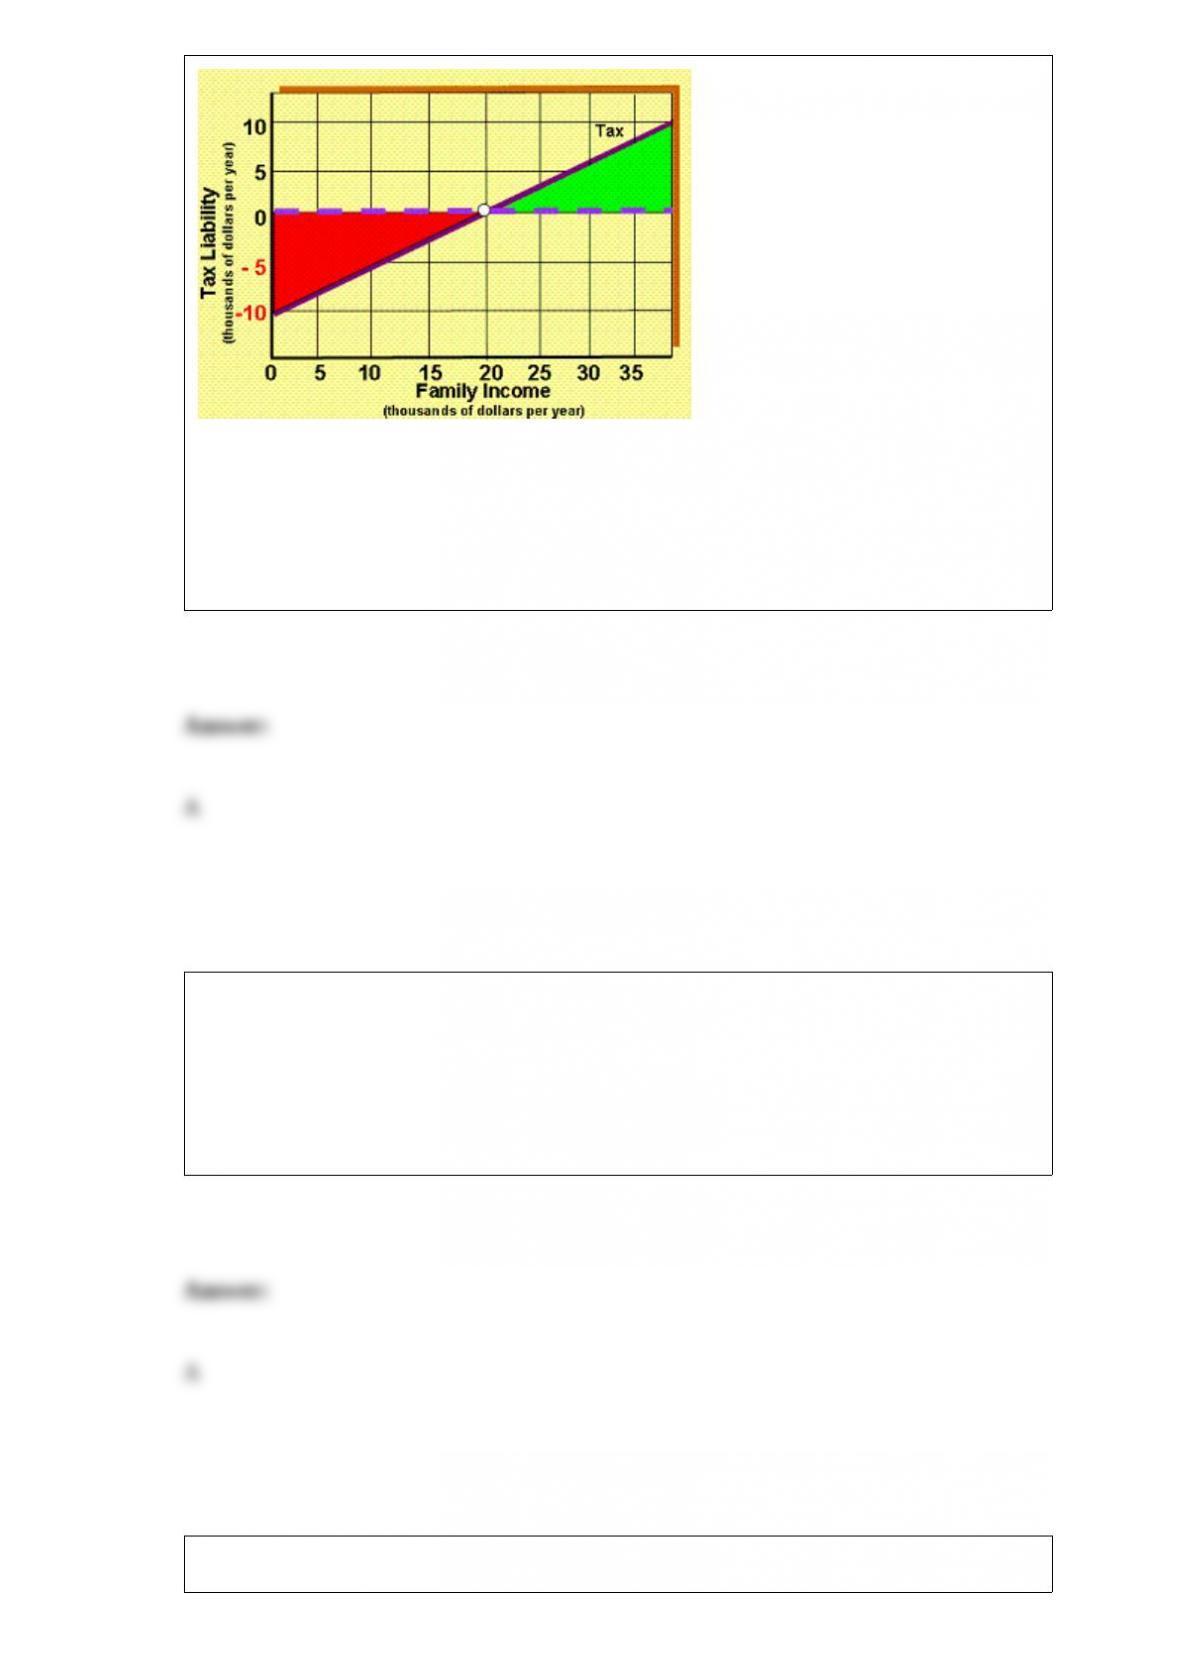
As shown in Exhibit 12-9, a family of four with an income of $20,000 receives ____
from the government:
a. zero payment
b. the break-even income of $20,000
c. a $10,000 payment
d. a $10,000 tax deferment
Maximizing profit means finding the maximum difference between:
a. TR and TC.
b. MR and MC.
c. price and ATC.
d. price and AR.
e. ATC and MC.
A competitive car wash currently hires 4 workers, who together can wash 80 cars per

day. The market price of car washes is $5 per wash, and the price of workers is $60 per
day. The car wash should hire a fifth worker if it would increase total production to at
least:
a. 92 cars per day.
b. 100 cars per day.
c. 104 cars per day.
d. 110 cars per day.
When there is market failure due to a negative externality,
a. innocent people will suffer since it cannot be corrected.
b. setting price equal to marginal social cost will solve it.
c. the free market produces too little output.
d. externalities have been taken into account.
e. the best solution eliminates the externality entirely.
The optimal level of pollution is:
a. the level at which the marginal social cost of air quality equals the marginal social
benefit.
b. the level at which the average social cost of air quality equals the average social
benefit.
c. the level at which the total social cost of air quality equals the total social benefit.
d. zero.
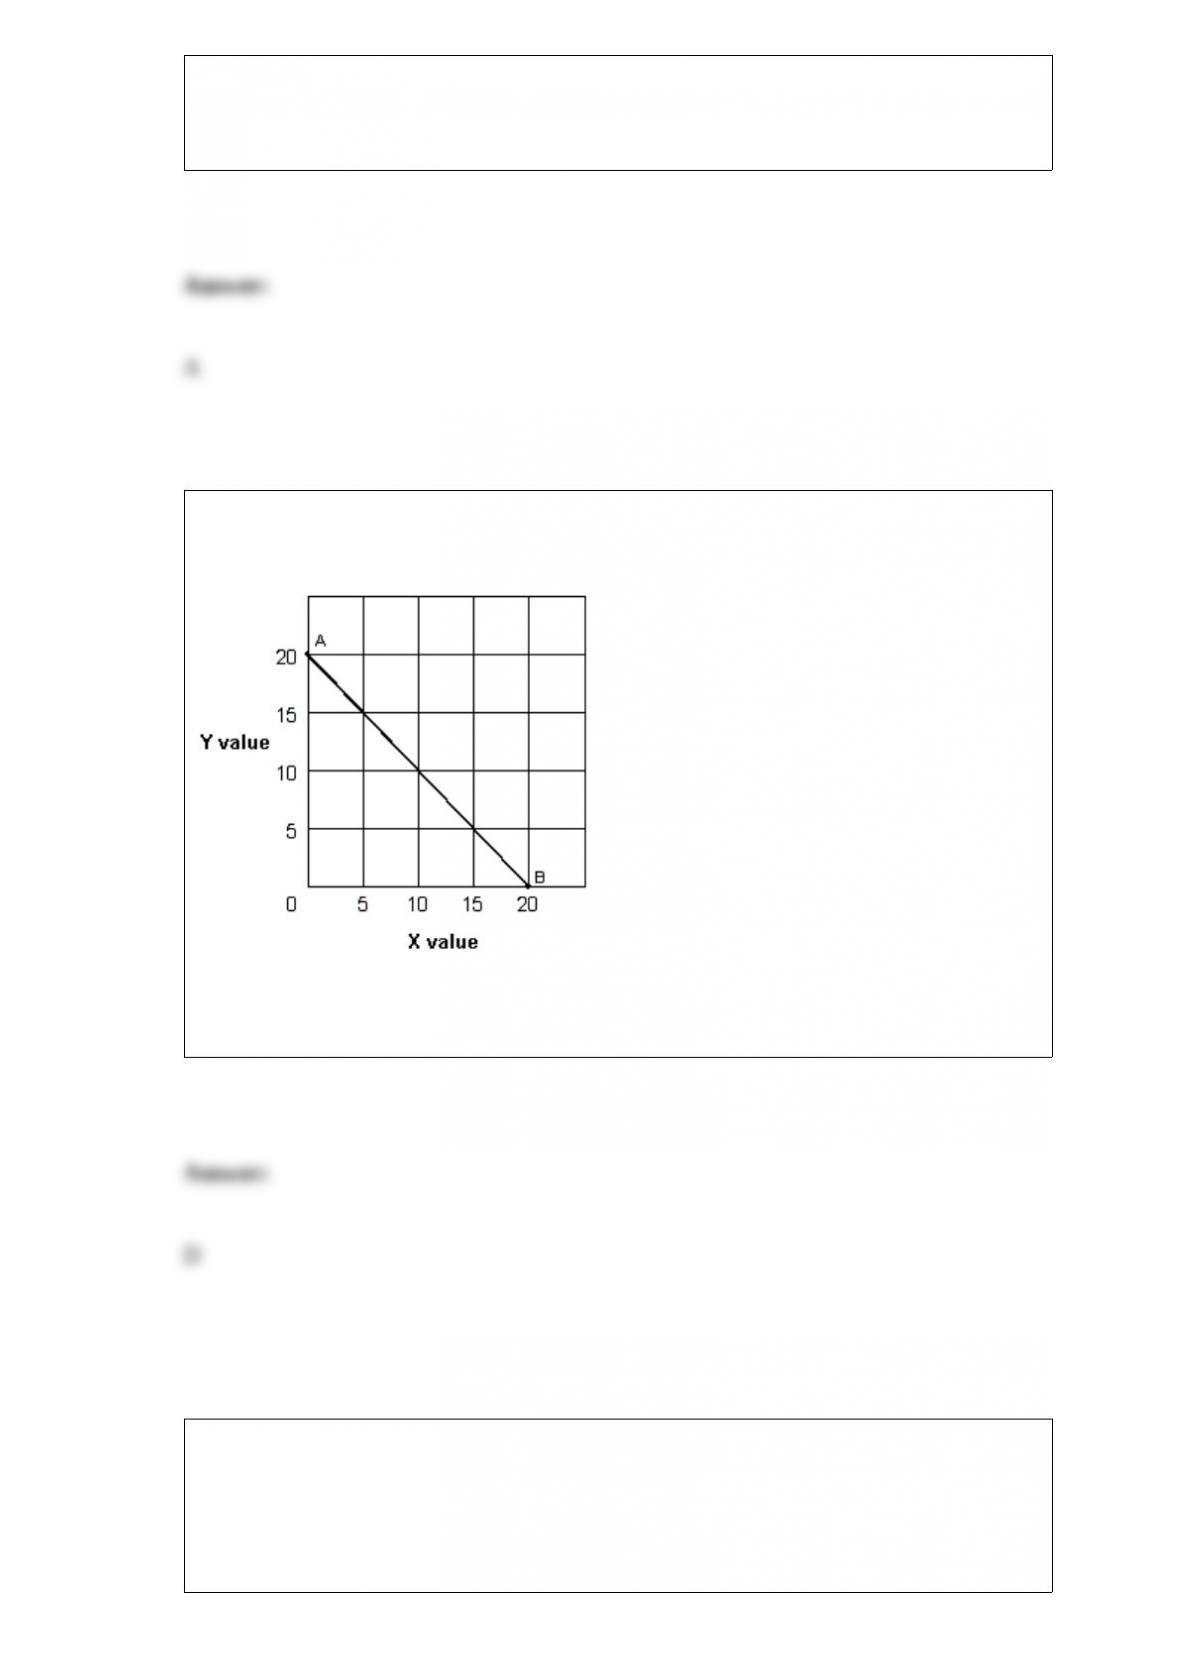
Exhibit 1A-3 Straight line
As shown in Exhibit 1A-3, the slope of straight line AB:
a. decreases with increases in X. c. increases with decreases in X.
b. increases with increases in X. d. remains constant with changes in X.
____ is the act of buying a commodity in one market at a lower price and selling it in
another market at a higher price.
a. Buying short.
b. Discounting.
c. Tariffing.

d. Arbitrage.
If the demand for a good decreased, what would be the effect on the equilibrium price
and quantity?
a. Price would increase, and quantity would decrease.
b. Price would decrease, and quantity would decrease.
c. Price would increase, and quantity would increase.
d. Price would decrease, and quantity would increase.
An increase in consumers’ incomes will have what effect on the equilibrium in the
restaurant meals market?
a. Price will increase, and quantity will increase.
b. Price will decrease, and quantity will increase.
c. Price will increase, and quantity will decrease.
d. Price will decrease, and quantity will decrease.
e. Price will increase, and quantity will stay the same.
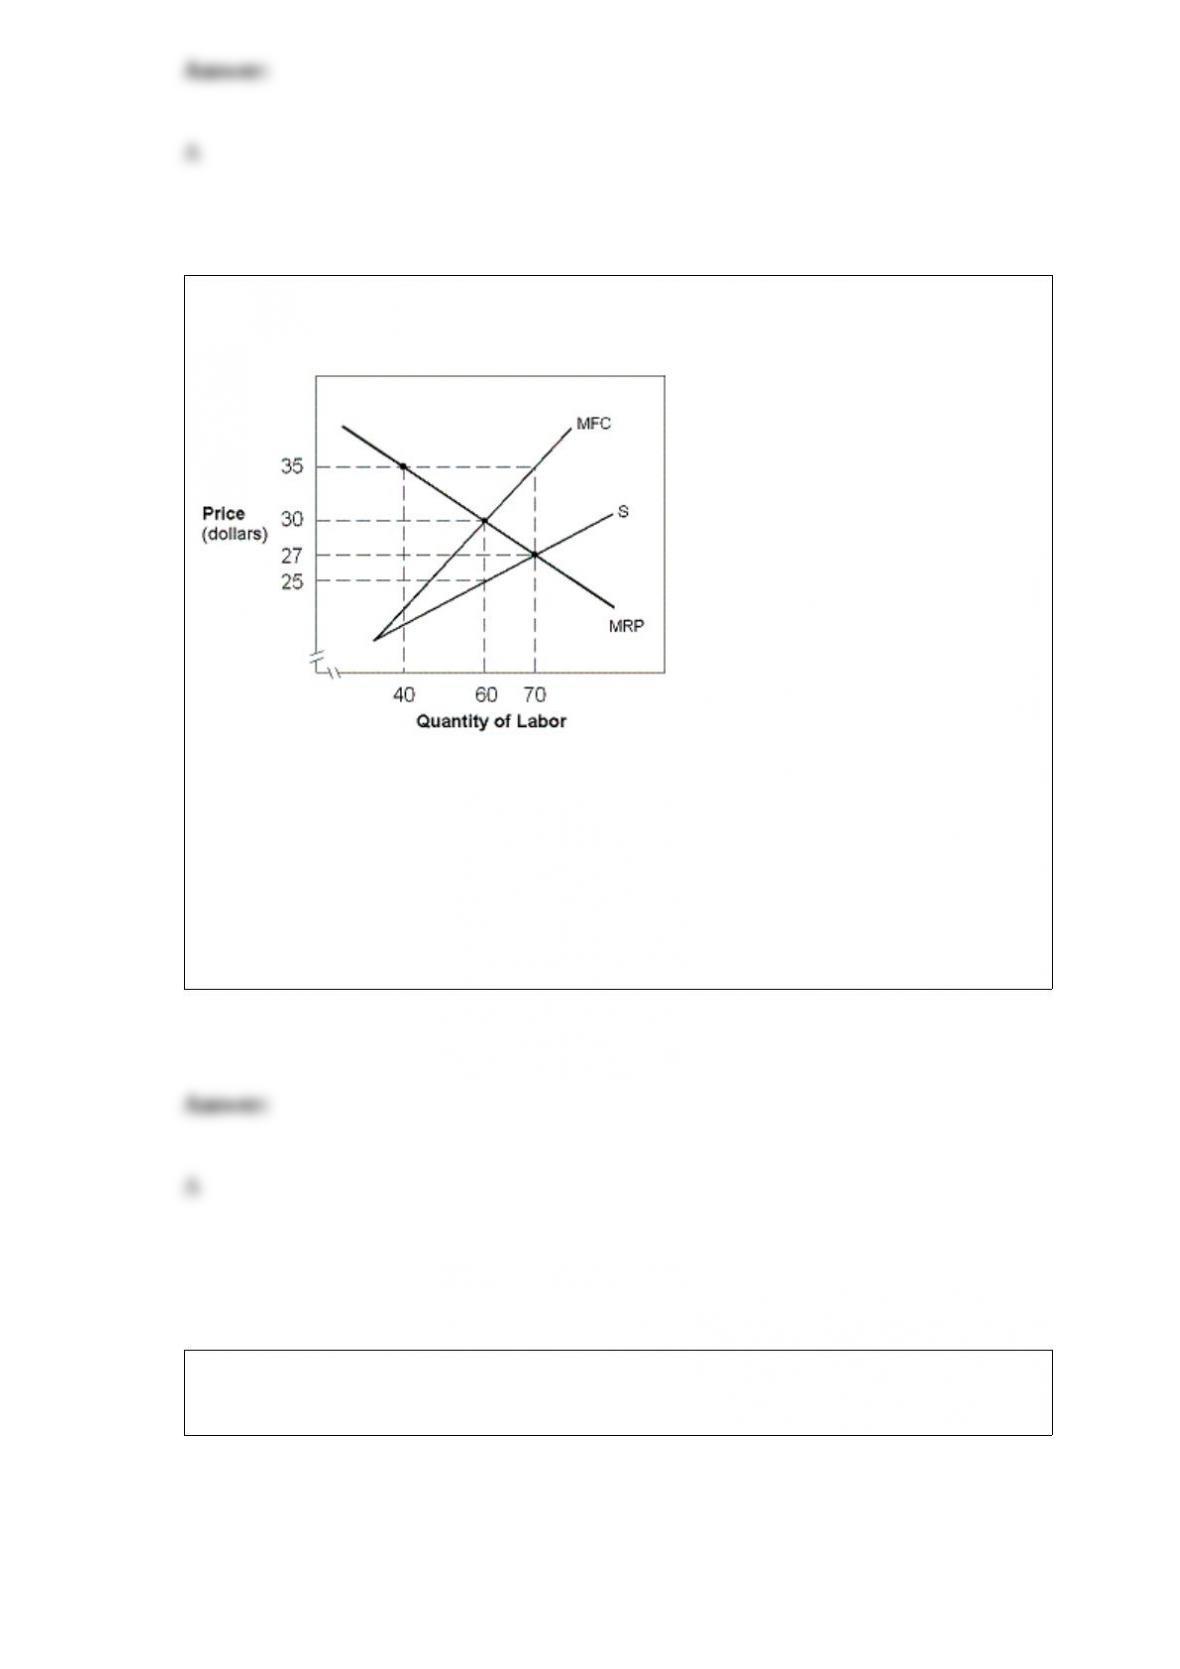
Exhibit 11-12 A monopsonist
In Exhibit 11-12, suppose this labor market is unionized by a powerful union which
forces a wage of $35 upon the industry. The firm would respond by hiring ____ workers
and paying a wage of ____.
a. 40; $35
b. 60; $30
c. 70; $27
d. 60; $35
e. 40; $30
Exhibit 7-15 Long-run average cost
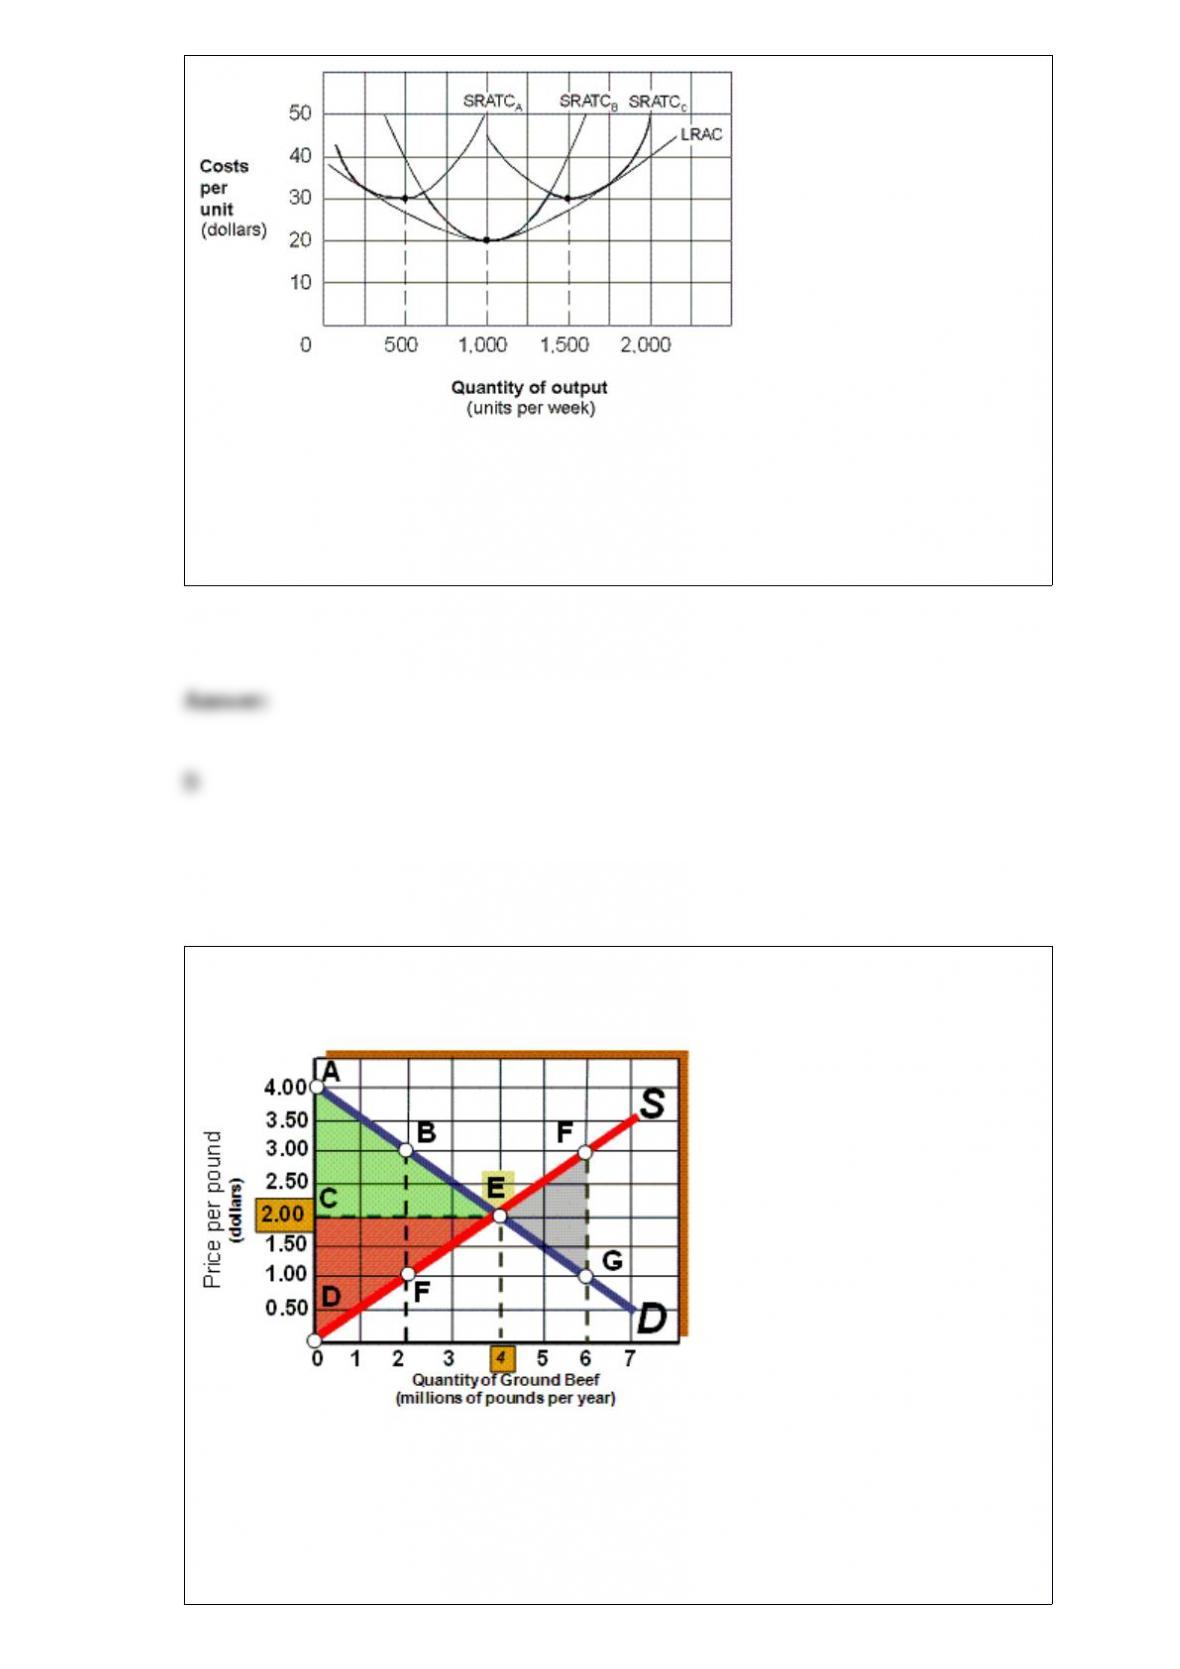
In Exhibit 7-15, economies of scale exist up to:
a. 500 units of output per week.
b. 1,000 units of output per week.
c. 1,500 units of output.
d. 2,000 units of output.
Exhibit 3A-1 Comparison of Market Efficiency and Deadweight Loss
As shown in Exhibit 3A-1, if the quantity supplied is 6 million pounds of ground beef
per year, the result is:
a. deadweight loss.
b. inefficiency.
c. overproduction.
d. all of the above are true.
e. none of the above are true.
During this century, court decisions on antitrust have:
a. changed from per se, to rule of reason, and back to per se.
b. changed from rule of reason, to per se, and back to rule of reason.
c. always emphasized per se.
d. always emphasized rule of reason.
e. varied from judge to judge without following any pattern.
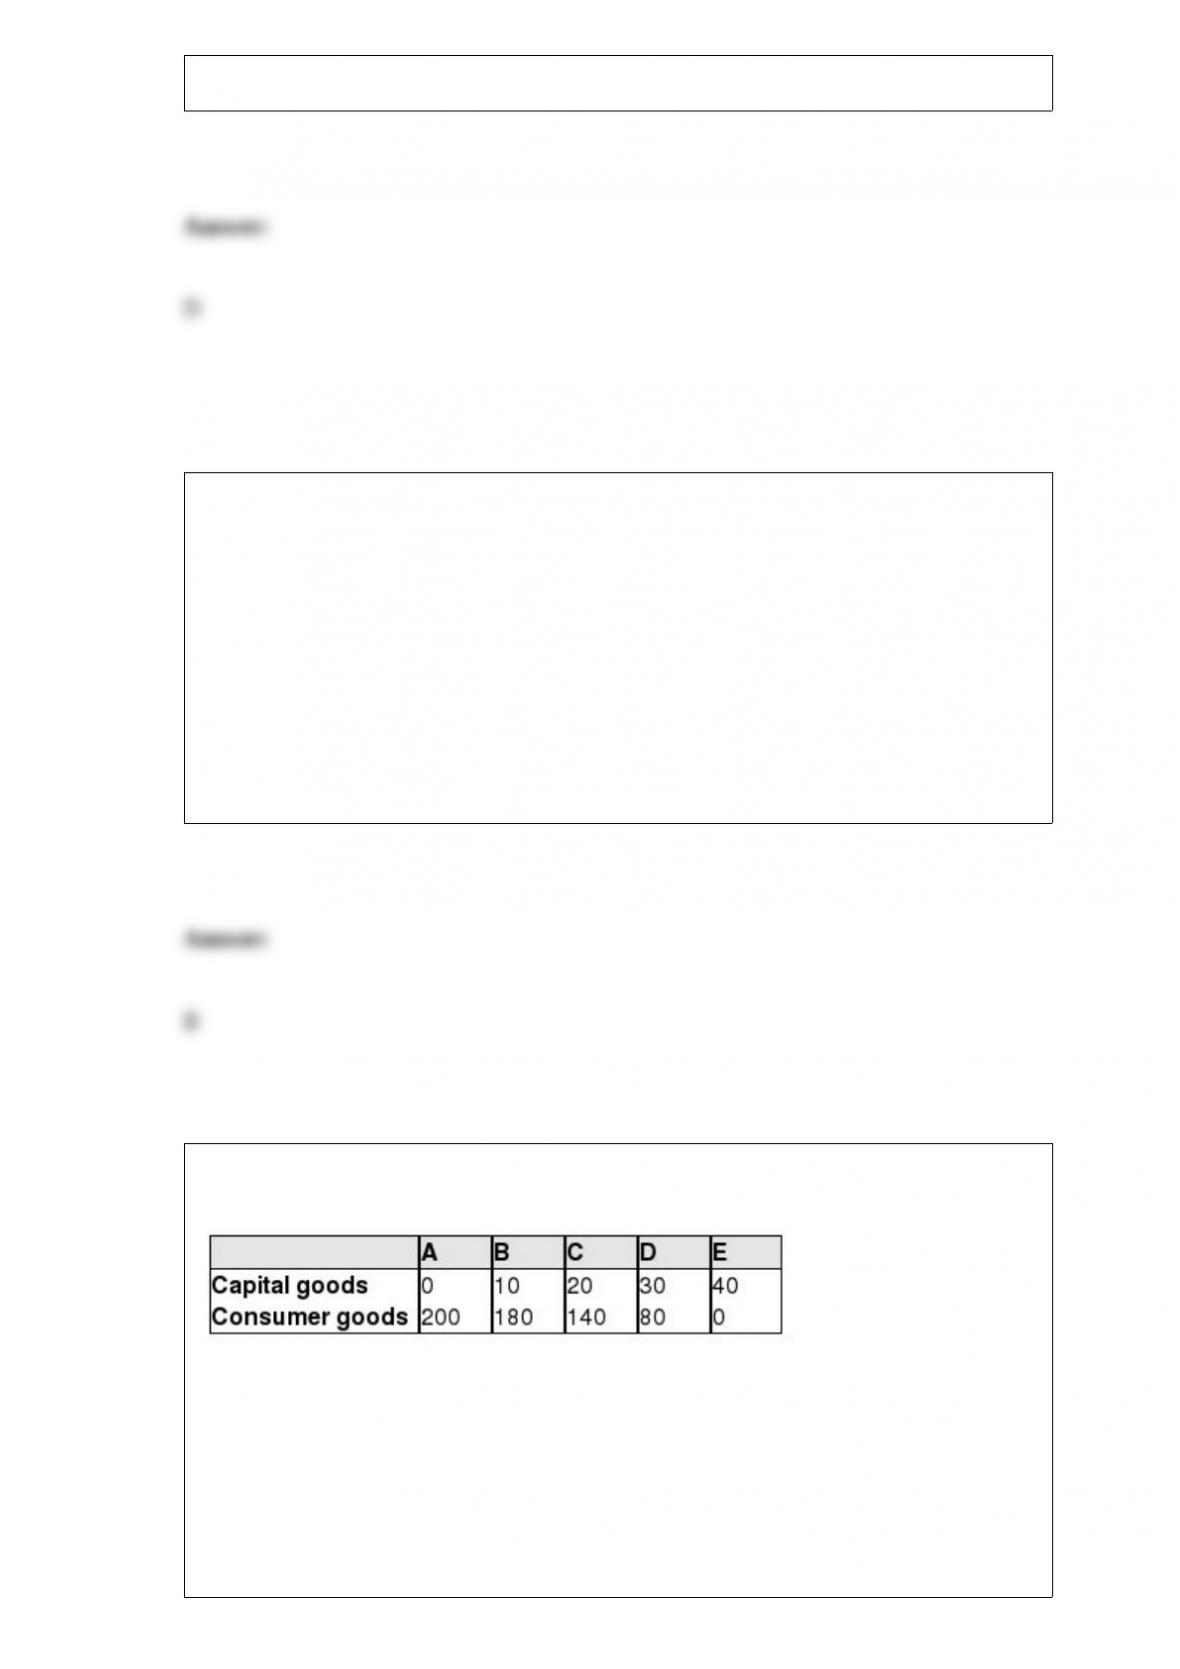
Exhibit 2-4 Production possibilities curve data
According to the data in Exhibit 2-4, a total output of 140 units of consumer goods and
10 units of capital goods would:
a. be unobtainable in this economy.
b. be an efficient way of using the economy’s scarce resources.
c. result in the maximum use of the economy’s labor force.
d. result in a less than maximum rate of growth for this economy.
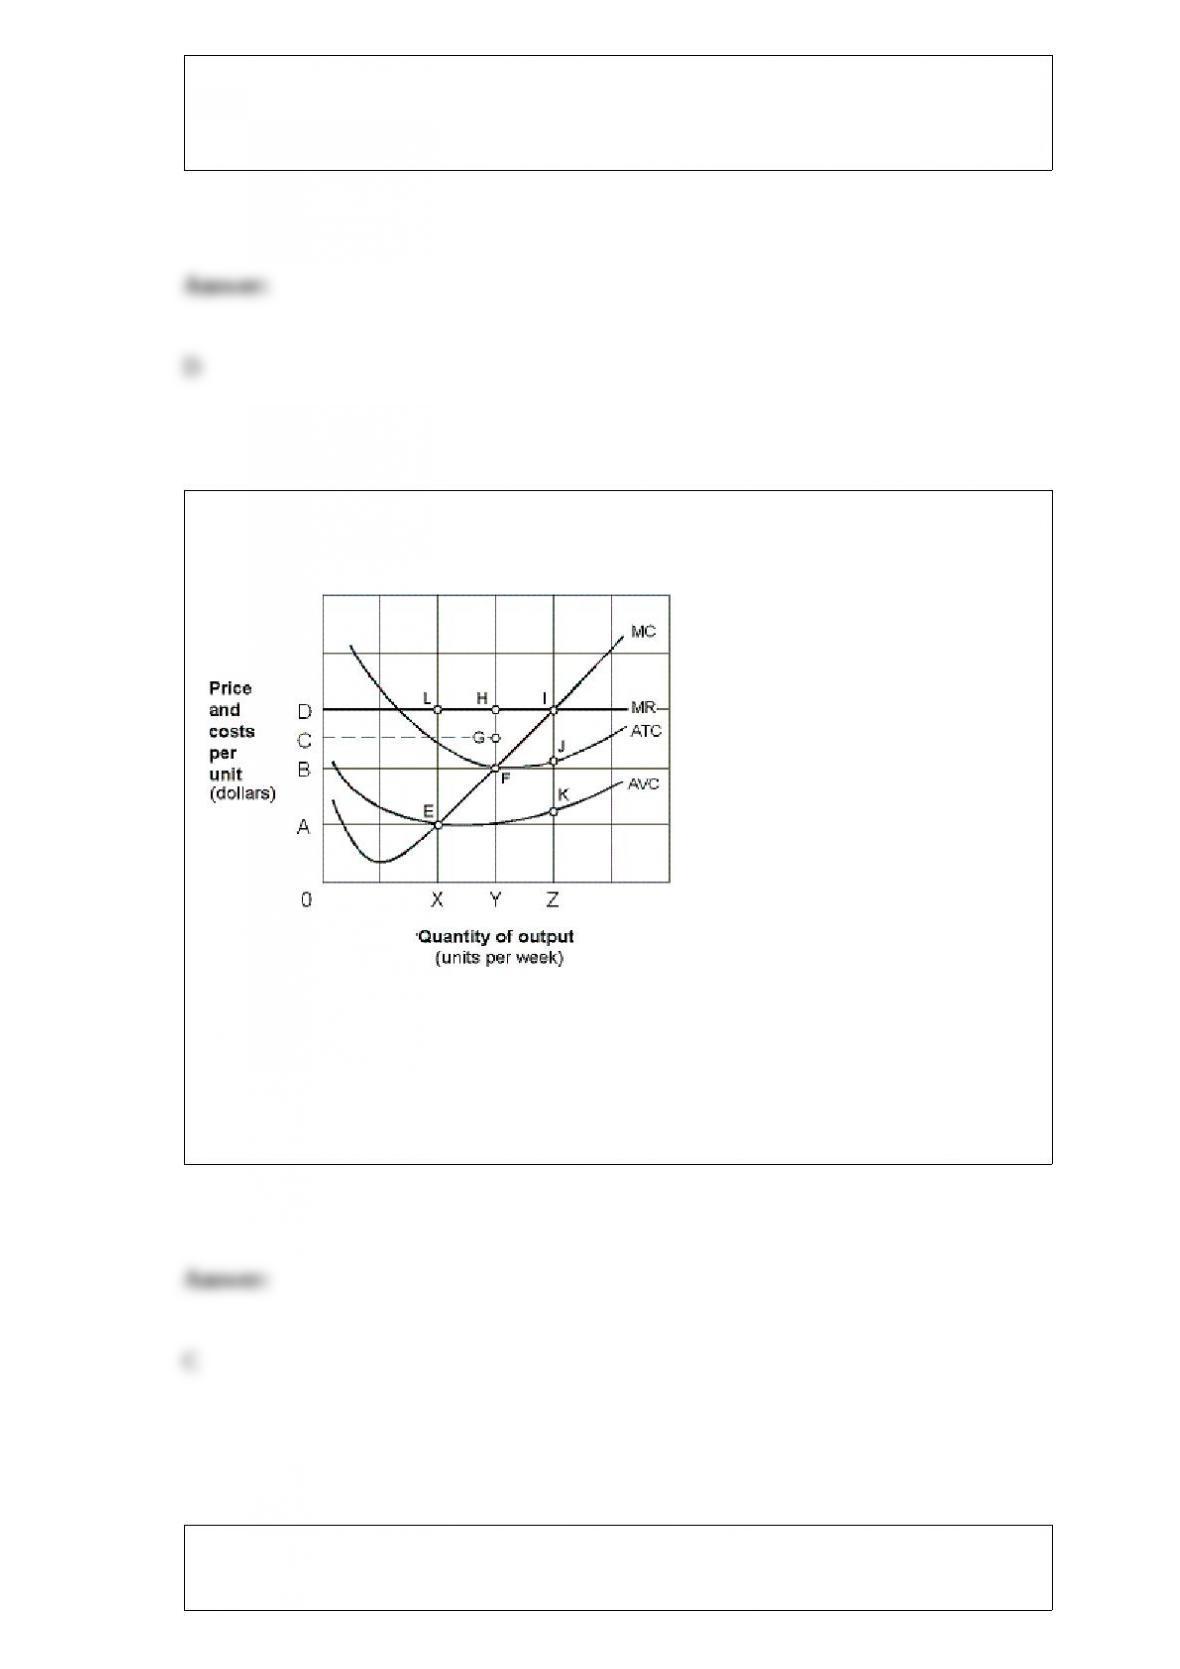
Exhibit 8-12 Marginal revenue and cost per unit curves
As shown in Exhibit 8-12, if the price is OB, the firm’s total cost of producing at its
most profitable level of output is:
a. YF.
b. XL.
c. OYFB.
d. OXEA.
When the price of a good in a market is above equilibrium:
a. the quantity supplied exceeds the quantity demanded.
b. a surplus is observed.
c. the price will fall in the near future.
d. all of these.
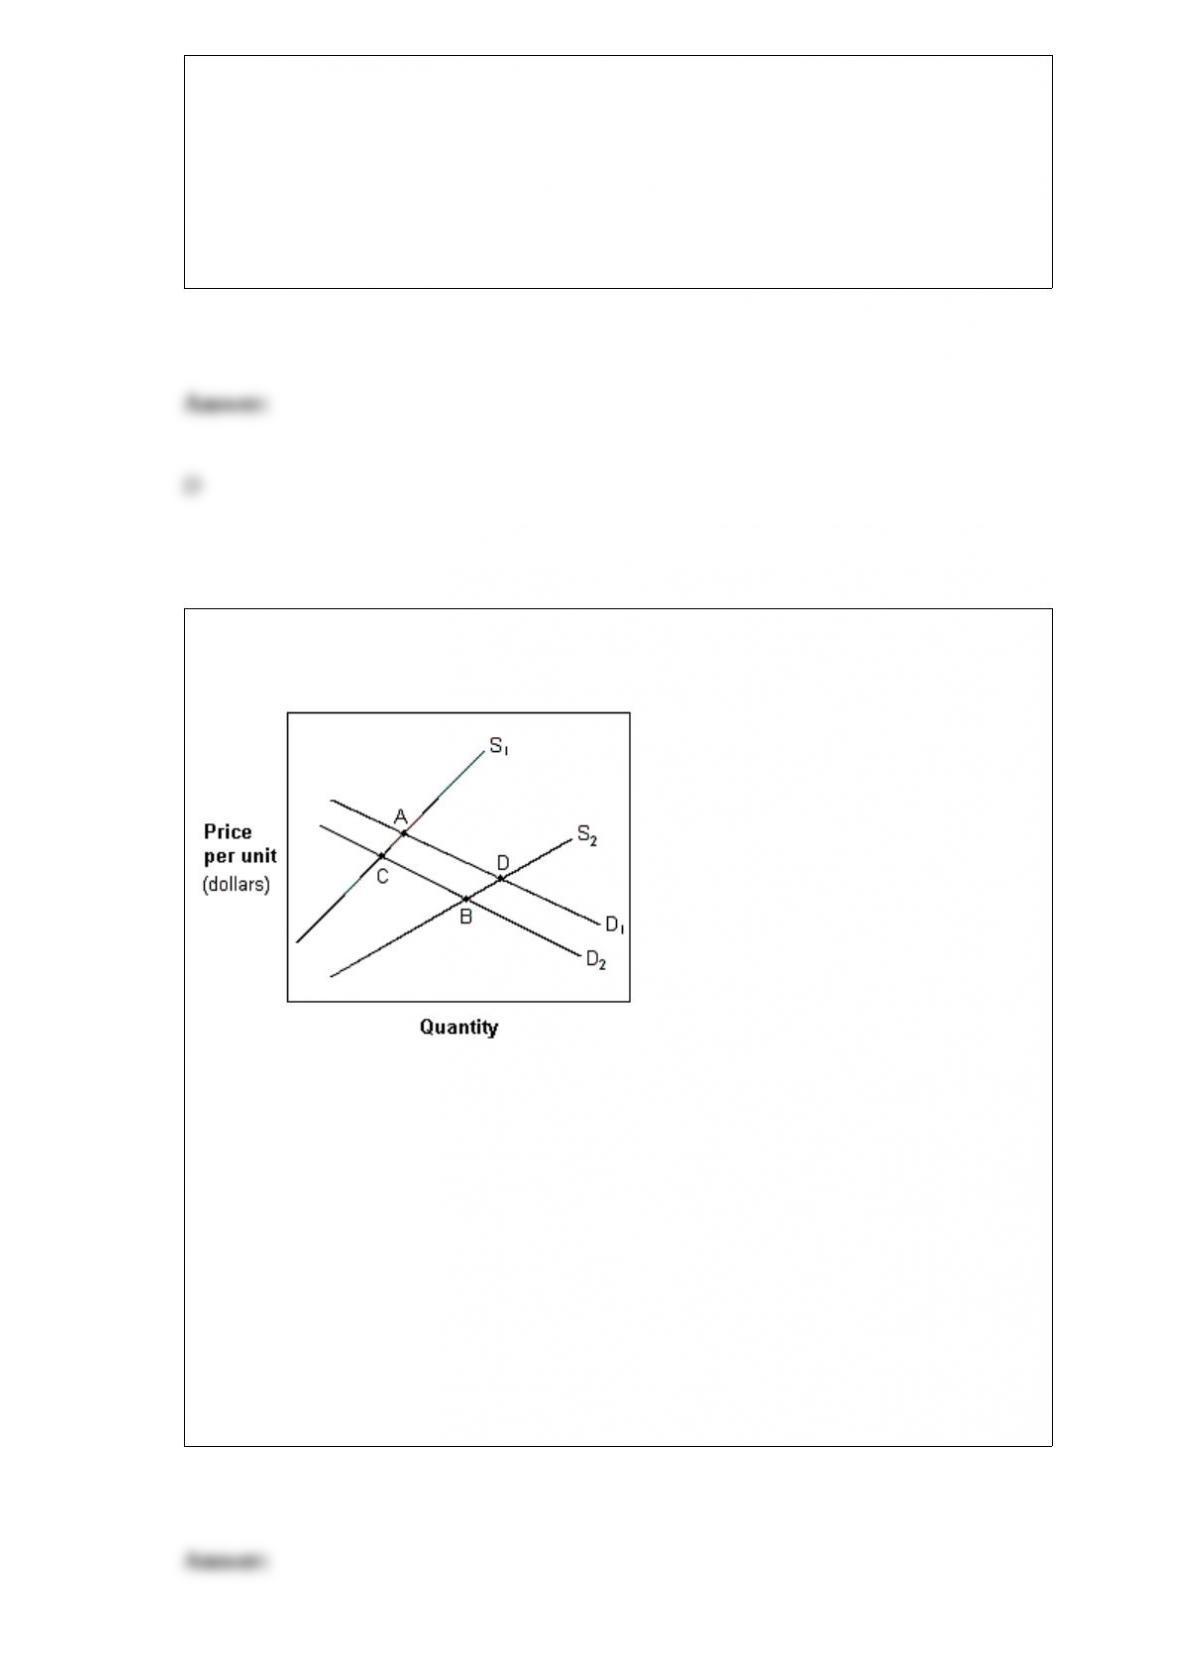
Exhibit 4-8 Demand and supply curves
In Exhibit 4-8, a movement from A to B in which price has decreased and quantity has
increased is best explained by a(n):
a. increase in supply and demand.
b. decrease in supply and demand.
c. increase in supply that dominates a decrease in demand.
d. increase in demand that dominates a decrease supply.
e. decrease in demand that dominates an increase in supply.
In the short run, if a perfectly competitive firm is producing at a price above average
total cost, its economic profit must be:
a. positive.
b. zero.
c. negative.
d. normal.
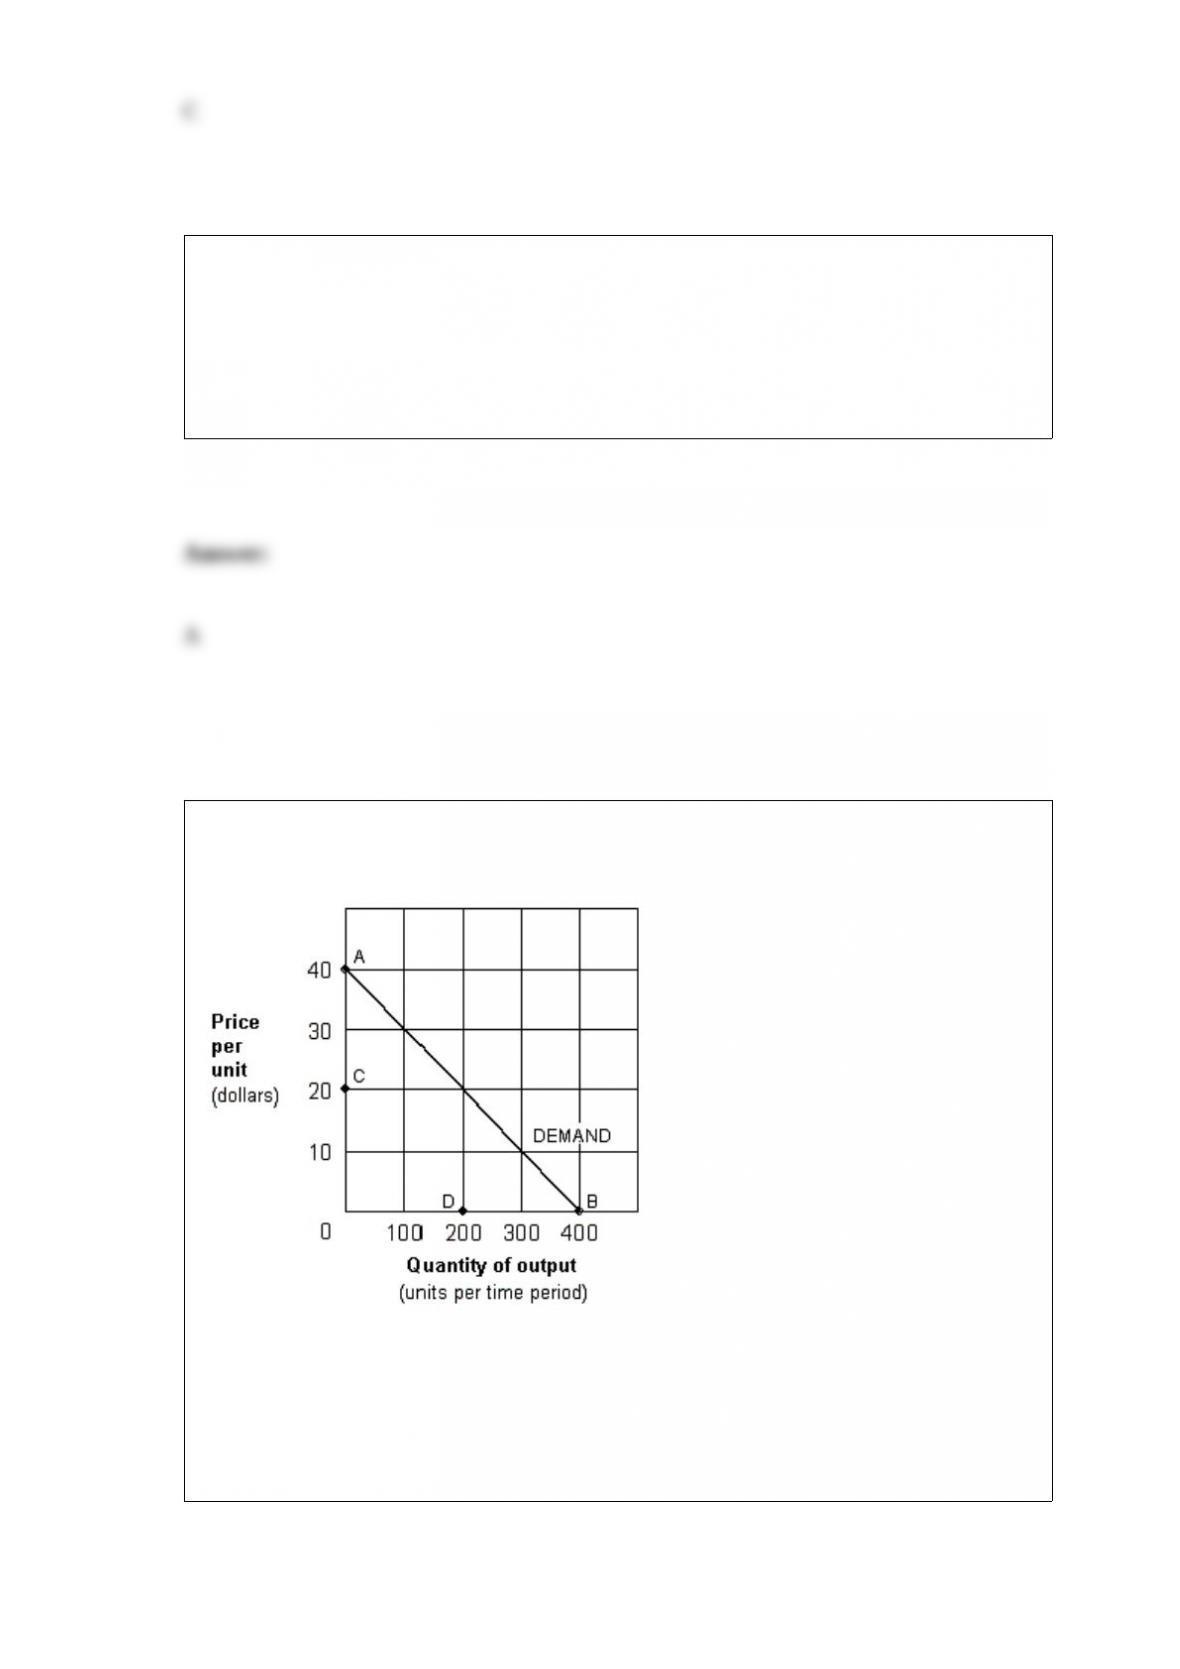
Exhibit 9-1 Monopolist’s demand curve
At an output of 100 units, marginal revenue for a monopolist with the demand curve
shown in Exhibit 9-1 would be:
a. positive.
b. zero.
c. negative.
d. infinity.
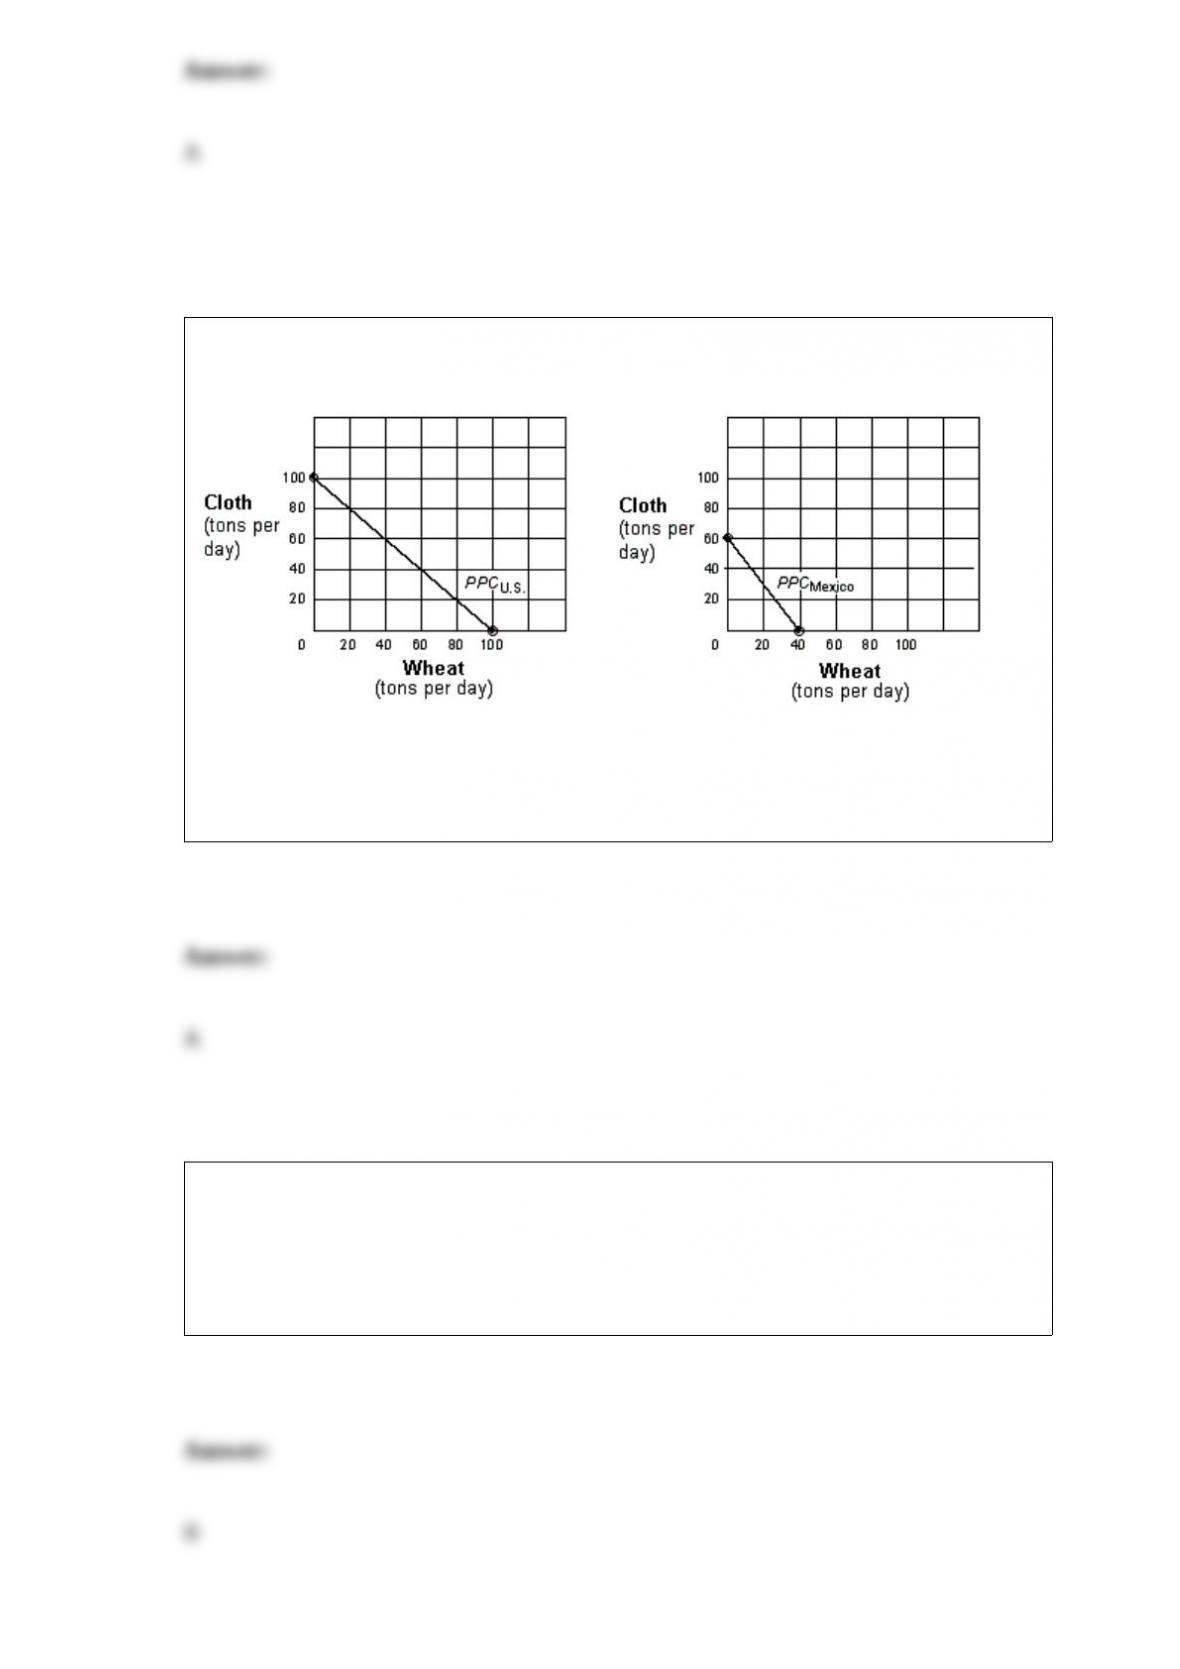
Exhibit 15-2 Production possibilities curves for U.S. and Mexico
As shown in Exhibit 15-2, the United States has a comparative advantage over Mexico
in:
a. wheat, but not in cloth. c. both wheat and cloth.
b. cloth, but not in wheat. d. neither wheat nor cloth
Which of the following pairs is the most likely to exhibit a direct relationship?
a. The price of gasoline and the amount of gasoline that people purchase.
b. Cholesterol levels and the likelihood of developing heart disease.
c. Outdoor temperature and heating oil sales.
d. Annual income and weekly pawn shop visits.