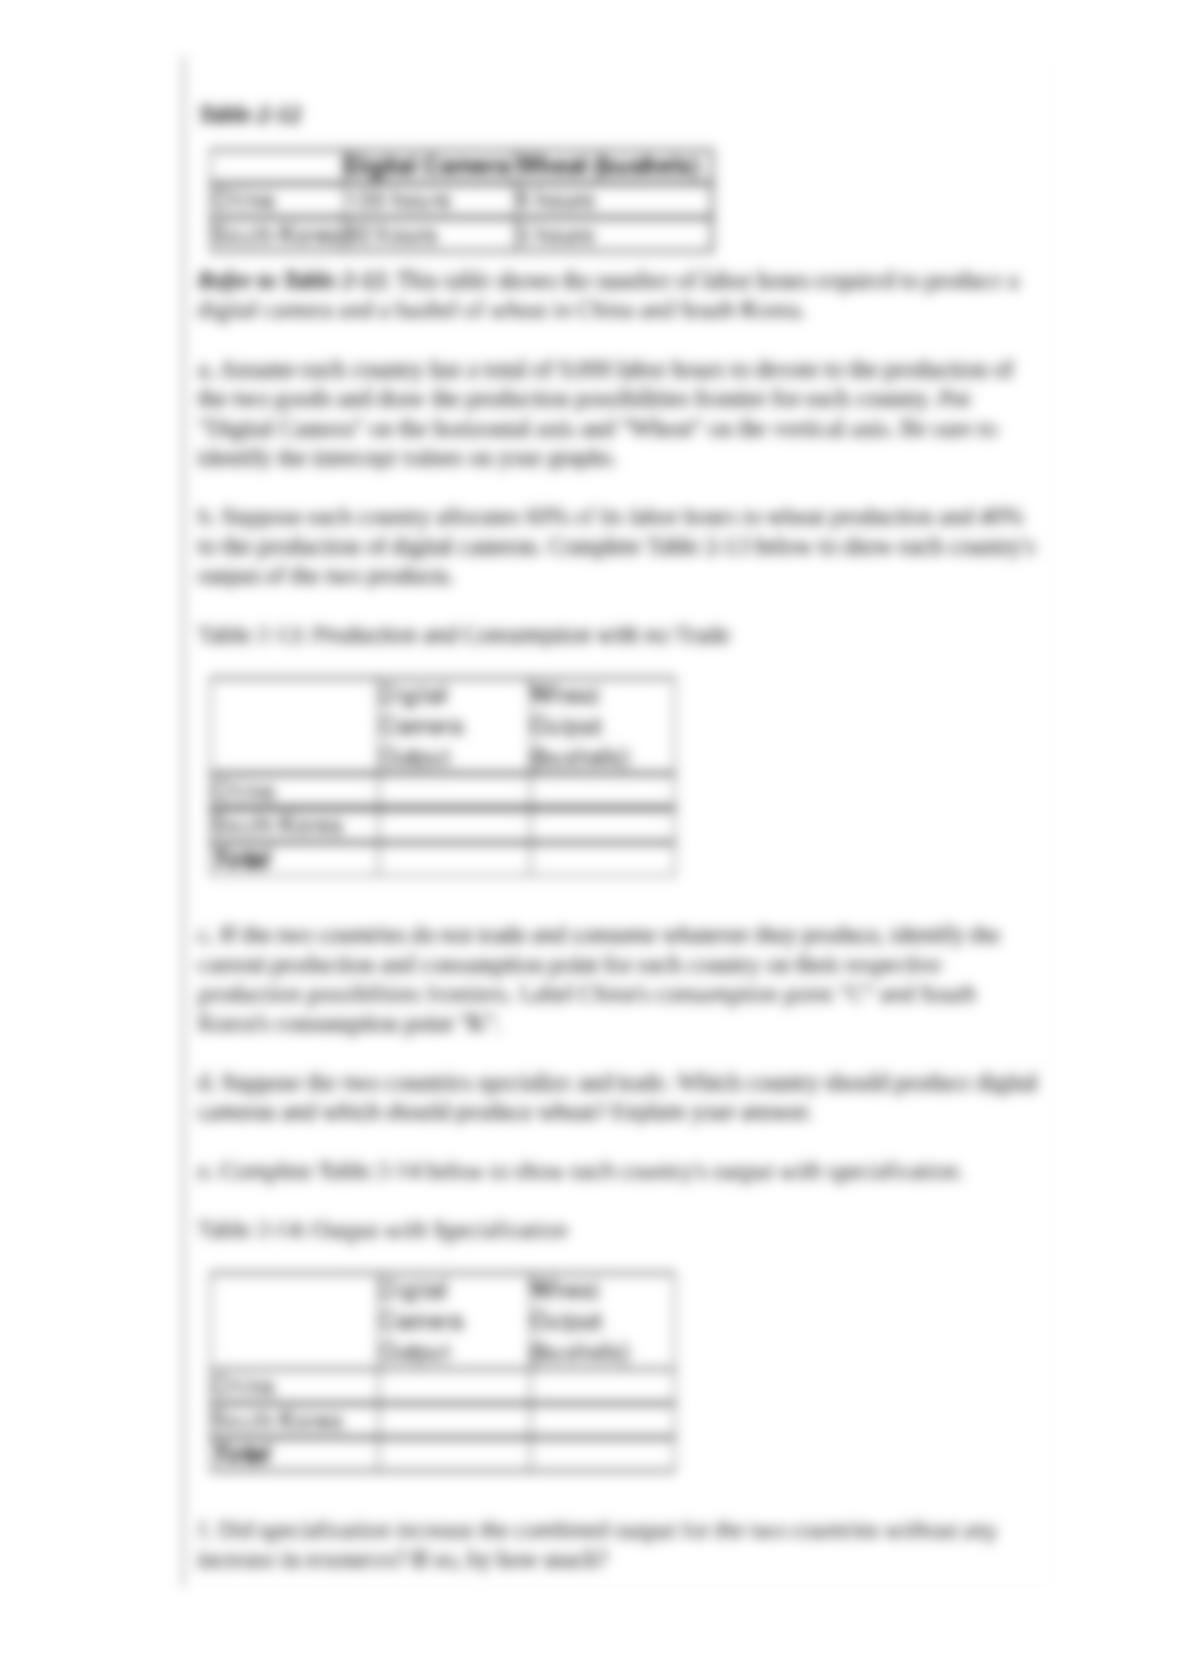
Table 2-12
Refer to Table 2-12. This table shows the number of labor hours required to produce a
digital camera and a bushel of wheat in China and South Korea.
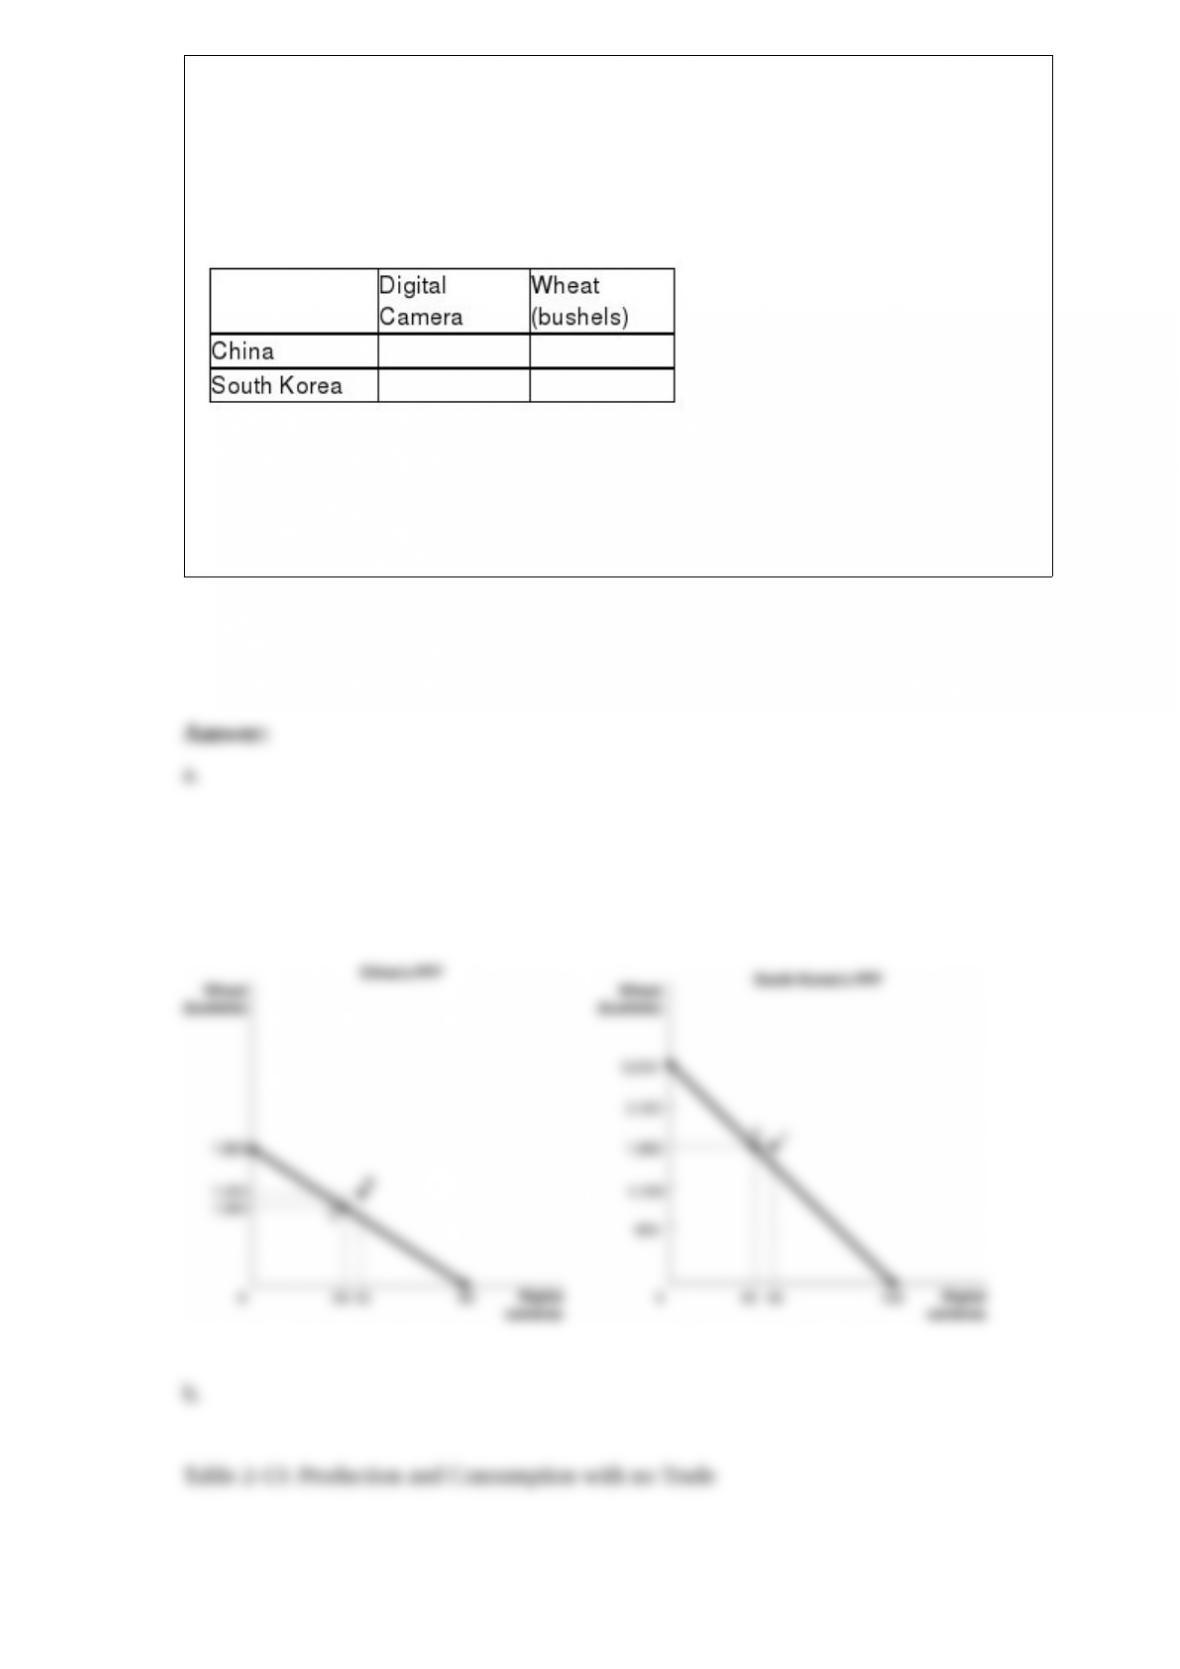
a. Assume each country has a total of 9,000 labor hours to devote to the production of
the two goods and draw the production possibilities frontier for each country. Put
“Digital Camera” on the horizontal axis and “Wheat” on the vertical axis. Be sure to
identify the intercept values on your graphs.
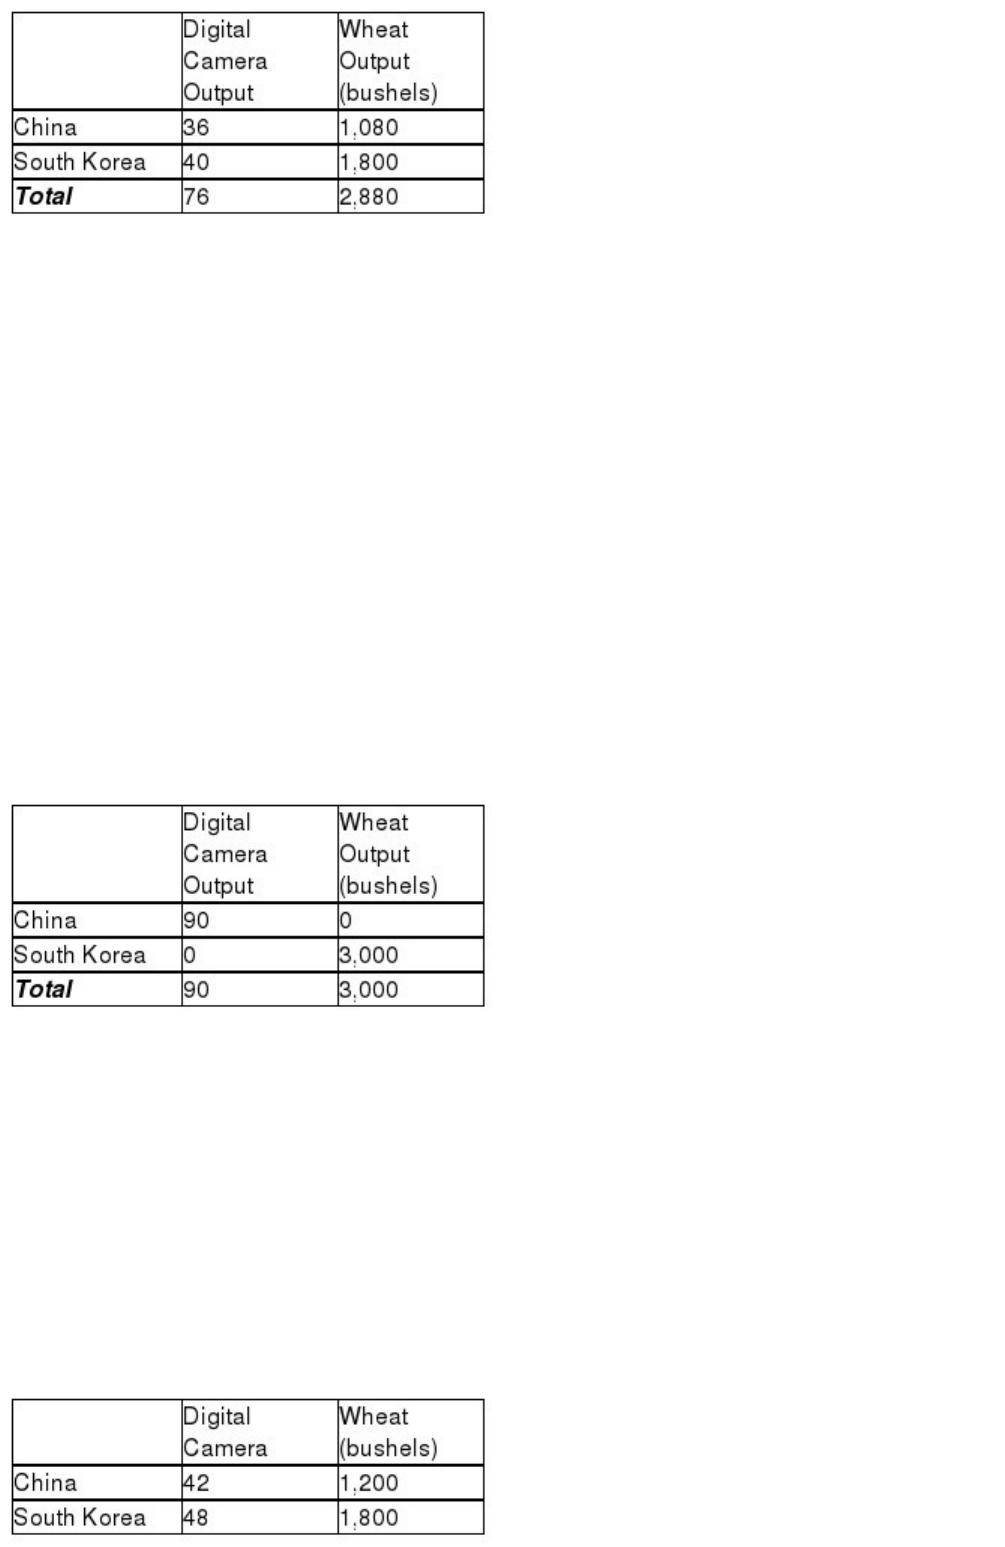
b. Suppose each country allocates 60% of its labor hours to wheat production and 40%
to the production of digital cameras. Complete Table 2-13 below to show each country’s
output of the two products.
Table 2-13: Production and Consumption with no Trade
c. If the two countries do not trade and consume whatever they produce, identify the
current production and consumption point for each country on their respective
production possibilities frontiers. Label China’s consumption point “C” and South
Korea’s consumption point “K”.
d. Suppose the two countries specialize and trade. Which country should produce digital
cameras and which should produce wheat? Explain your answer.
e. Complete Table 2-14 below to show each country’s output with specialization.
Table 2-14: Output with Specialization
f. Did specialization increase the combined output for the two countries without any
increase in resources? If so, by how much?
g. Suppose China and South Korea agree to trade so that in exchange for 1,200 bushels
of wheat, the exporter of wheat receives 48 digital cameras. Complete Table 2-15 below
to show each country’s consumption bundle after trade.
Table 2-15: Consumption with Trade
h. Show the consumption points after trade on each country’s production possibilities
frontier. Label these points “B” for China and “J” for South Korea.
i. Has trade made the two countries better off? Explain your answer.

Why is price discrimination legal but not discrimination based on race or gender?
A) because price discrimination increases profits and therefore tax revenues for the
government, but discrimination based on race or gender reduces tax revenues
B) because price discrimination reduces deadweight loss, but discrimination based on
race or gender increases deadweight loss
C) because price discrimination involves charging people different prices based on their
willingness to pay rather than on the basis of arbitrary characteristics
D) because price discrimination enables firms to increase output and employment, but
race- or gender-based discrimination reduces employment
If a consumer receives 22 units of marginal utility for consuming the first can of soda,
20 units from consuming the second, and 15 from the third, the total utility of
consuming the three units is
A) 57 utility units.
B) 35 utility units.
C) 15 utility units.
D) unknown as more information is needed to determine the answer.

A corporation is
A) the easiest type of business to set up.
B) the least expensive type of business to set up.
C) the most difficult type of business to set up.
D) the least profitable type of business to set up.
In the short run, if marginal product is at its maximum, then
A) average cost is at its minimum.
B) average variable cost is at its minimum.
C) marginal cost is at its minimum.
D) total cost is at its maximum.
In regulating a natural monopoly, the price strategy that ensures the highest possible

output and zero profit is one that sets price
A) equal to average total cost where it intersects the demand curve.
B) equal to marginal cost where it intersects the demand curve.
C) equal to average variable cost where it intersects the demand curve.
D) corresponding to the demand curve where marginal revenue equals zero.
Delaware and North Dakota have identical state gasoline taxes of 23.0 cents per gallon.
When added to the federal gasoline tax of 18.4 cents per gallon, the total tax on one
gallon of gasoline in these two states is 41.4 cents. On November 8, 2015, the average
price of one gallon of regular gasoline was $2.17 in Delaware and $2.28 in North
Dakota. Briefly explain whether this is an example of price discrimination. Assume that
the gasoline being sold is identical in both states.
Sources: gaspricewatch.com and taxfoundation.org
Haiti was once a heavily forested country. Today, 80 percent of Haiti’s forests have been
cut down, primarily to be burned to create charcoal. The reduction in the number of
trees has lead to devastating floods when it rains heavily. This is an example of
A) tragic externalities.
B) the tragedy of the commons.
C) human greed.
D) the consequences of not having a market economic system.
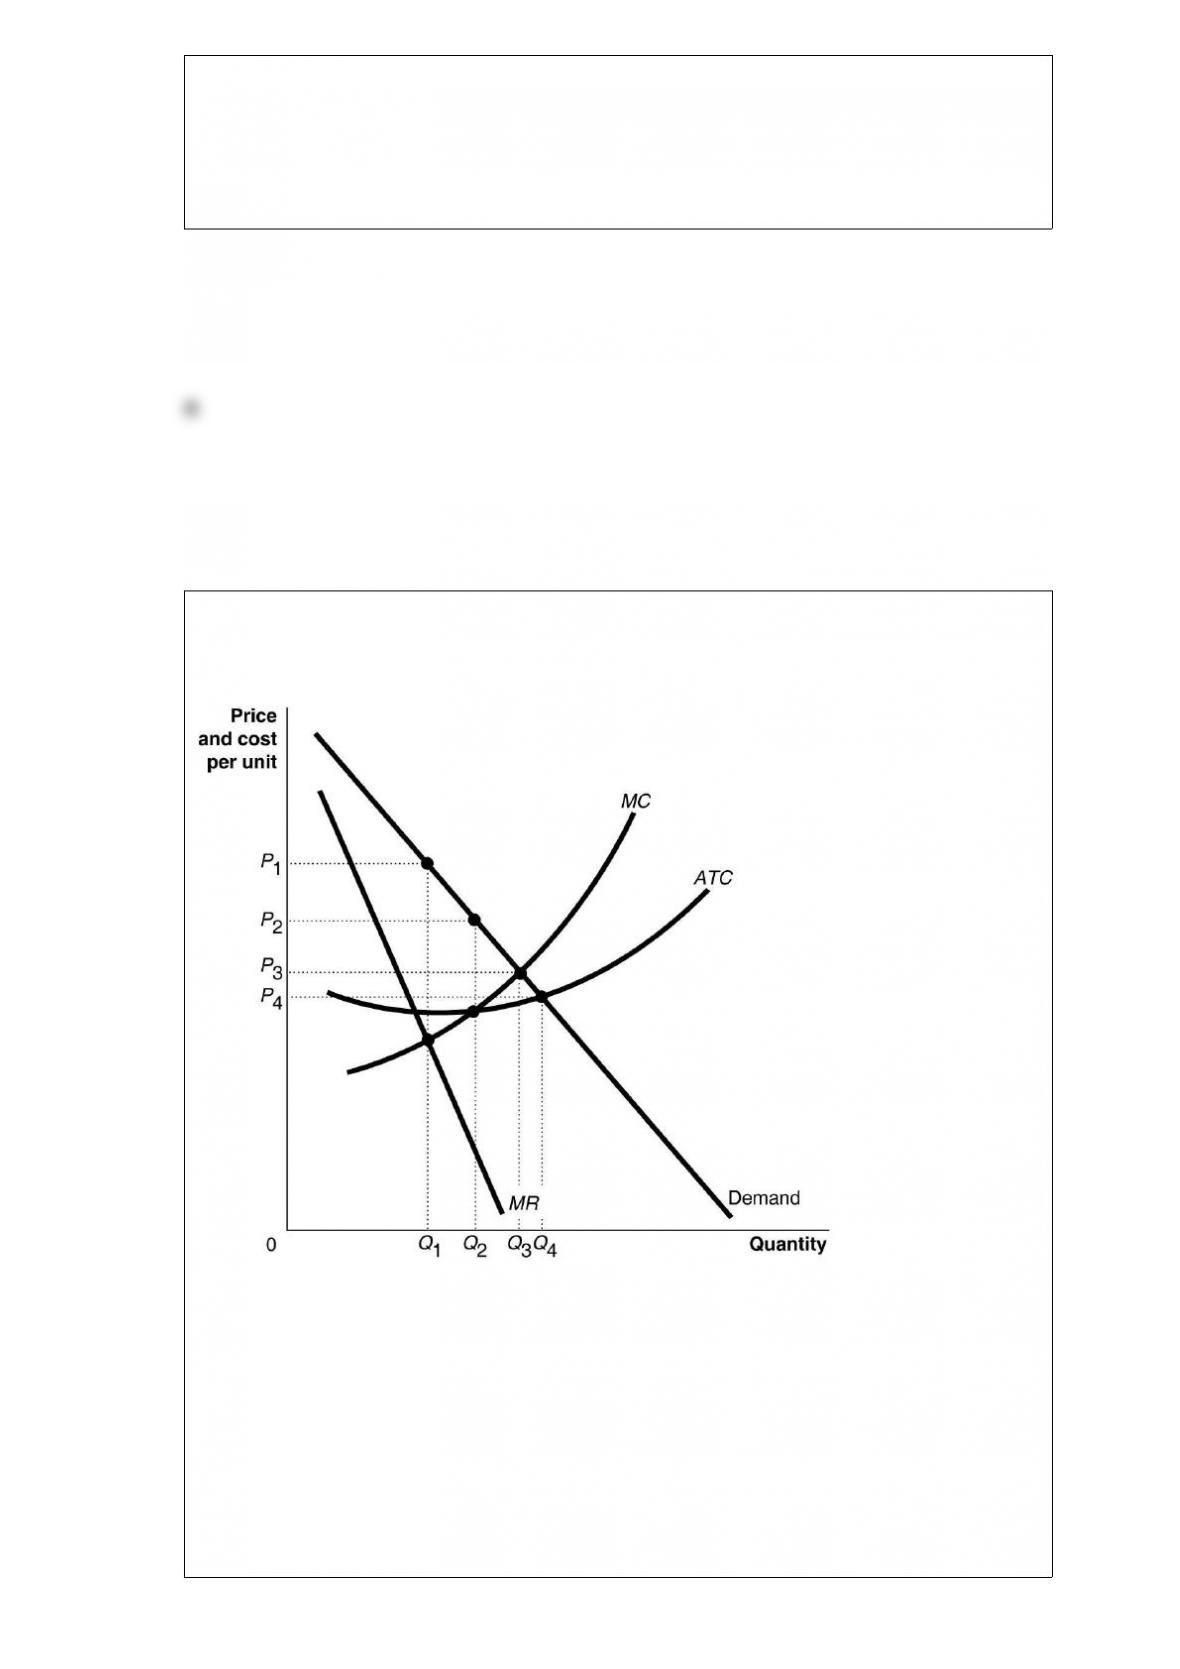
Figure 16-1
Refer to Figure 16-1. What is the price charged under perfect price discrimination?
A) P3
B) P4
C) a range of prices corresponding to the demand curve from P3 and above
D) a range of prices corresponding to the demand curve from P4 and above

A possible advantage of a horizontal merger for the economy is that
A) the merging firms could avoid losses.
B) the merged firm might reap economies of scale which could translate into lower
prices.
C) the degree of competition in the industry will be intensified.
D) the government stands to collect more corporate income tax revenue.
A wheat farmer and a firm in a perfectly competitive market are similar in that
A) both face vertical demand curves.
B) both have to lower their prices if a rival firm lowers its price.
C) both face horizontal demand curves.
D) both will earn an economic profit if their total revenue equals their total cost.

Which of the following is important in determining the extent of competition in an
industry?
A) the minimum level of short-run average total costs of production
B) the minimum efficient scale of production relative to market demand
C) whether or not the industry product is differentiated or standardized
D) the level of market demand for the industry’s product
Utility is
A) easily measured in units called utils.
B) subjective and difficult to measure.
C) the consumption of a quasi-public good like electricity or natural gas.
D) the production of a quasi-public good like electricity or natural gas.
Figure 12-17
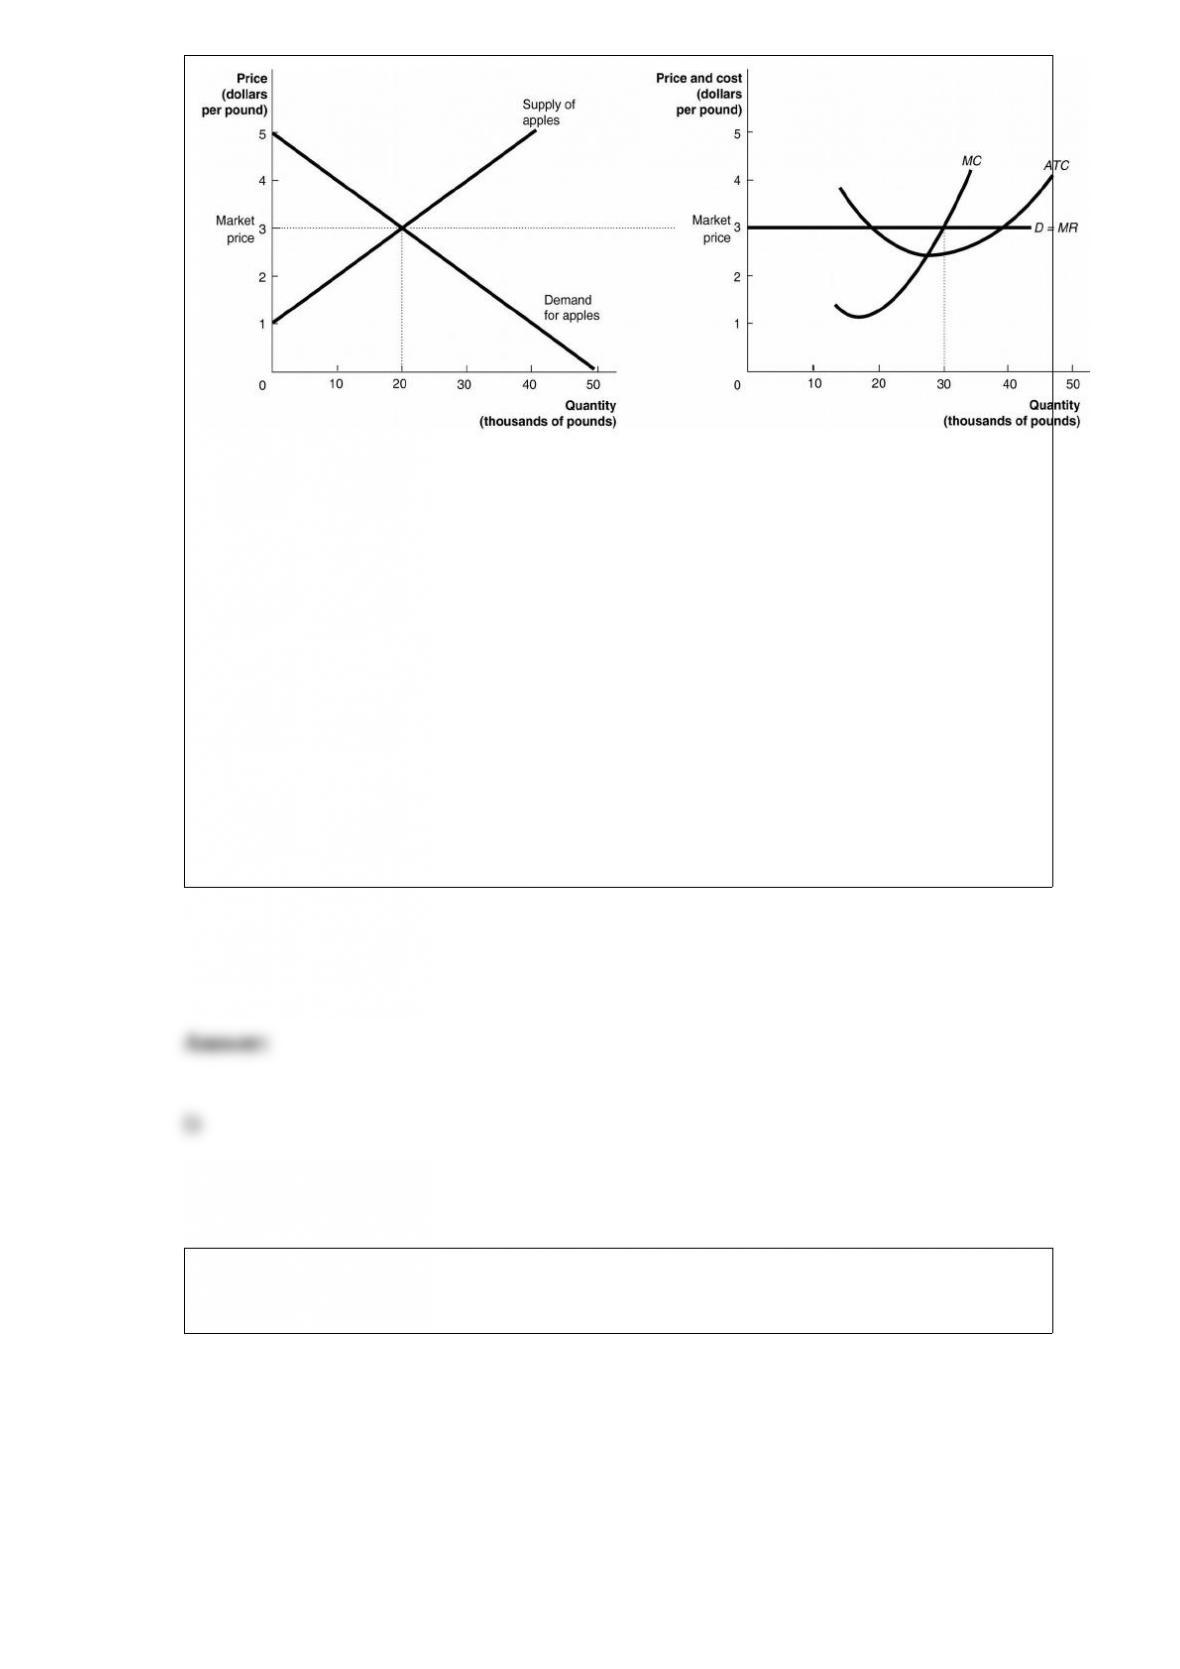
The graphs in Figure 12-17 represent the perfectly competitive market demand and
supply curves for the apple industry and demand and cost curves for a typical firm in
the industry.
Refer to Figure 12-17. The graphs depicts a short-run equilibrium. How will this differ
from the long-run equilibrium? (Assume this is a constant-cost industry.)
A) Fewer firms will be in the market in the long run than in the short run.
B) The price will be higher in the long run than in the short run.
C) The market supply curve will be further to the left in the long run than in the short
run.
D) The firm’s profit will be lower in the long run than in the short run.
Figure 6-4

Refer to Figure 6-4. At the midpoint of the demand curve, in absolute value
A) the price elasticity coefficient is at a maximum.
B) the price elasticity coefficient is at a minimum.
C) the price elasticity coefficient is zero.
D) the price elasticity coefficient is one.
In contrast with perfect competition, excess capacity characterizes monopolistic
competition. Excess capacity is due to which of the following?
A) Monopolistically competitive firms produce at the minimum point on their average
total cost curves.
B) Monopolistically competitive firms face downward-sloping demand curves. In the
long run, firms produce where their demand curves are tangent to their long-run
average total cost curves.
C) Monopolistically competitive firms produce where marginal revenue is equal to
marginal cost.
D) Monopolistically competitive markets have low barriers to entry.
Between 1980 and 2014, income inequality in the United States has increased in part
due to expanding international trade. How does expanding international trade contribute
to income inequality?
A) It increases the demand for a wide array of products which in turn increases prices
beyond the reach of average-income individuals.
B) It allows producers to exploit workers and reduce the wages they are willing to pay
workers.
C) Domestic firms can now hire low-skilled workers anywhere in the world, putting
U.S. workers in competition with foreign workers. This has caused the wages of
unskilled workers to be depressed relative to the wages of other workers.
D) It reduces the cost of producing goods and therefore lowers the value of labor’s
services.
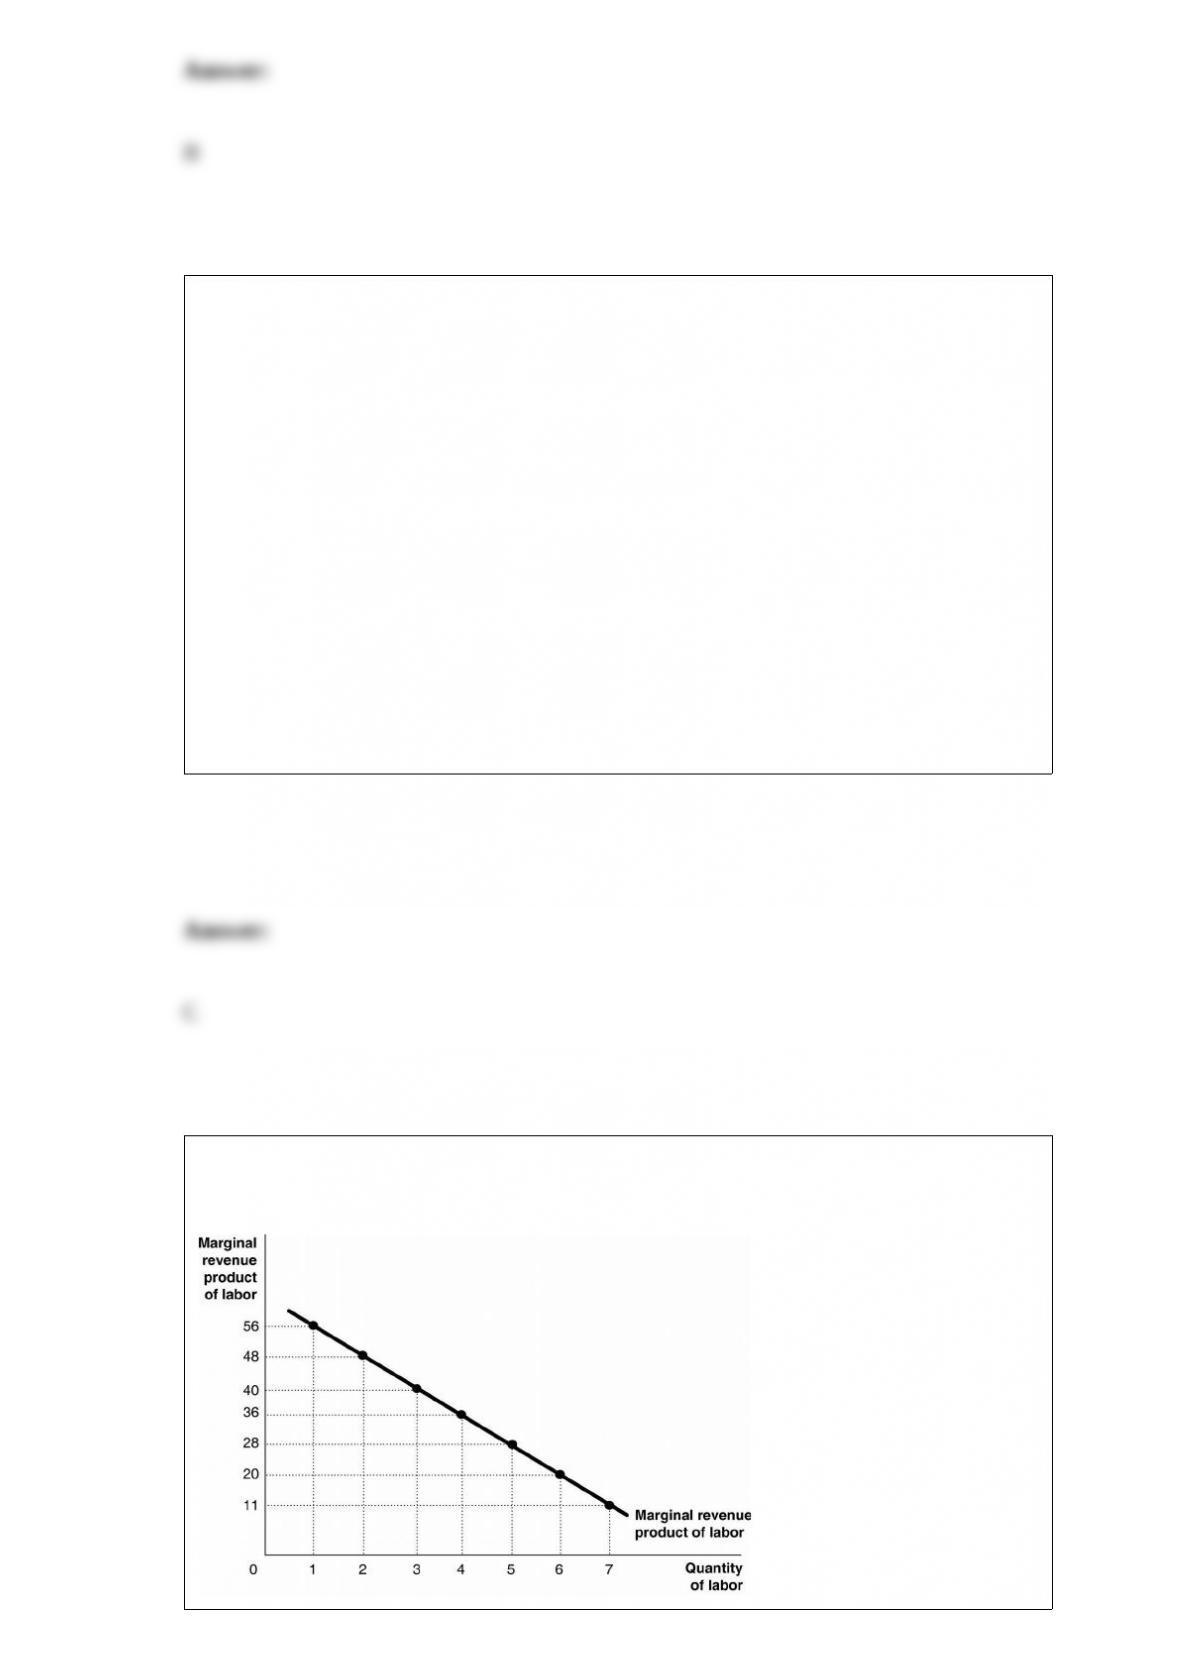
Figure 17-1

Figure 17-1 shows the marginal revenue product for Dale’s Hand-Sewn Doilies, a
producer of linen doilies.
Refer to Figure 17-1. If Dale can sell her doilies at $2 each, what is the marginal
product of the 5th worker?
A) $28
B) 28 doilies
C) 14 doilies
D) $56
Jill Johnson owns a pizzeria. She currently produces 10,000 pizzas per month at a total
cost of $500. If she produced one more pizza her total cost rises to $500.11. What does
this tell us about Jill’s marginal cost of producing pizzas?
A) The marginal cost of producing pizzas is constant.
B) The marginal cost of producing pizzas is falling.
C) The marginal cost of producing pizzas is rising.
D) The marginal cost of producing pizzas cannot be determined without more
information.
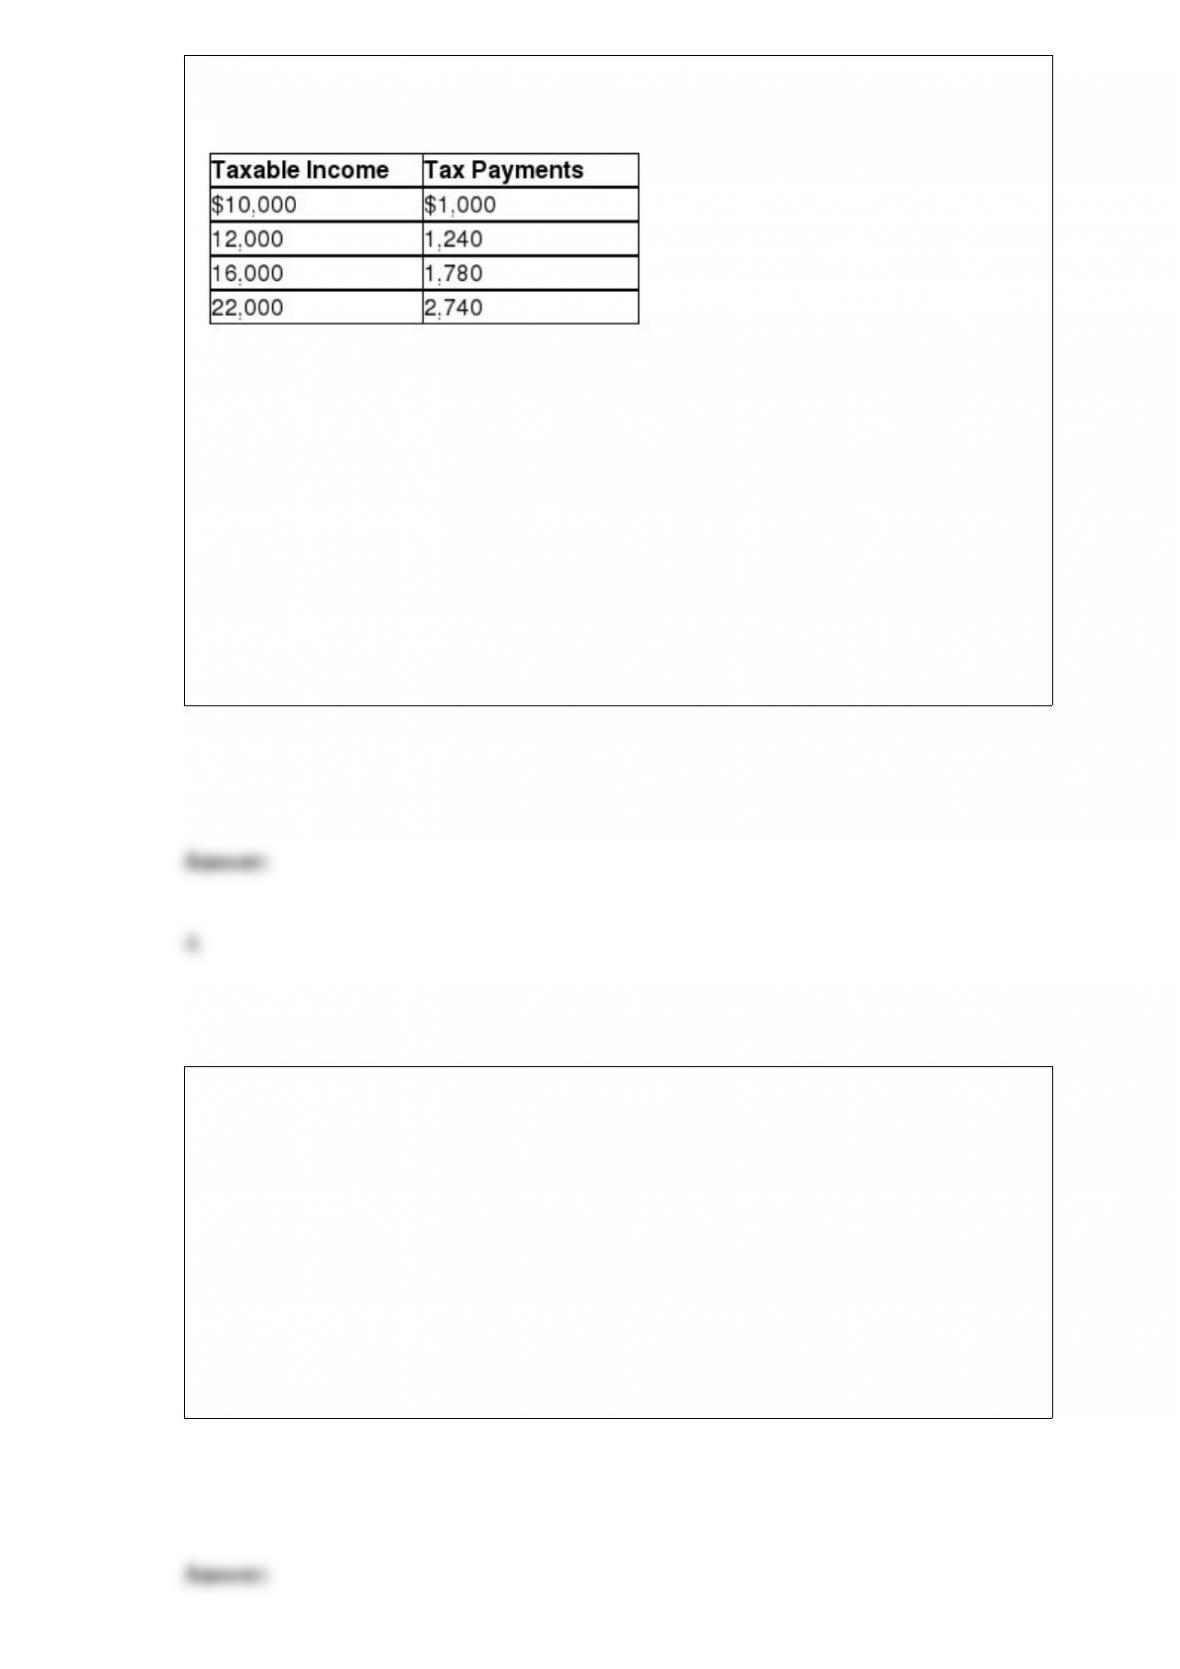
Table 18-7
Table 18-7 shows the amount of taxes paid on various levels of income.
Refer to Table 18-7. The tax system is
A) progressive throughout all levels of income.
B) proportional throughout all levels of income.
C) regressive throughout all levels of income.
D) progressive between $10,000 and $12,000 of income and regressive between
$16,000 and $22,000.
Which of the following conditions holds in an economically efficient competitive
market equilibrium?
A) The deadweight loss is positive but at a minimum.
B) Producer and consumer surplus are exactly equal in size.
C) There are no positive and no negative external effects from consumption and
production.
D) The marginal benefit of the last unit produced and consumed is maximized.

Policymakers focus on marginal tax rate changes when making changes in the tax code
because the marginal tax rate
A) determines how tax revenue will change as national income increases.
B) affects people’s willingness to work, save, and invest.
C) always equals the average tax rate which is harder to measure.
D) determines how much revenue the government will have to spend.
Exemptions and deductions are used
A) to add to taxes that must be paid.
B) by taxpayers to reduce the amount of income subject to tax.
C) to determine the type of tax structure.
D) to determine what items are subject to sales taxes.

If, as a perfectly competitive industry expands, it can supply larger quantities at the
same long-run market price, it is
A) a constant-cost industry.
B) an increasing-cost industry.
C) a decreasing-cost industry.
D) a fixed-cost industry.
If, in response to a decrease in the price of grapes, the quantity of grapes demanded
increases, economists would describe this as
A) an increase in demand.
B) an increase in quantity demanded.
C) a change in consumer income.
D) an increase in consumers’ taste for grapes.
Suppose Barry is maximizing his utility from consuming used paperback novels and
audio books. The price of a used novel = $4 and the price of an audio book = $8. If the
marginal utility of the last novel was 32 units of utility (utils) what was the marginal
utility of the last audio book purchased?

A) 2 utils
B) 12 utils
C) 16 utils
D) 64 utils
If the slope of a demand curve is equal to -0.1 then
A) demand is inelastic.
B) we don’t know whether the demand is elastic or inelastic.
C) the demand is elastic at low prices and inelastic at high prices.
D) as price increases by 10 percent quantity demanded decreases by 1 percent.
Stan owns a software design business. He obtained a bank loan to buy computer
equipment for his business. He pays $1,000 per month for interest on the loan. He has
10 employees, each of whom is paid $4,000 per month. Because his business has been
successful, next month he will increase employee wages to $5,000. If the revenue from
his business remains at its current level, Stan is considering an addition to his office.
Which of the following statements regarding Stan’s business is false?
A) The payments Stan makes to his employees are variable costs and explicit costs.
B) The monthly payment Stan makes for his bank loan is an implicit cost.
C) The monthly payment Stan makes for his bank loan is a fixed cost.
D) The time and effort Stan spends on his software design business is an implicit cost.
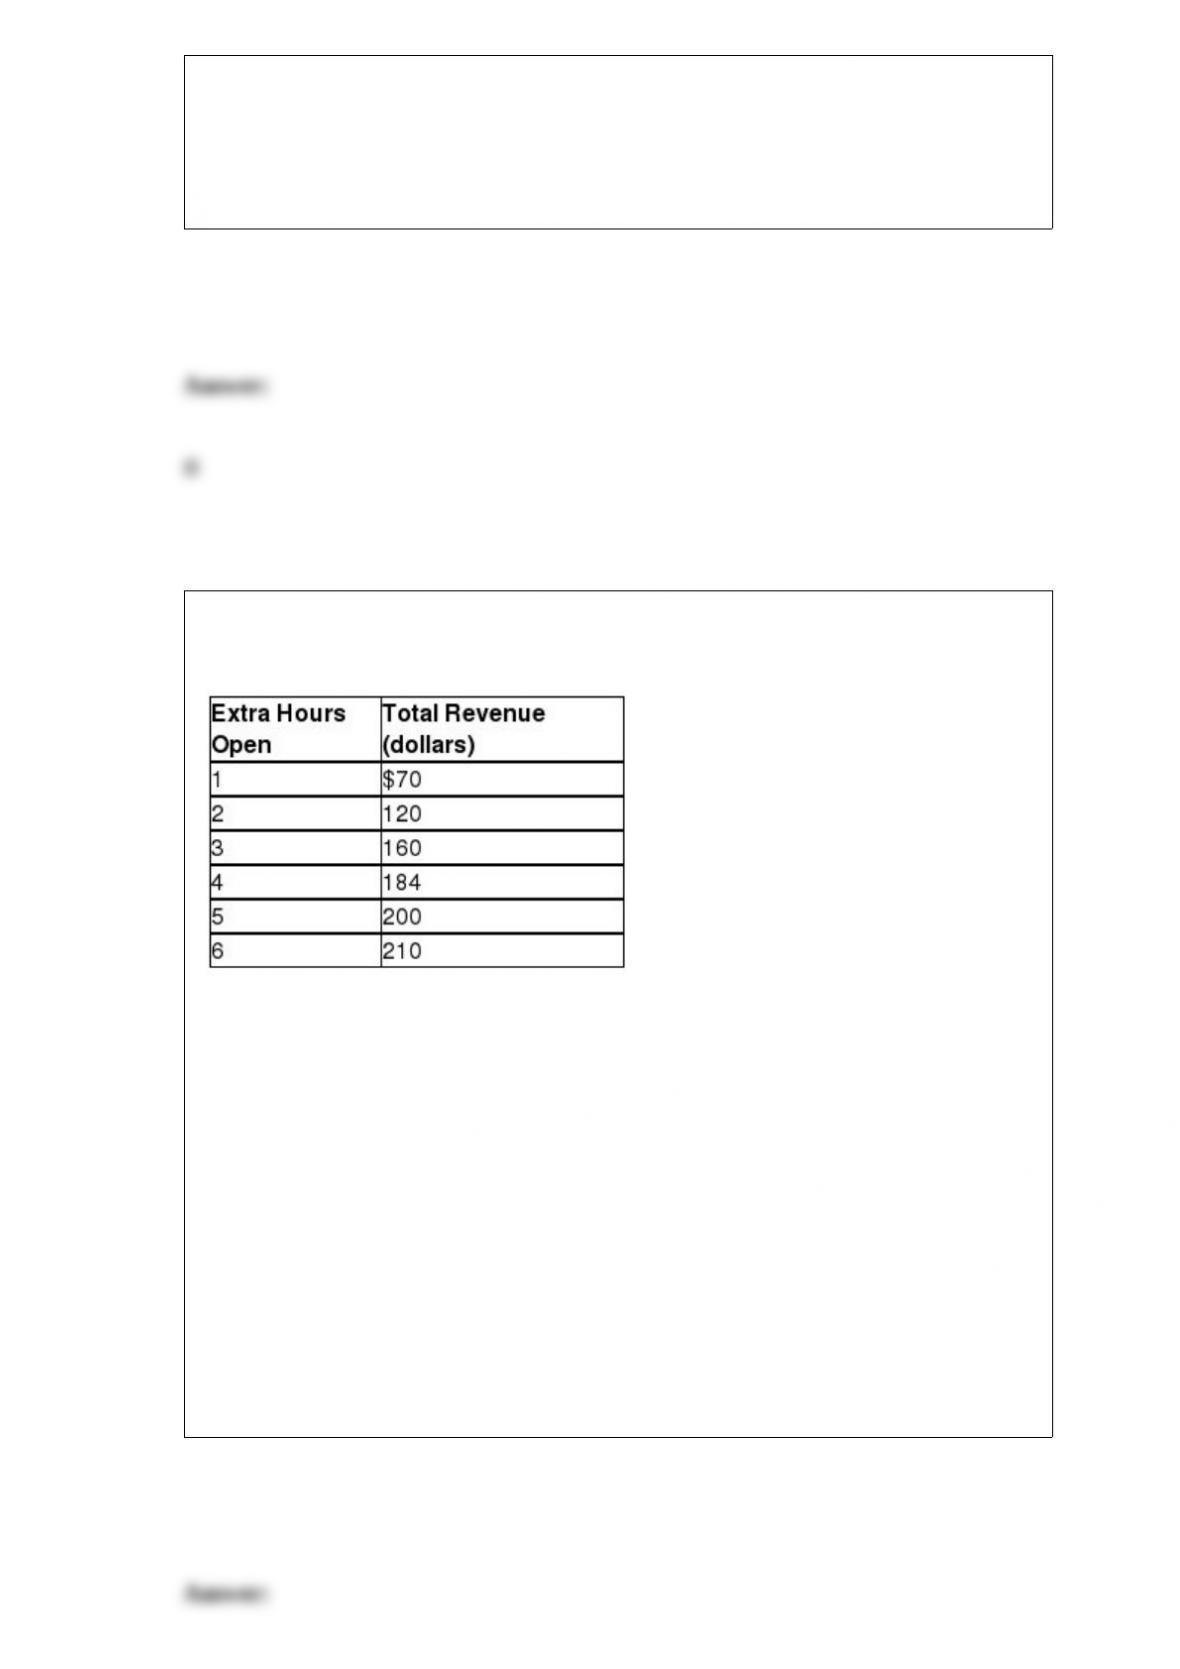
Table 1-3
Santiago runs a comic book store in the town of East Arbor. He is debating whether he
should extend his hours of operation. Santiago figures that his sales revenue will
depend on the number of extra hours the store is open as shown in the table above. He
would have to hire a worker for those extra hours at a wage rate of $18 per hour.
Refer to Table 1-3. What is Santiago’s marginal benefit if he decides to stay open for an
extra two hours instead of one hour?
A) $40
B) $50
C) $120
D) $190

When you purchase a new set of spurs you do so in the
A) resource market.
B) product market.
C) input market.
D) factor market.
Figure 15-15
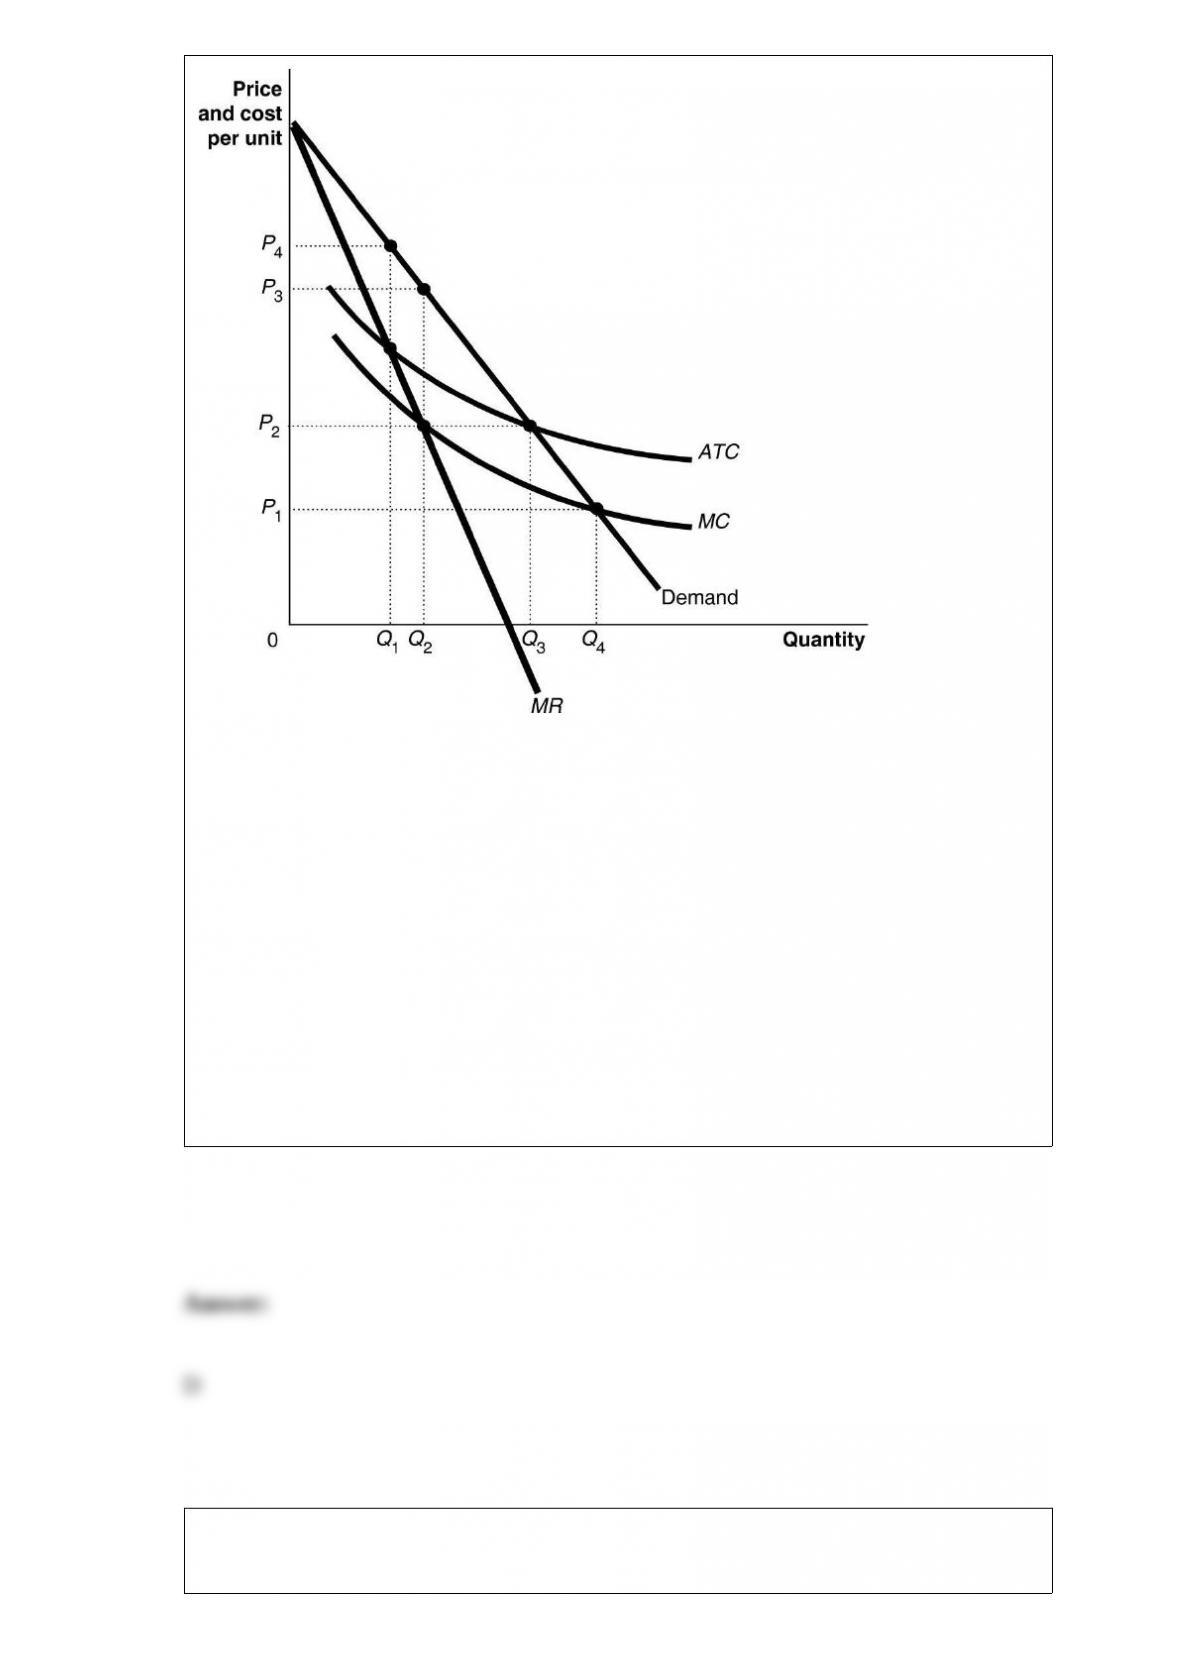
Figure 15-15 shows the cost and demand curves for the Erickson Power Company.
Refer to Figure 15-15. Why won’t regulators require that Erickson Power produce the
economically efficient output level?
A) because there is insufficient demand at that output level
B) because at the economically efficient output level, the marginal cost of producing the
last unit sold exceeds the consumers’ marginal value for that last unit
C) because Erickson Power will earn zero profit
D) because Erickson Power will sustain persistent losses and will not continue in
business in the long run
In the United States, barriers to entry in professional team sports (for example, football
and baseball) result from

A) the draft of college players, which grants teams exclusive signing rights to
individual players.
B) long-term leases teams sign for stadiums and ballparks in major cities.
C) television contracts, which give networks the exclusive rights to broadcast games.
D) the reserve clause, which is a provision in contracts of professional athletes that
require them to play for specific teams over the length of their contracts.
The change in a firm’s total cost from producing one more unit of a good or service is
the firm’s
A) explicit cost of production.
B) marginal cost of production.
C) average cost of production.
D) implicit cost of production.
Select the phrase that correctly completes the following statement. “A positive change
in technology caused an increase in the supply of flat-screen televisions. As a result
________.”
A) the price of flat-screen televisions decreased and the demand for flat-screen

televisions increased
B) the equilibrium quantity of flat-screen televisions decreased
C) the price of flat-screen televisions decreased and the quantity demanded of
flat-screen televisions increased
D) the price of flat-screen televisions decreased. The lower price caused the supply of
flat-screen televisions to decrease
Which of the following statements is true?
A) An increase in demand causes a change in equilibrium price; the change in price
does not cause a further change in demand or supply.
B) A decrease in supply causes equilibrium price to rise; the increase in price then
results in a decrease in demand.
C) If both demand and supply increase there must be an increase in equilibrium price;
equilibrium quantity may either increase or decrease.
D) If demand decreases and supply increases one cannot determine if equilibrium price
will increase or decrease without knowing which change is greater.