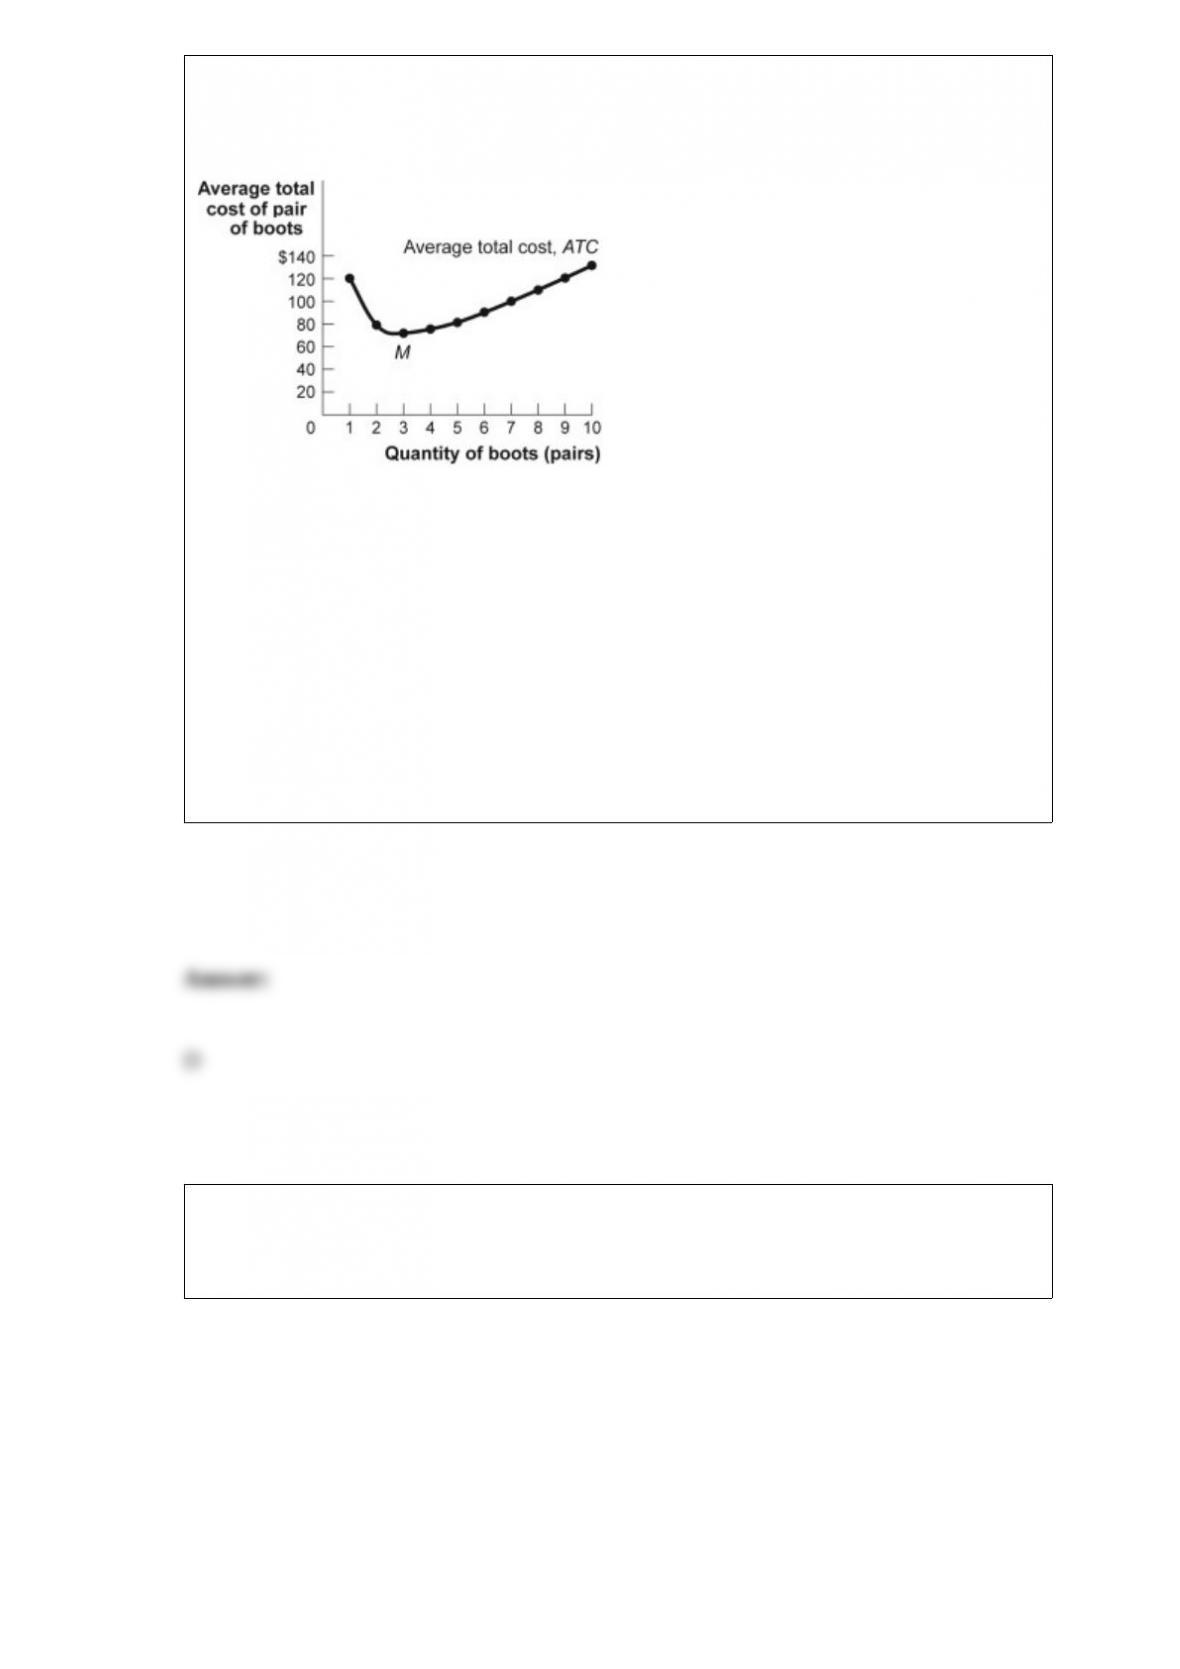
Figure: The Average Total Cost Curve
(Figure: The Average Total Cost Curve) Look at the figure The Average Total Cost
Curve. The total cost of producing 10 pairs of boots is approximately:
A) $13.
B) $54.
C) $131.
D) $1,308.
Figure: Rent Controls
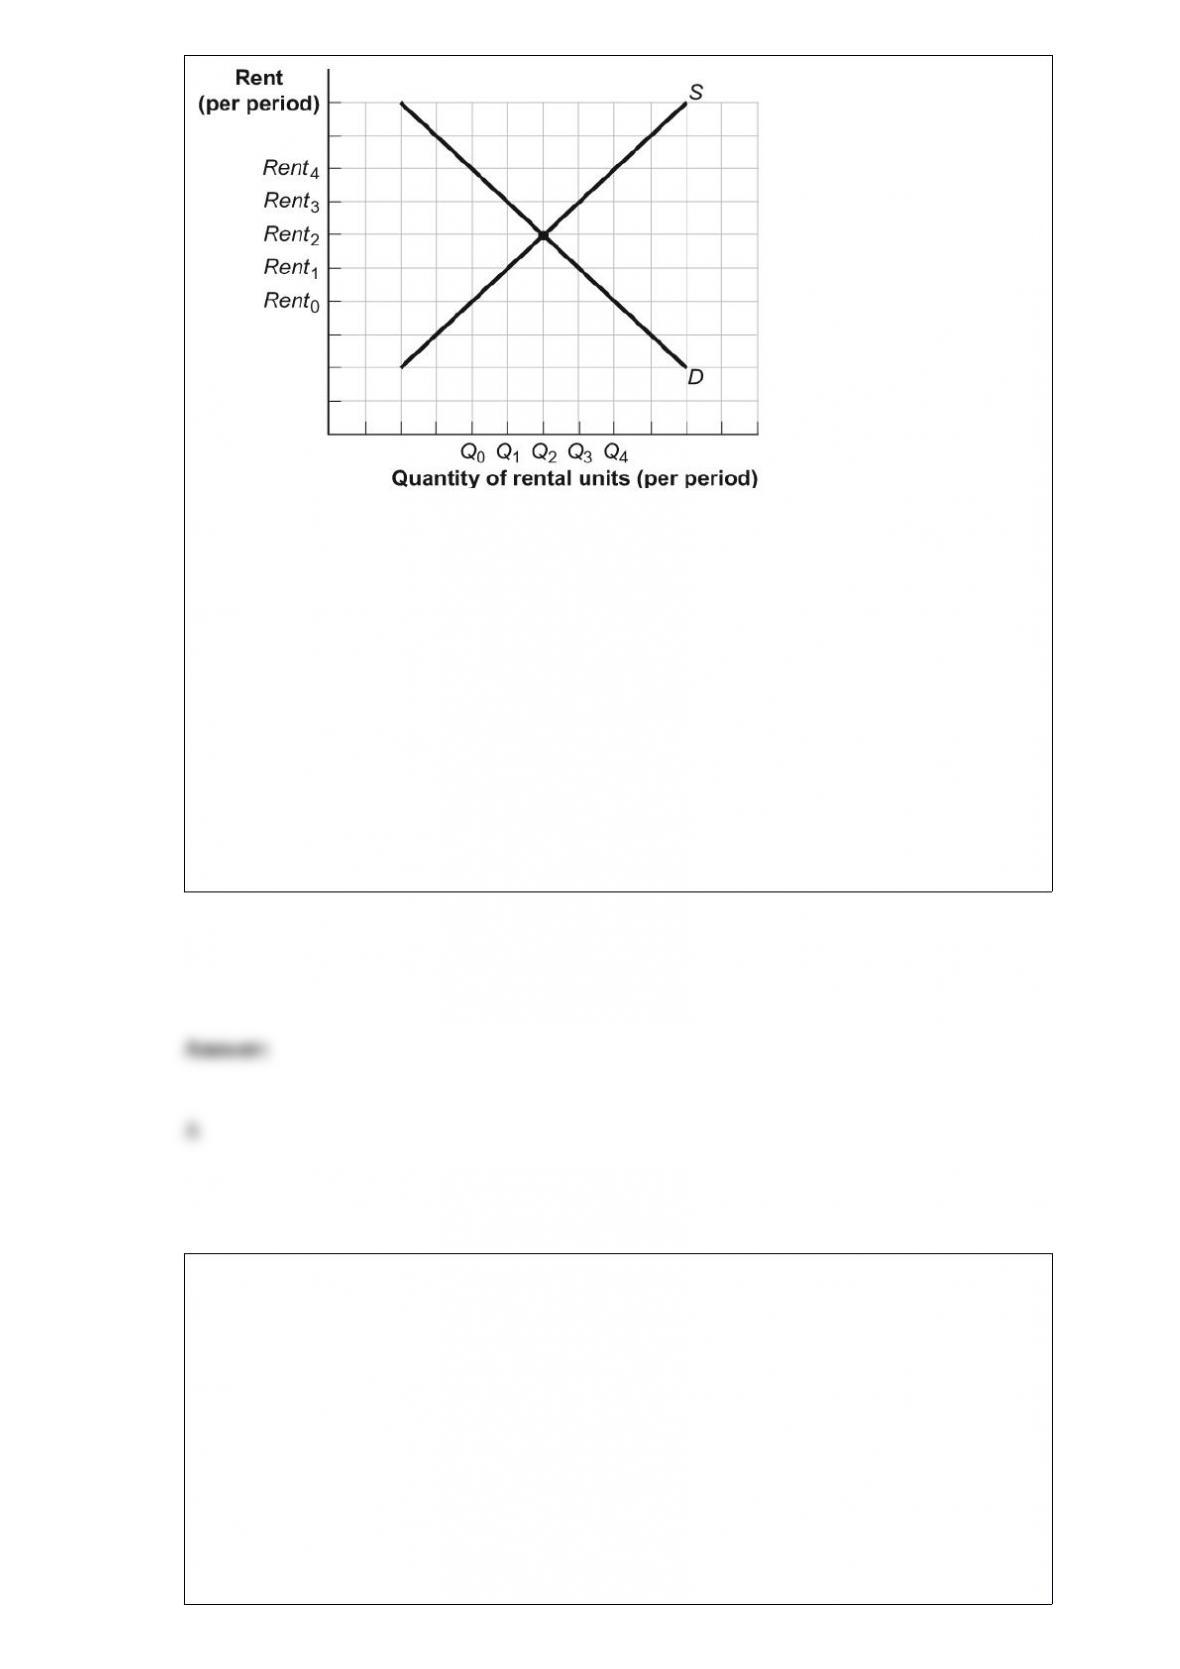
(Figure: Rent Controls) Look at the figure Rent Controls. If rent controls are imposed
and the government wants them to be immediately effective, they will most likely be set
at either _____ or _____.
A) Rent0; Rent1
B) Rent1; Rent3
C) Rent3; Rent4
D) Rent2; Rent4
A competitive firm operating in the short run is producing at the output level at which
ATC is at a minimum. If ATC = $8 and MR = $9, to maximize profits (or minimize
losses), this firm should:
A) increase output.
B) reduce output.
C) increase price.
D) do nothing; the firm is already maximizing profits.

Suppose the marginal cost curve in the short run first decreases and then increases. If
marginal cost is increasing, _____ must be _____.
A) marginal product; increasing
B) average variable cost; increasing
C) average total cost; increasing
D) marginal product; decreasing
In economics, a marginal value refers to:
A) the value associated with an unimportant, or marginal, activity.
B) a value entered as an explanatory item in the margin of a balance sheet or other
accounts.
C) the value associated with one more unit of an activity.
D) a value that is most appropriately identified in a footnote.
For a good to be considered normal, the _____ elasticity of demand must be _____.
A) income; between 1 and 0
B) cross-price; less than 0
C) cross-price; equal to 0
D) income; greater than 0
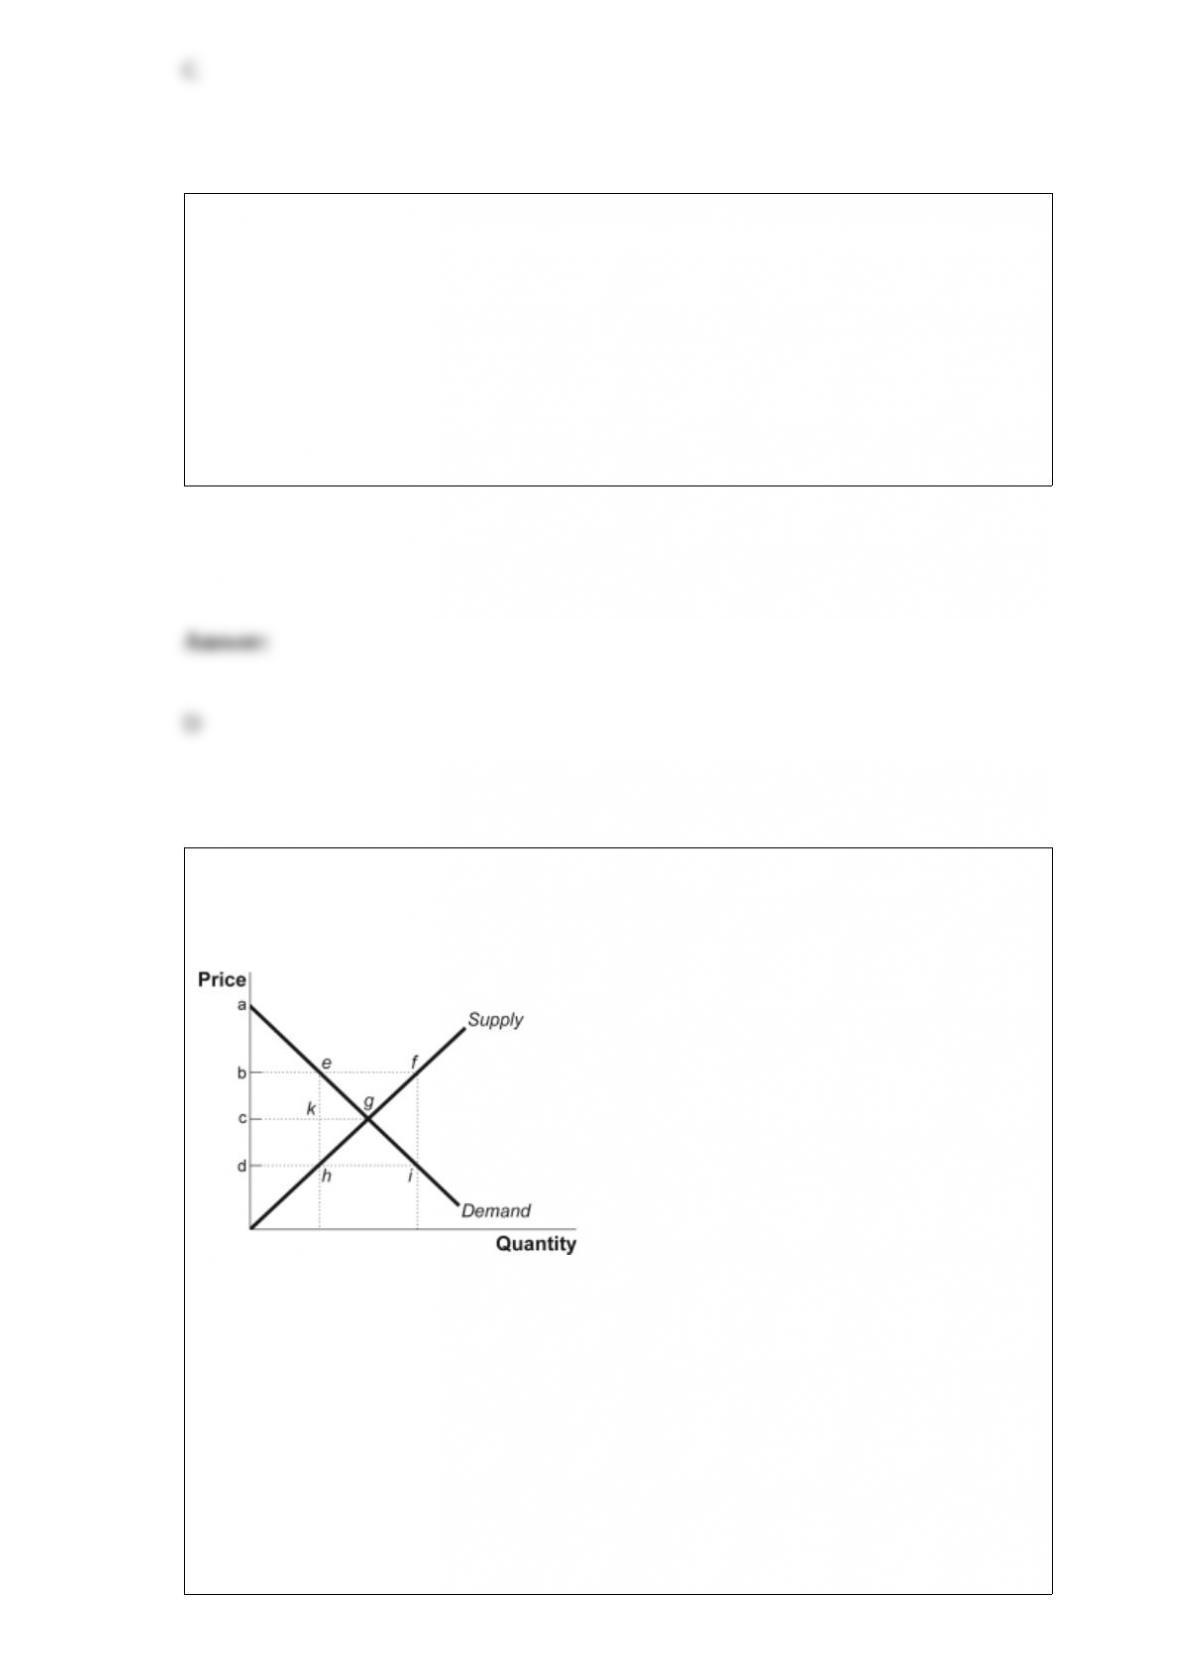
Figure: Price Controls
(Figure: Price Controls) Look at the graph Price Controls. An effective price floor
would be at price _____ and a _____ would result from the difference between points
_____.
A) c; surplus; f and e
B) b; surplus; f and e
C) d; shortage; i and h
D) b; shortage; f and e
An advantage of employment-based insurance is that it:
A) increases moral hazard.
B) increases the likelihood of adverse selection.
C) increases government tax revenues.
D) receives favorable tax treatment.
A perfectly competitive industry has 10 firms, each with an MC curve that can be
expressed as MC = 5q, where q is the level of output for each firm. The minimum point
of the AVC curve is $5. Which of the following equations would describe
upward-sloping portion of the industry supply curve for the industry, where Q is the
market quantity and P is the market price?
A) P = Q for Q ³ 10
B) P = 0.5Q for Q ³ 10
C) P = 2Q for Q ³ 10
D) P = Q for Q ³ 20
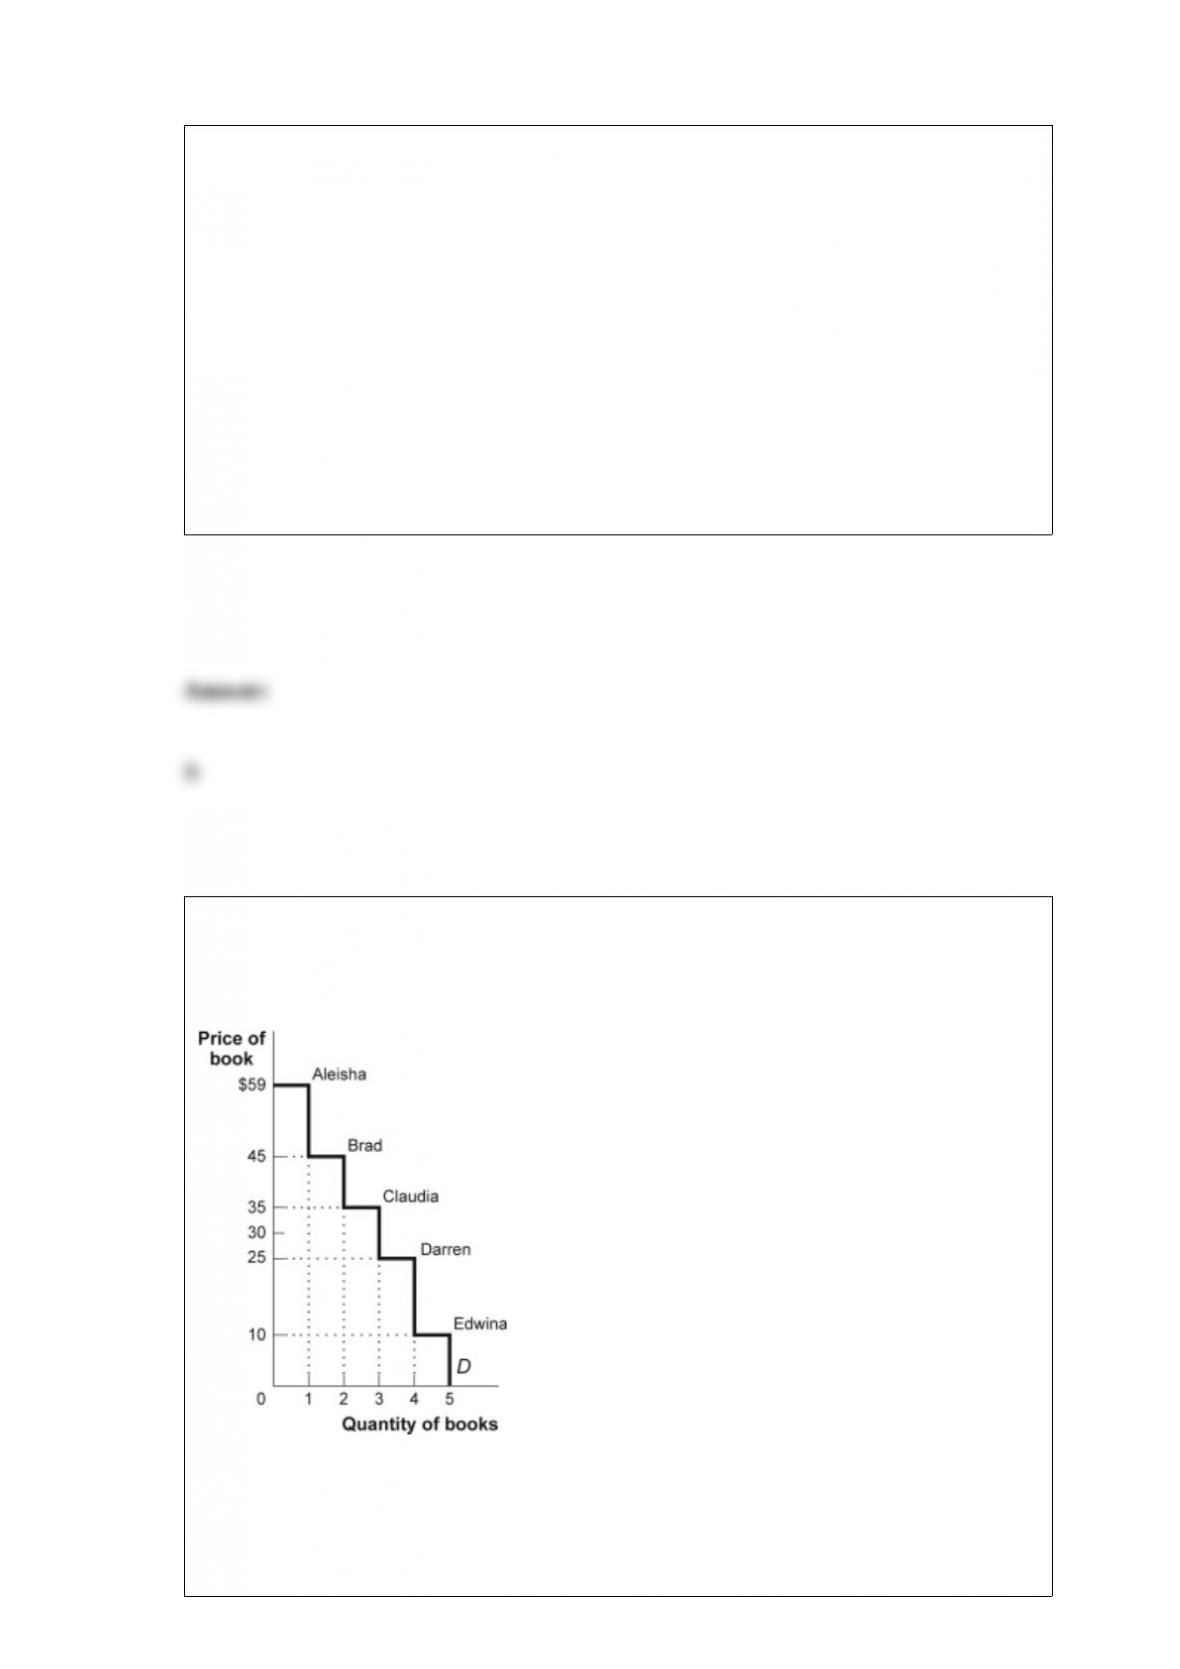
Figure: Consumer Surplus III
(Figure: Consumer Surplus III) In the figure Consumer Surplus III, total consumer
surplus is _____ when the price is $10.
A) $50
B) $59
C) $124
D) $144
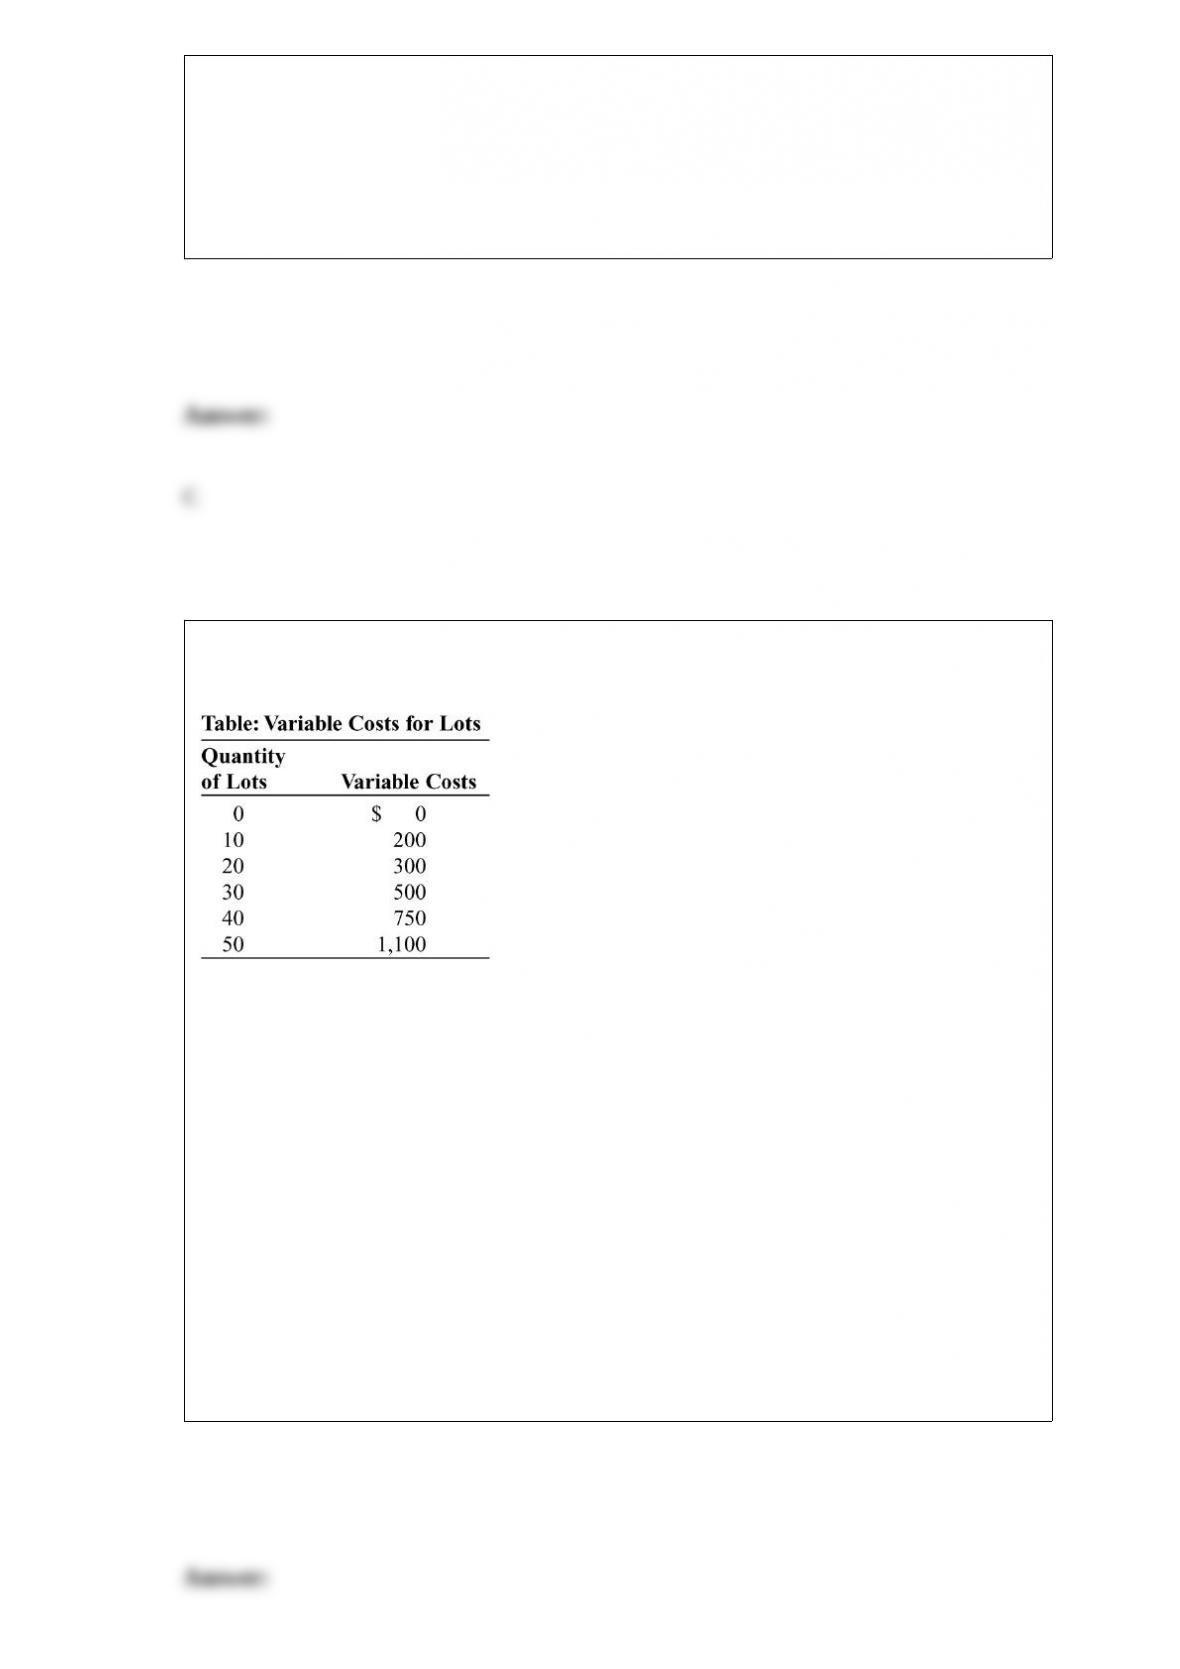
(Table: Variable Costs for Lots) Look at the table Variable Costs for Lots. During the
winter, Alexa runs a snow-clearing service in a perfectly competitive industry. Assume
that costs are constant in each interval; that is, the variable cost of clearing anywhere
from 1 through 10 lots is $200. Her only fixed cost is $1,000 for a snowplow. Her
variable costs include fuel, her time, and hot coffee. If the price to clear a lot is $30,
what is Alexa’s profit at the optimal output?
A) $1,200
B) $1,500
C) $0
D) “$550
Suppose at $10 the quantity demanded is 100. When the price falls to $8, the quantity
demanded increases to 130. The price elasticity of demand (using the midpoint formula)
between $10 and $8 is approximately:
A) 1.17.
B) 1.50.
C) 0.85.
D) 1.00.
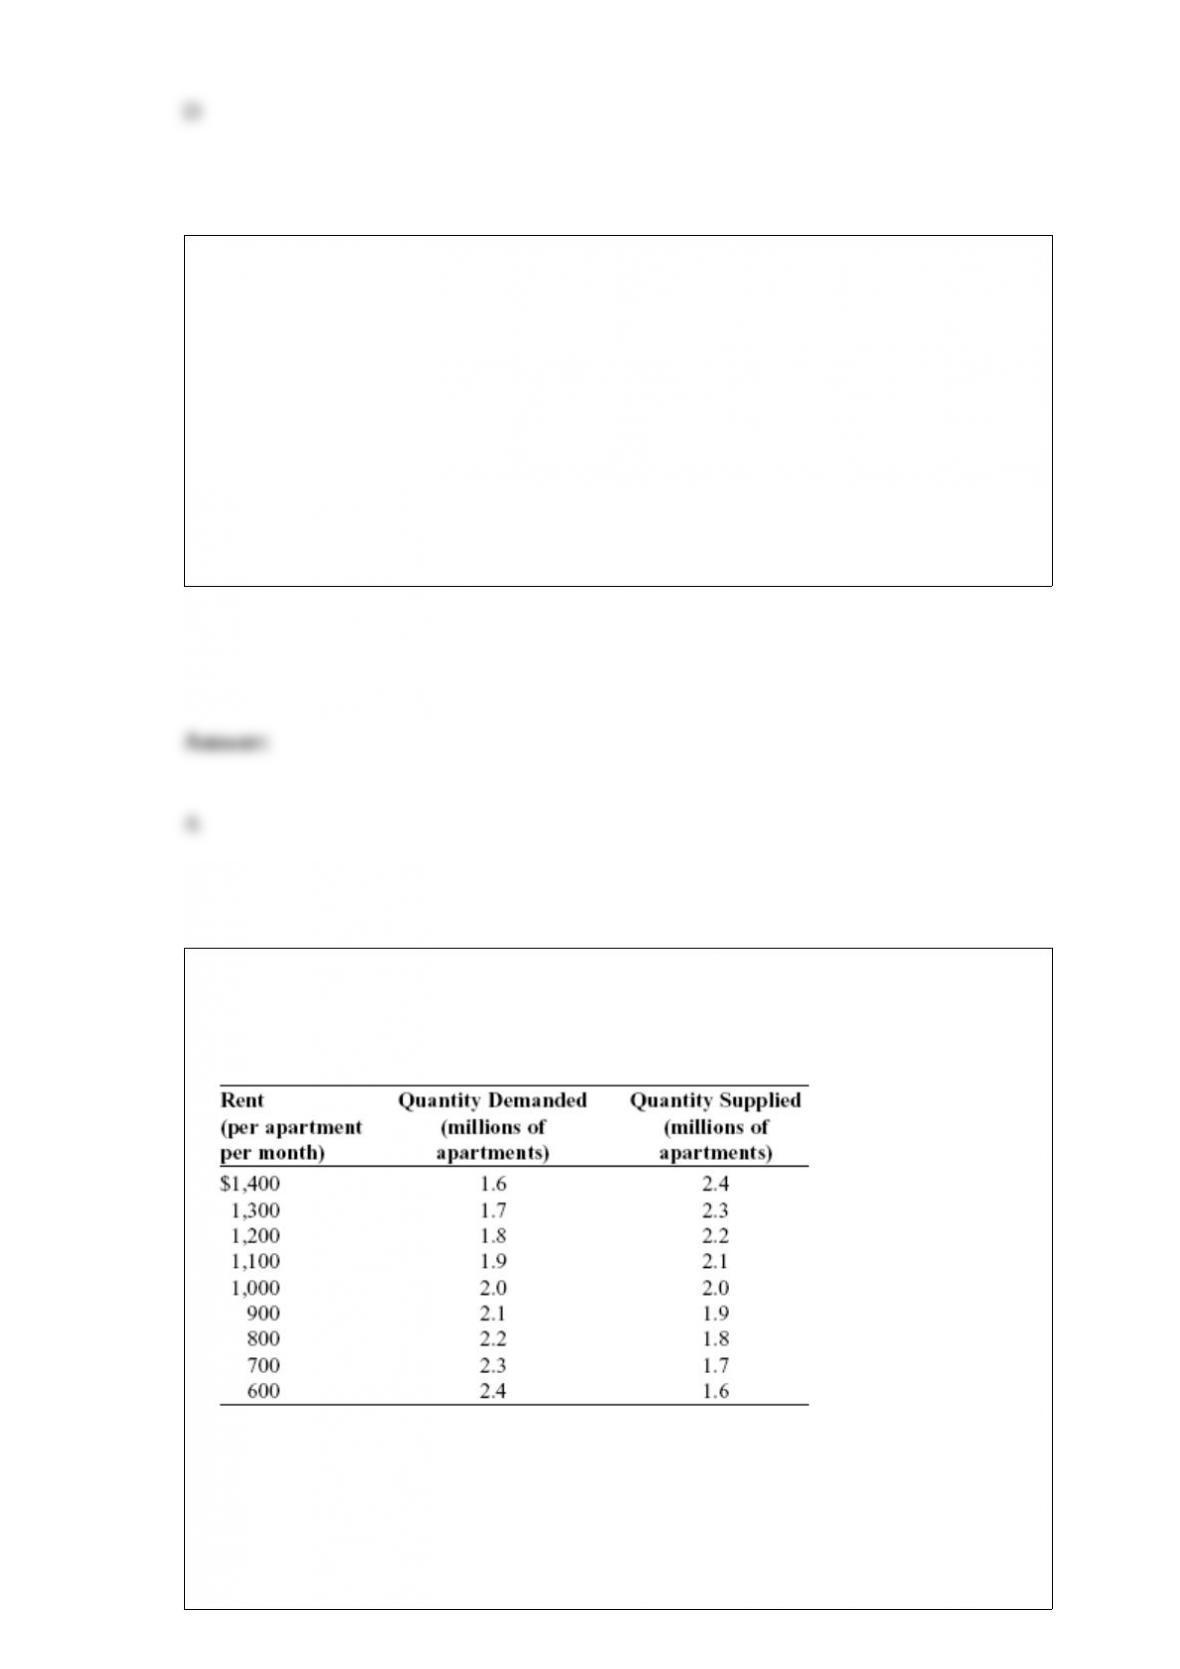
Table: Market for Apartments
(Table: Market for Apartments) Look at the table Market for Apartments. If a price
ceiling of $700 is imposed on this market, the result will be an inefficiency in the form
of a _____ million apartments.
A) surplus of 0.6

B) shortage of 0.6
C) surplus of 0.2
D) shortage of 0.2
Melika spends all of her income on magazines and carry-out lunches. The price of a
magazine is $5, and the price of a carry-out lunch is $7. At the current consumption
bundle, the marginal utility of magazines is 10, and the marginal utility of carry-out
lunches is 21. Assuming that diminishing marginal utility applies to both goods, to
maximize utility given her income, Melika should:
A) consume more carry-out lunches and fewer magazines.
B) consume more magazines and fewer carry-out lunches.
C) continue to consume the current bundle.
D) consume equal amounts of magazines and carry-out lunches.
A monopolist or an imperfectly competitive firm practices price discrimination
primarily to:
A) increase profits.
B) expand plant size.

C) lower total costs.
D) reduce marginal costs.
Which of the following is most likely an example of wage disparity due to differences
in talent and ability?
A) The median earnings of White men are more than the median earnings of African
Americans.
B) People with graduate degrees usually have higher earnings than people who did not
graduate from high school.
C) Nick Saban, the football coach at the University of Alabama, earns more than the
local high school football coach.
D) Crab fishermen on the Bering Sea earn more than clerks who sell goldfish at a pet
store.
Figure: Short-Run Monopoly
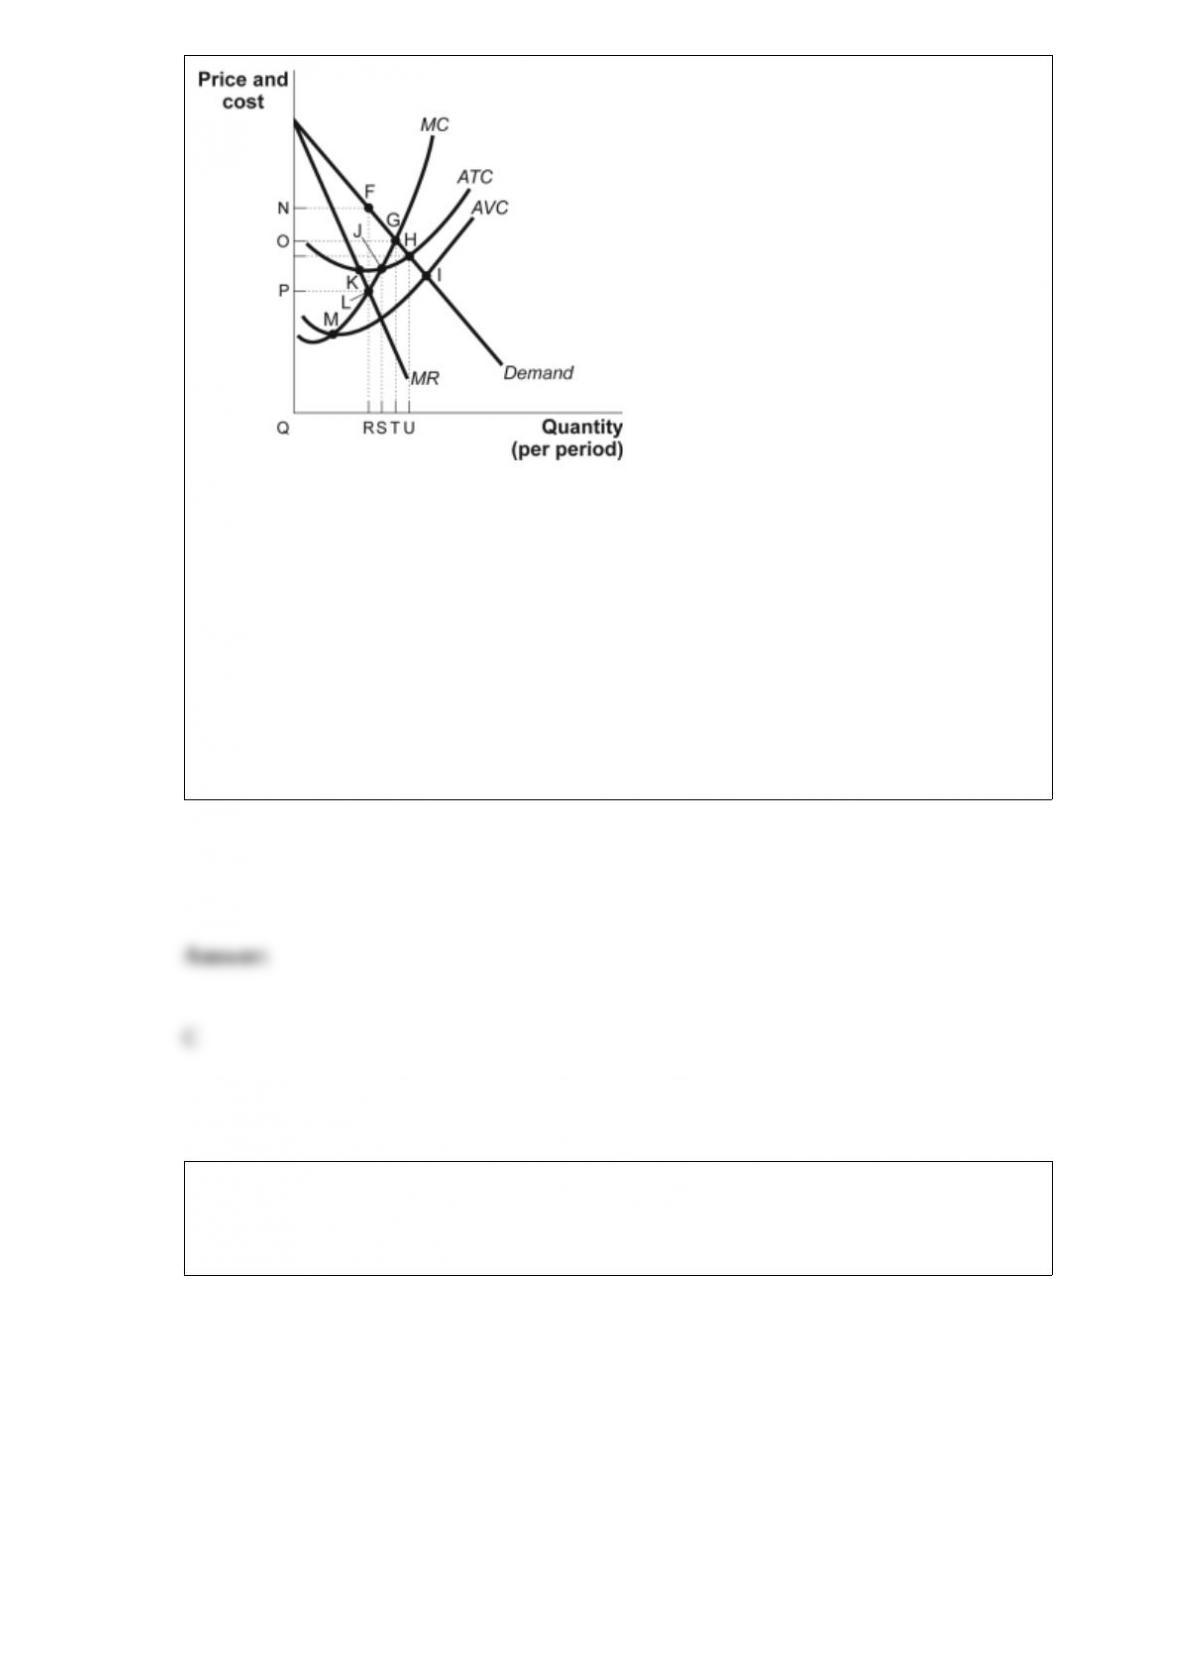
(Figure: Short-Run Monopoly) Look at the figure Short-Run Monopoly. The marginal
cost of producing the profit-maximizing quantity is cost:
A) N.
B) O.
C) P.
D) Q.
Figure: The Demand for Shirts
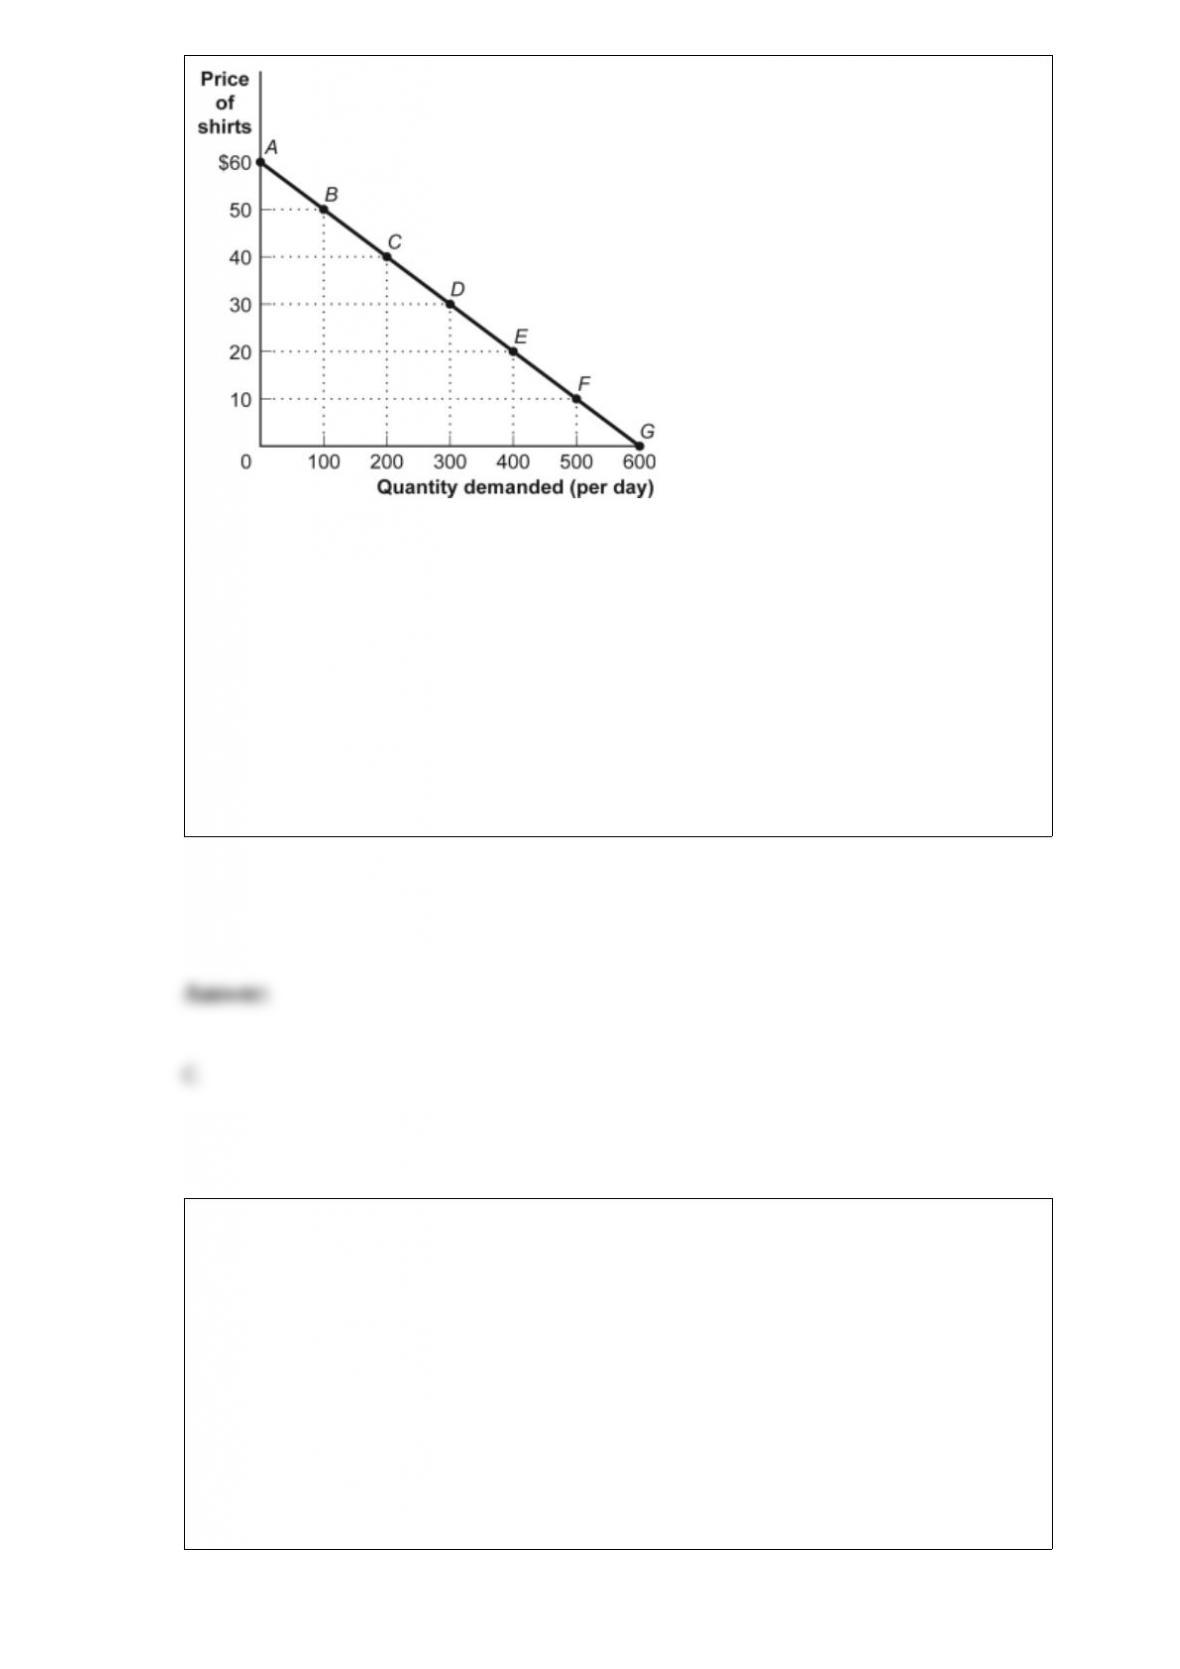
(Figure: The Demand for Shirts) Look at the figure The Demand for Shirts. By the
midpoint method, the price elasticity of demand for the segment EF is:
A) greater than 1.
B) less than the price elasticity of demand for segment FG.
C) less than the price elasticity of demand for segment DE.
D) greater than the price elasticity of demand for segment AB.
An external benefit is a:
A) negative externality.
B) benefit that accrues to domestic firms as a result of the actions of foreign (external)
firms.
C) benefit that accrues to foreign (external) firms as a result of the actions of domestic
firms.
D) benefit that individuals or firms confer on others without receiving compensation.

The deadweight loss from an excise tax is largest if demand is _____ and supply is
_____.
A) elastic; inelastic
B) inelastic; elastic
C) inelastic; inelastic
D) elastic; elastic
Figure: Game-Day Shirts
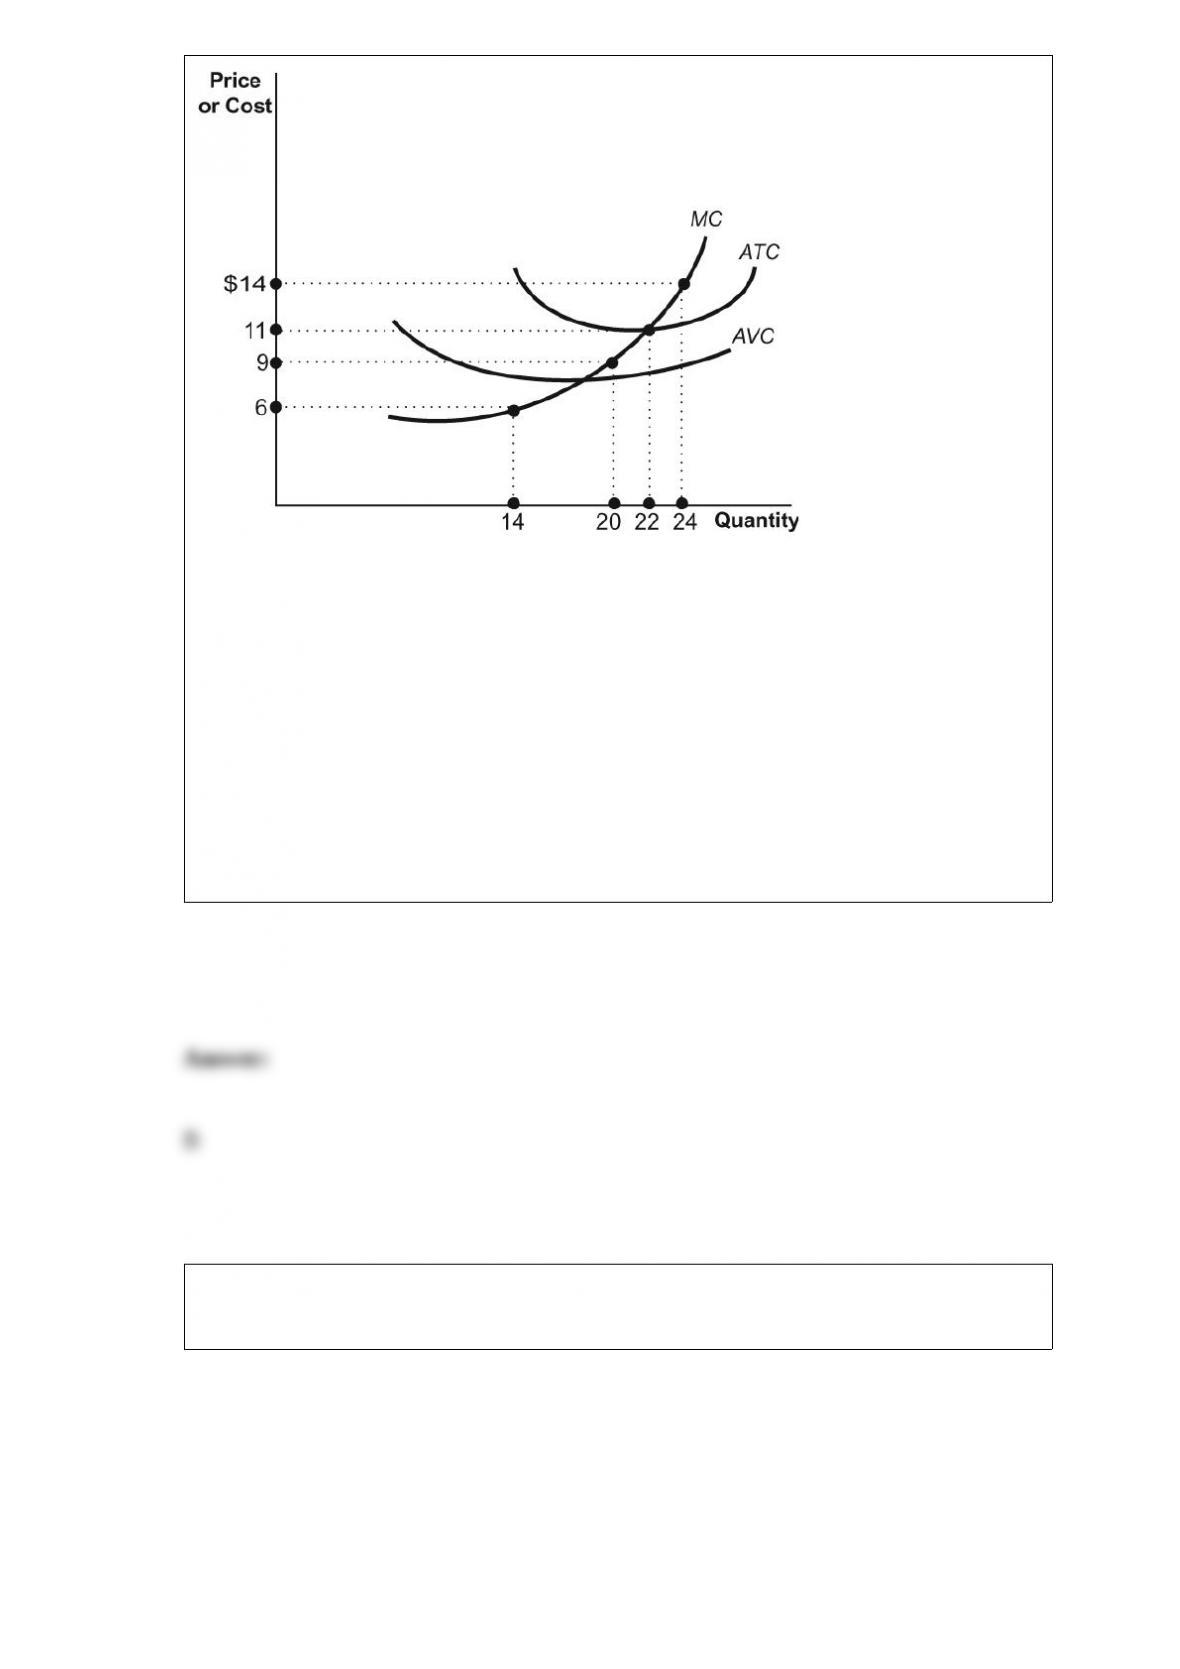
(Figure: Game-Day Shirts) Rick is one of 10 vendors who sell game-day T-shirts at
football games in a perfectly competitive market. His costs are identical to the costs of
the other 9 vendors. If the price of a shirt is $9, in the long run:
A) firms will enter the industry.
B) firms will exit the industry.
C) the industry is in equilibrium.
D) the industry has minimized average total cost.
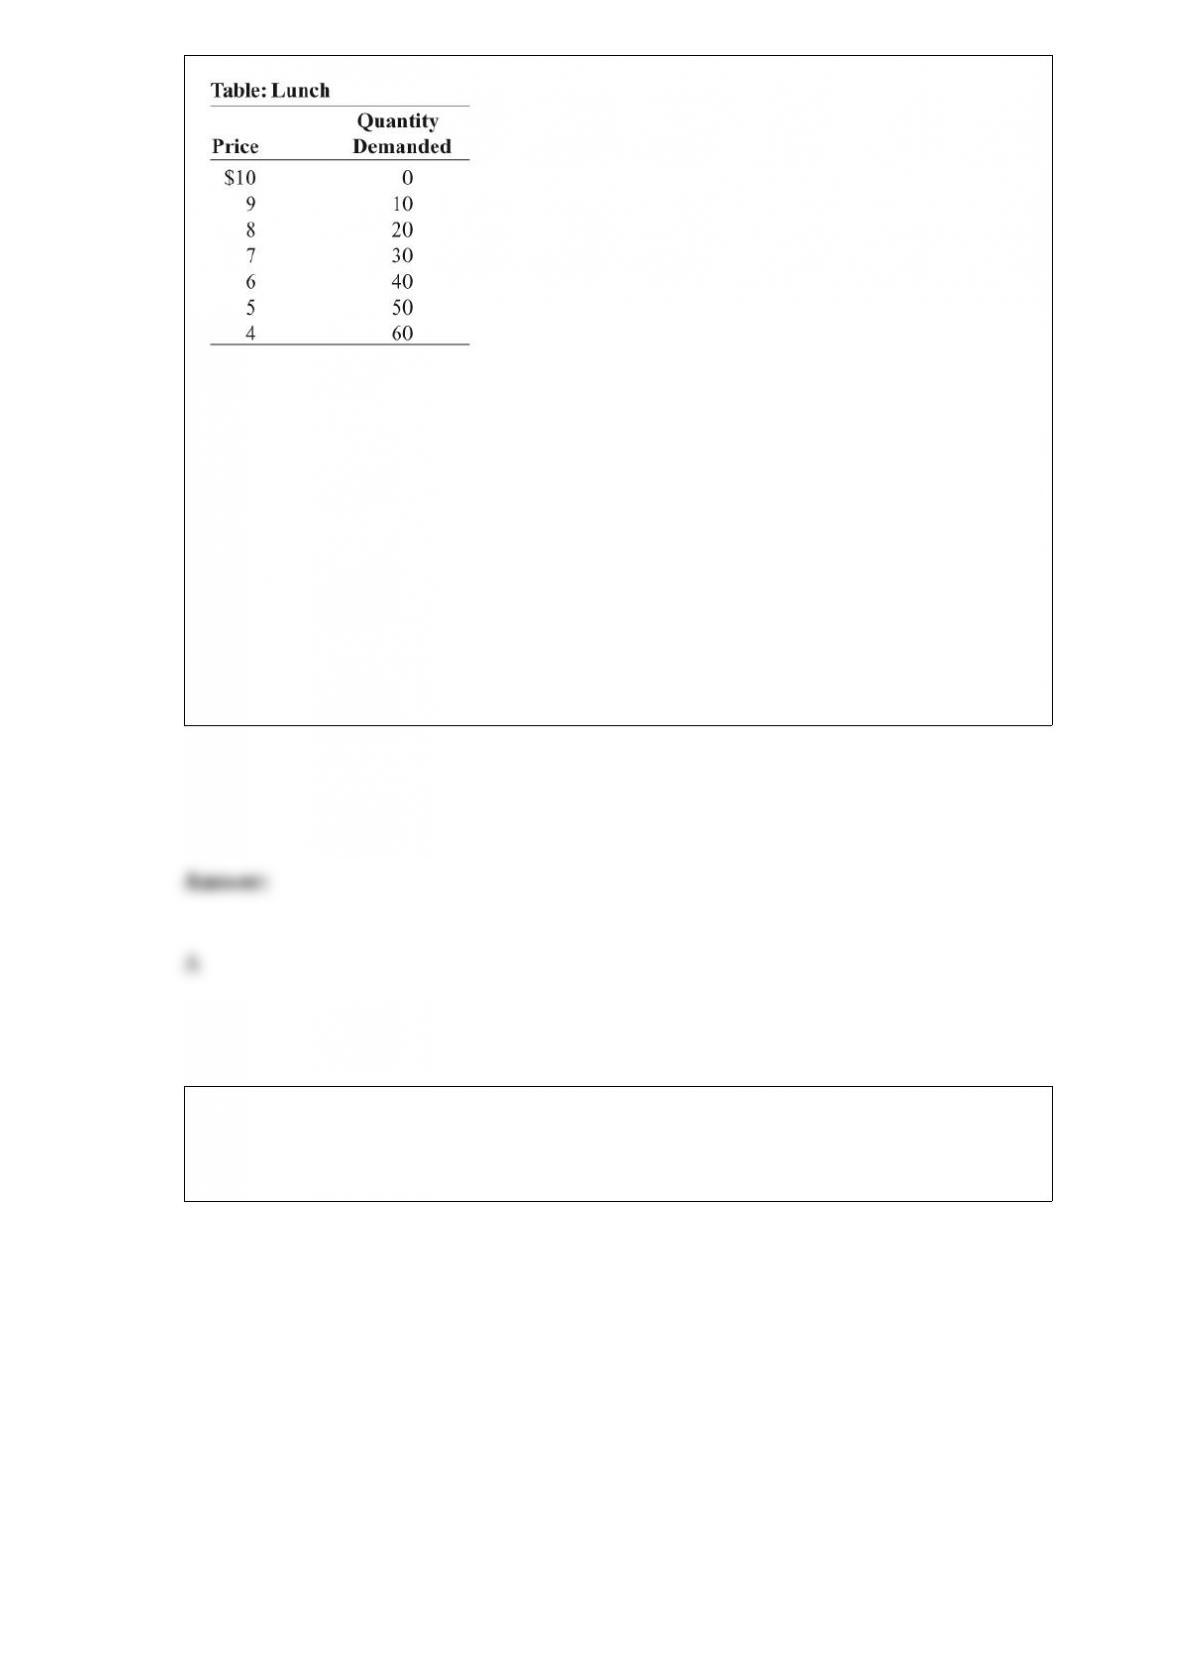
(Table: Lunch) Look at the figure Lunch. Joe makes and sells picnic lunches to people
taking all-day rafting trips on the river. The marginal cost and average cost of each
lunch are a constant $4. If Joe is a monopolist, what is deadweight loss in the long run?
A) $45
B) $90
C) $180
D) $360
Figure: The Demand for Shirts
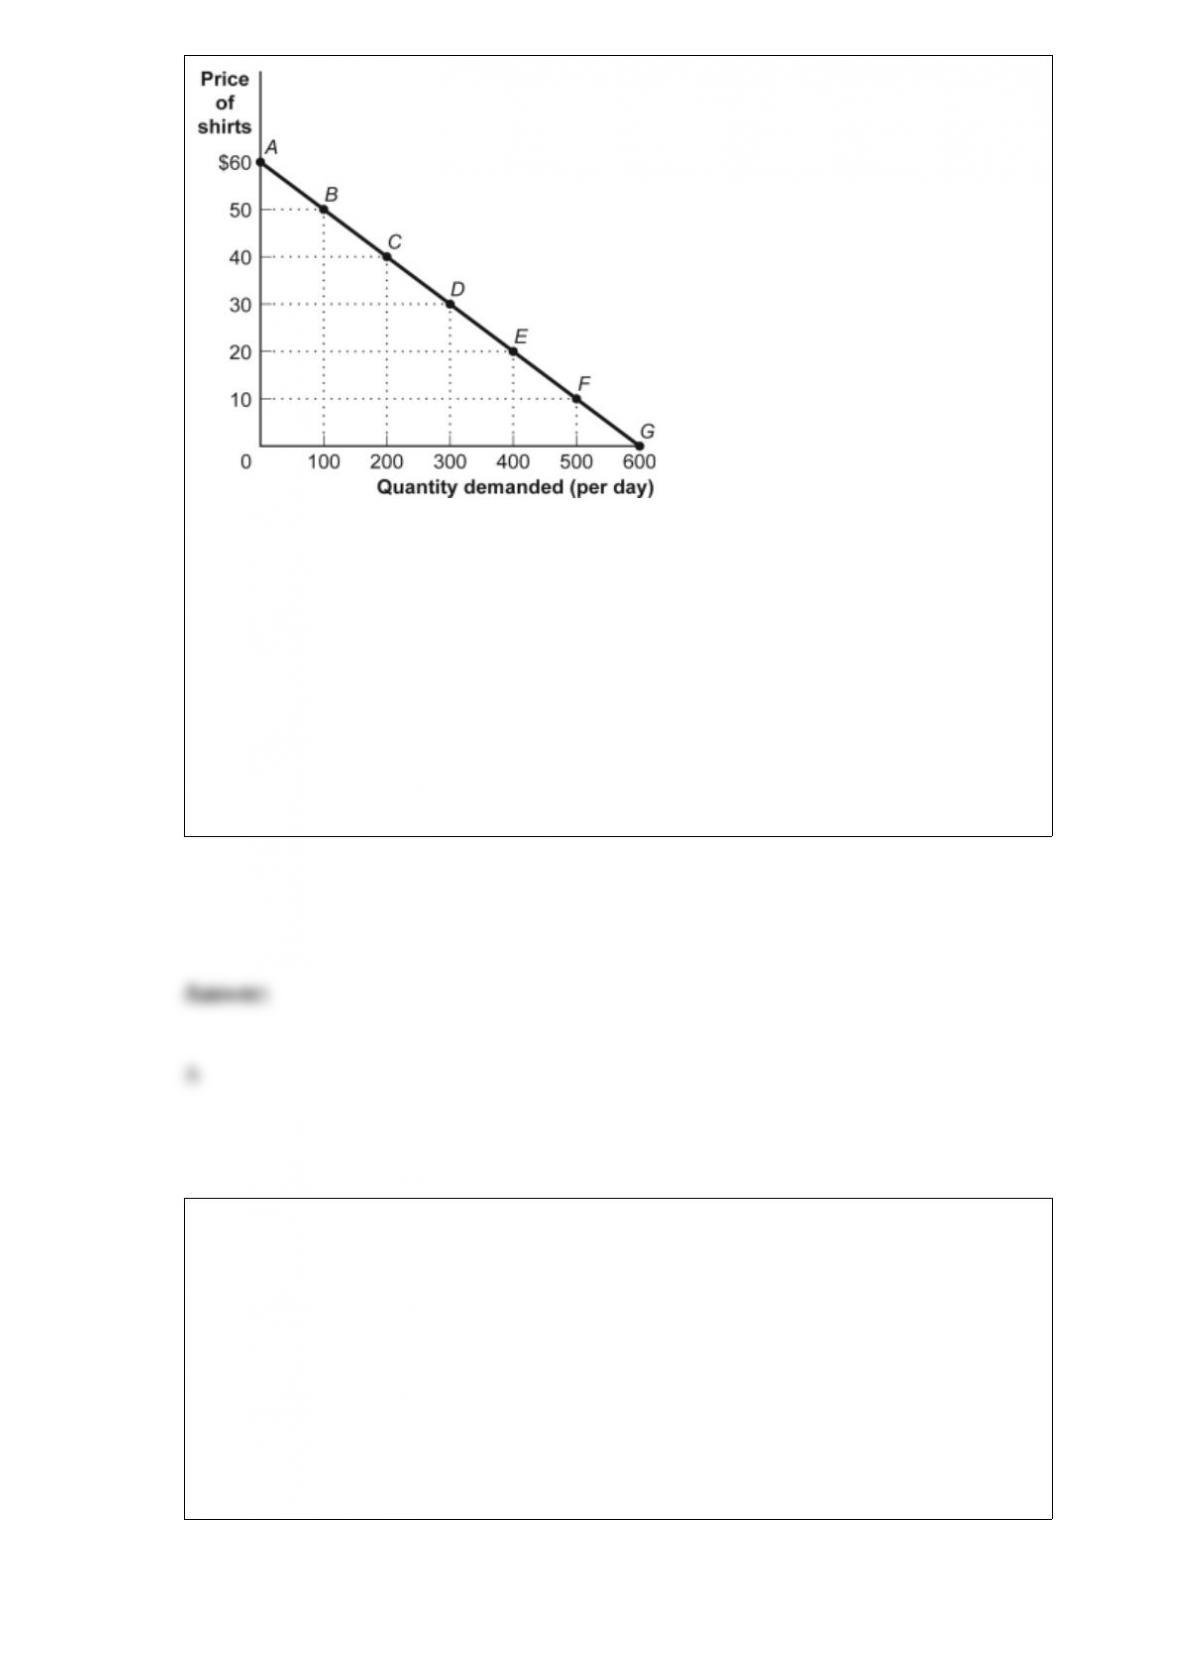
(Figure: The Demand for Shirts) Look at the figure The Demand for Shirts. Total
revenue is maximized if the price is:
A) $30.
B) $40.
C) $50.
D) $60.
When a new medical report extols the health advantages of grapefruit, assuming an
upward-sloping supply curve, producer surplus in the grapefruit market:
A) will increase.
B) will decrease.
C) will remain the same.
D) may change, but we can’t tell how.
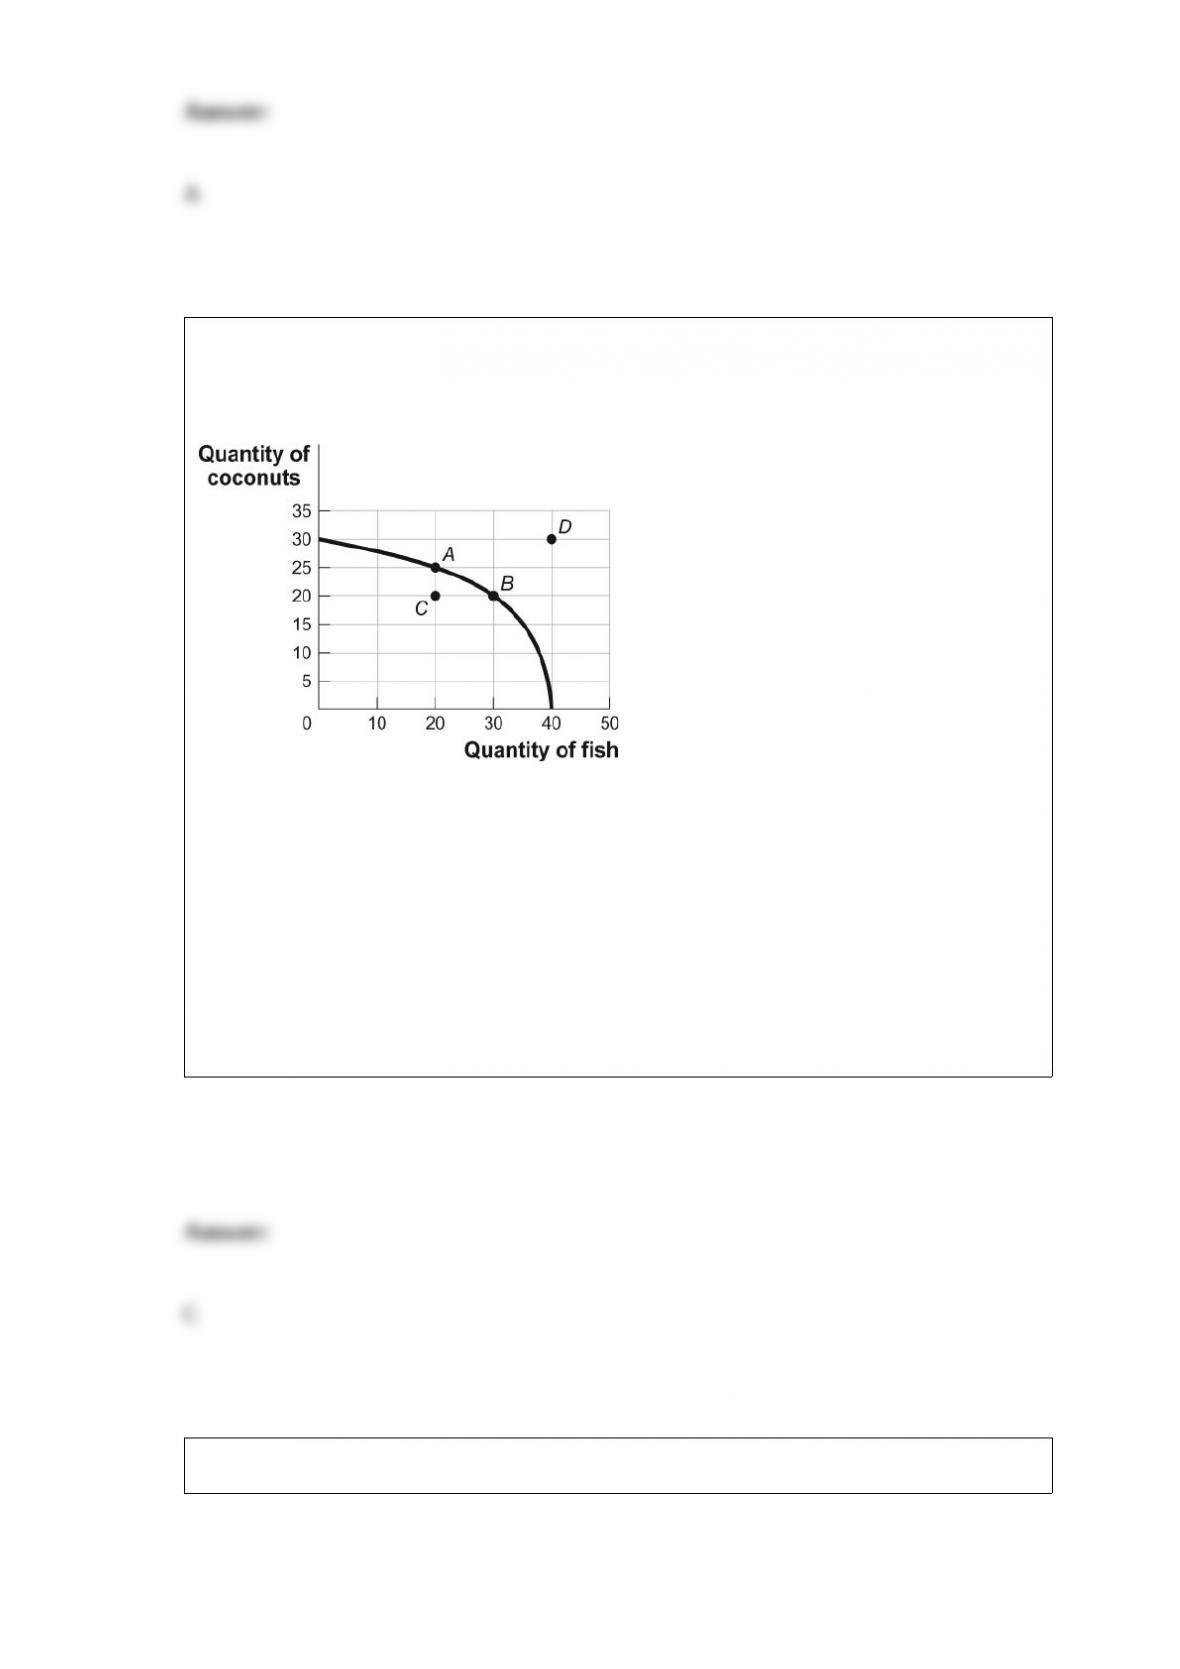
Figure: Tom’s Production Possibilities
(Figure: Tom’s Production Possibilities)
Look at the figure Tom’s Production Possibilities. The opportunity cost for Tom to move
from point A on the curve to point B is:
A) 10 coconuts.
B) 10 fish.
C) 5 coconuts.
D) 5 fish.

(Table: Income and Utility for Rahim) Look at the table Income and Utility for Rahim.
Rahim’s expected utility from income is:
A) 3,500 utils.
B) 10,000 utils.
C) 3,104 utils.
D) Utility cannot be determined from the information given.
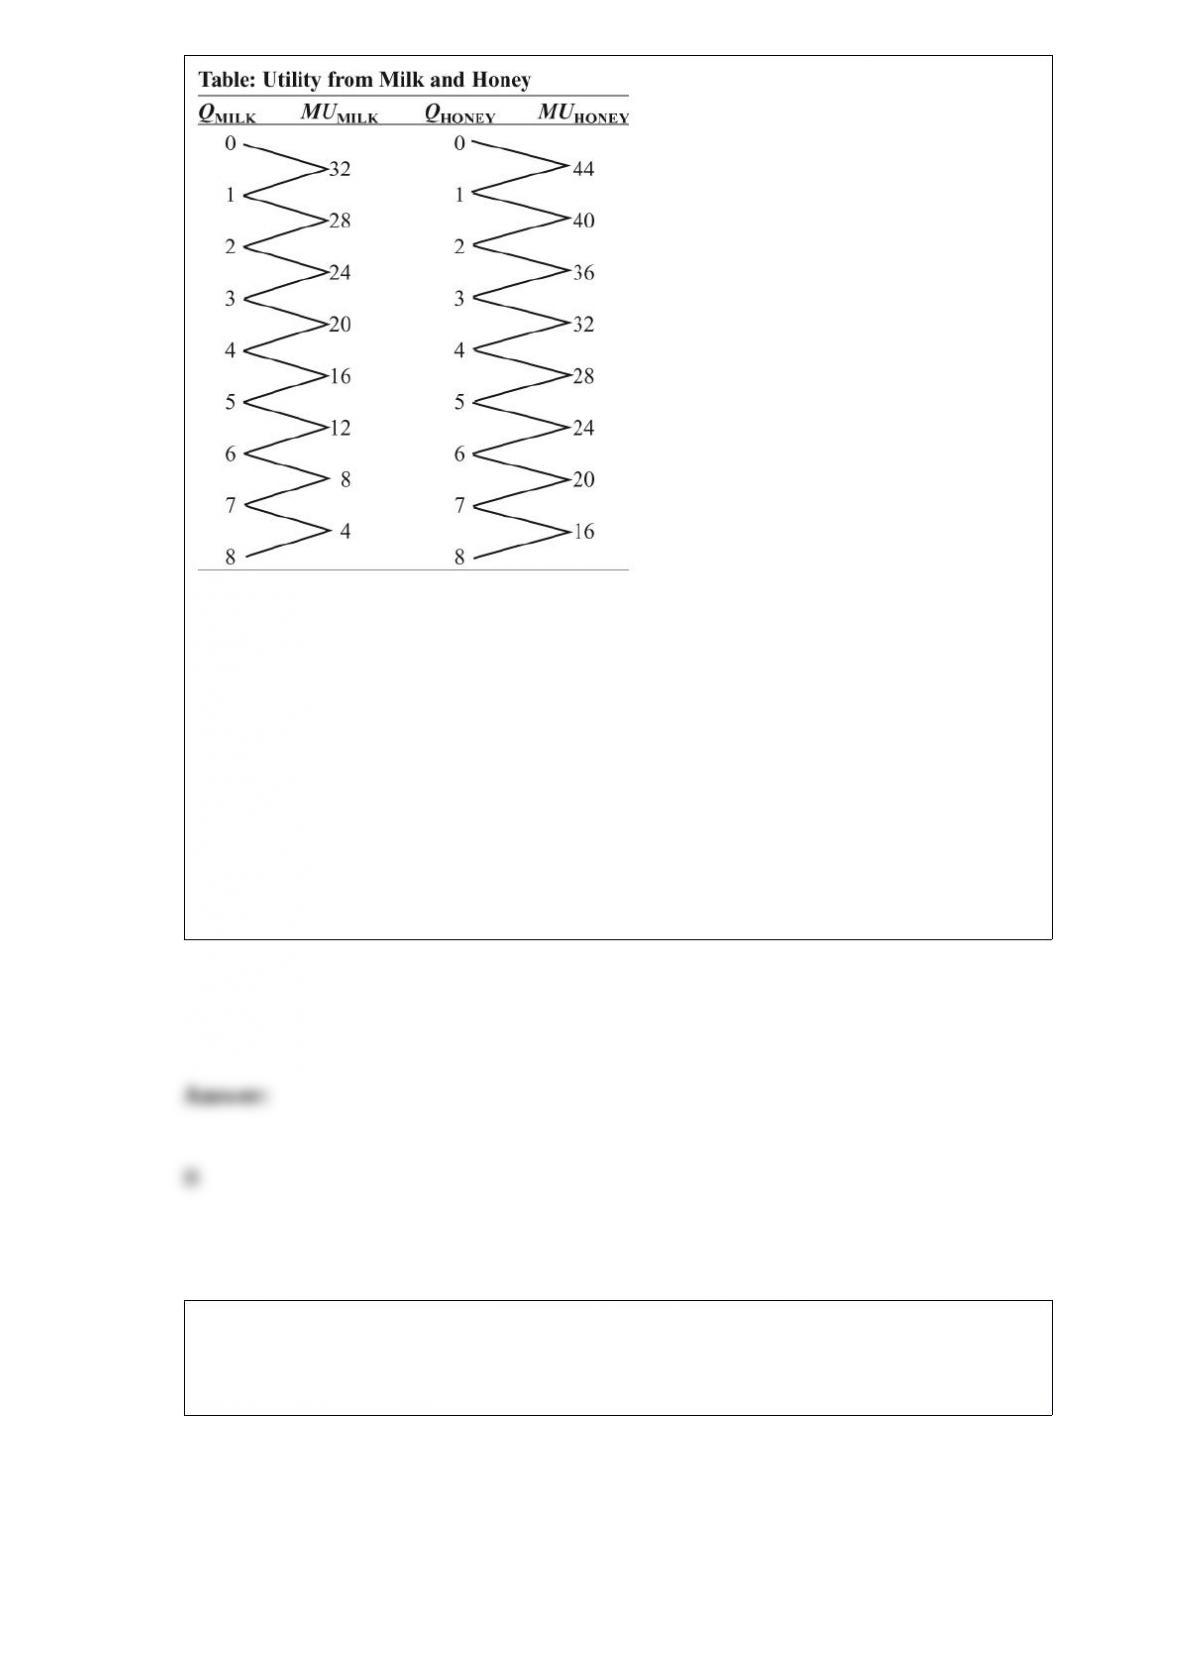
(Table: Utility from Milk and Honey) Look at the table Utility from Milk and Honey.
The price of milk is $2 and the price of honey is $4. If Max’s income is $16, he buys
_____ bottle(s) of milk and _____ jar(s) of honey.
A) 1; 1
B) 4; 2
C) 5; 4
D) 6; no
Figure: Demand and Supply
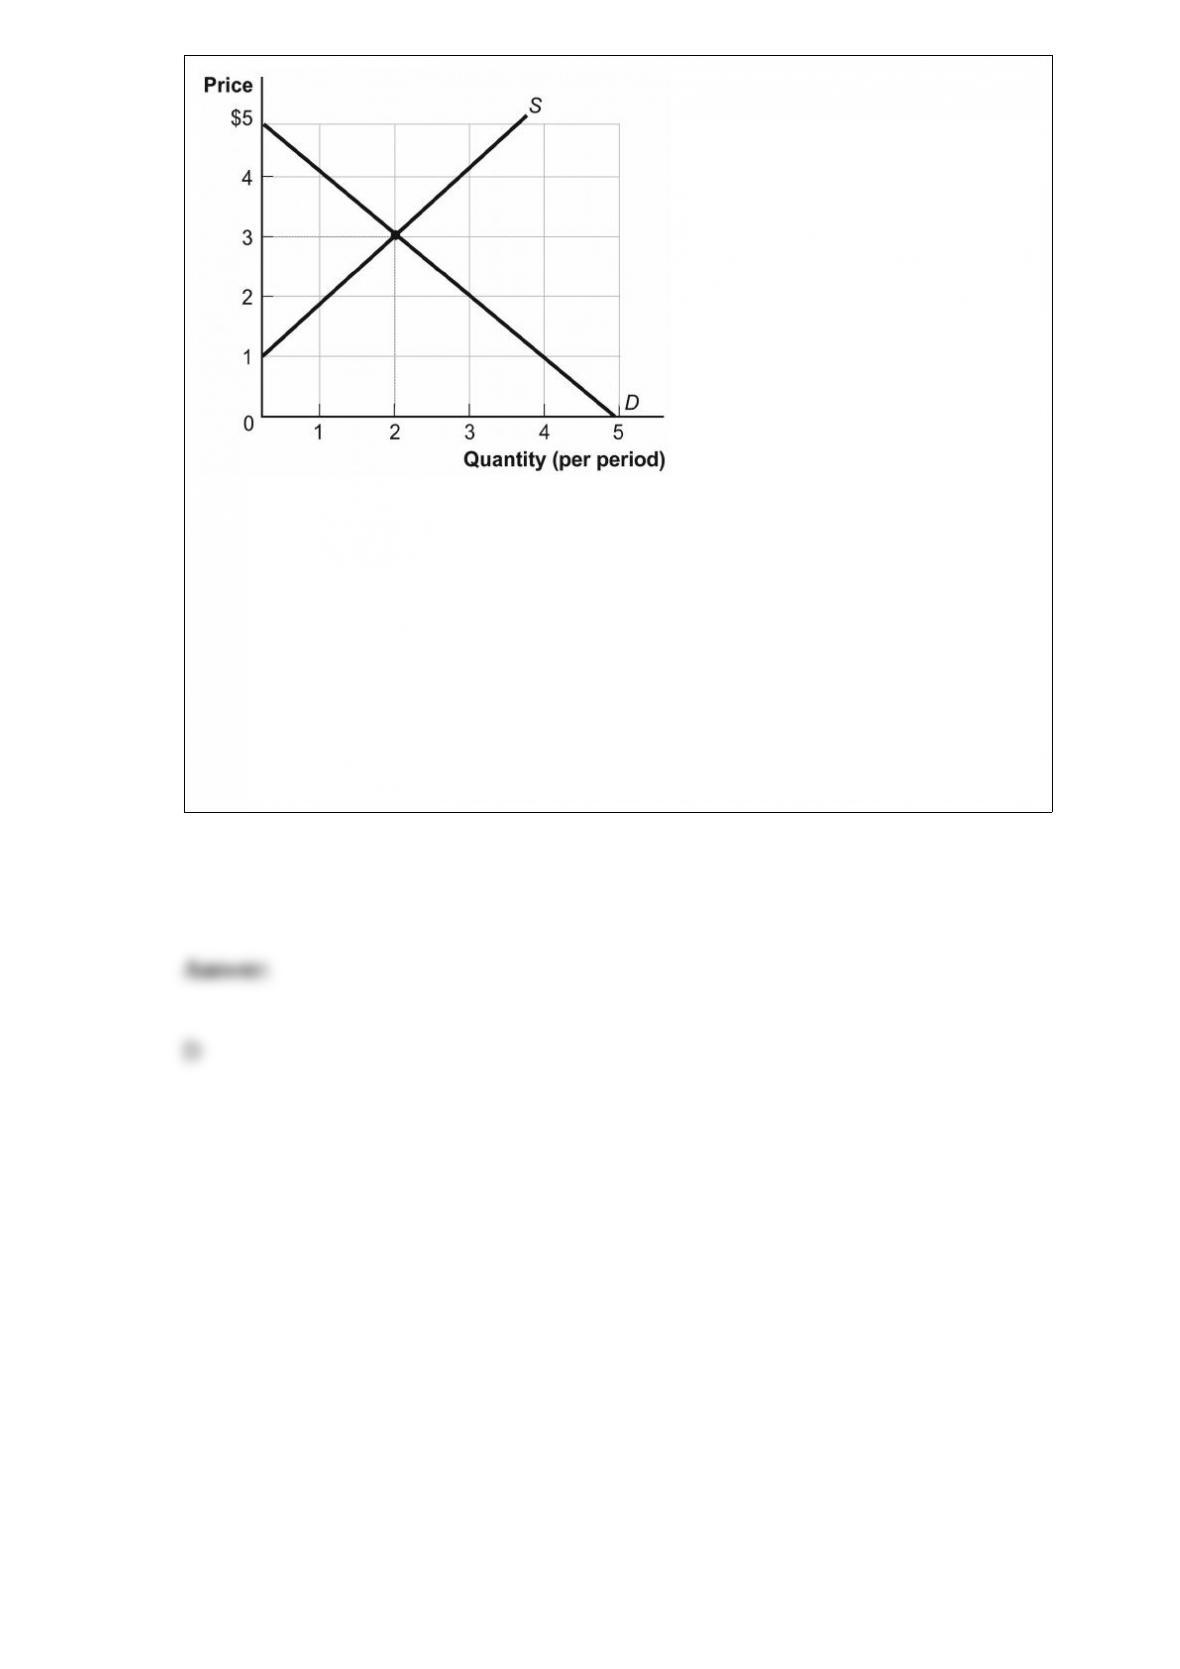
(Figure: Demand and Supply) Look at the figure Demand and Supply. The curve
labeled D indicates that a price of $2 is related to a quantity of:
A) 0.
B) 1.
C) 2.
D) 3.