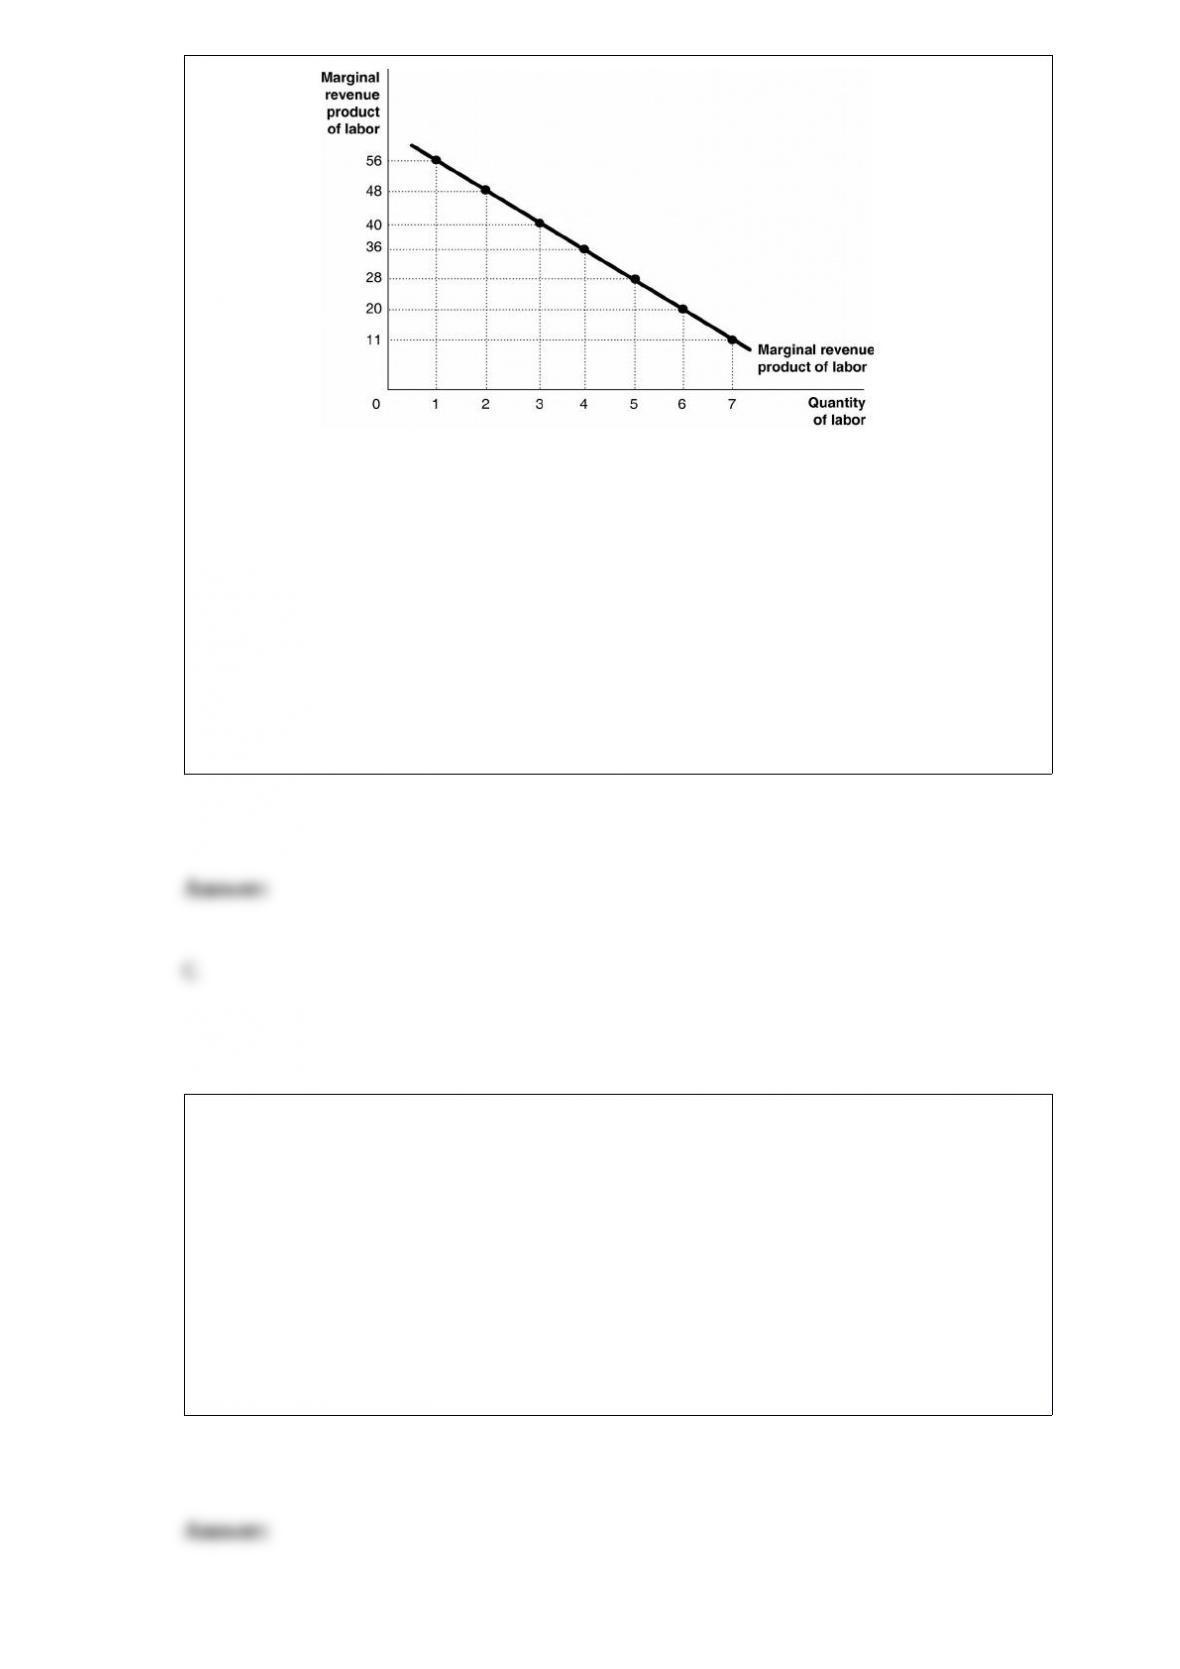
Figure 17-1 Figure 17-1
shows the marginal revenue product for Dale’s Hand-Sewn Doilies, a producer of linen
doilies. If Dale can sell her doilies at $2 each, what is the marginal product of the 5th
worker?
A) $28
B) 28 doilies
C) 14 doilies
D) $56
If, as your taxable income decreases, you pay a larger percentage of your taxable
income in taxes, then the tax is
A) regressive.
B) proportional.
C) progressive.
D) unfair.
Economists are reluctant to state that price controls are desirable or undesirable because
A) it is impossible to evaluate the impact on quantity demanded and quantity supplied
as a result of price controls.
B) whether the gains from the winners exceed the losses from the losers is not strictly
an economic question.
C) sometimes price controls result in increases in economic efficiency and sometimes
they result in decreases in economic efficiency.
D) economists are reluctant to conduct positive analysis of price controls.
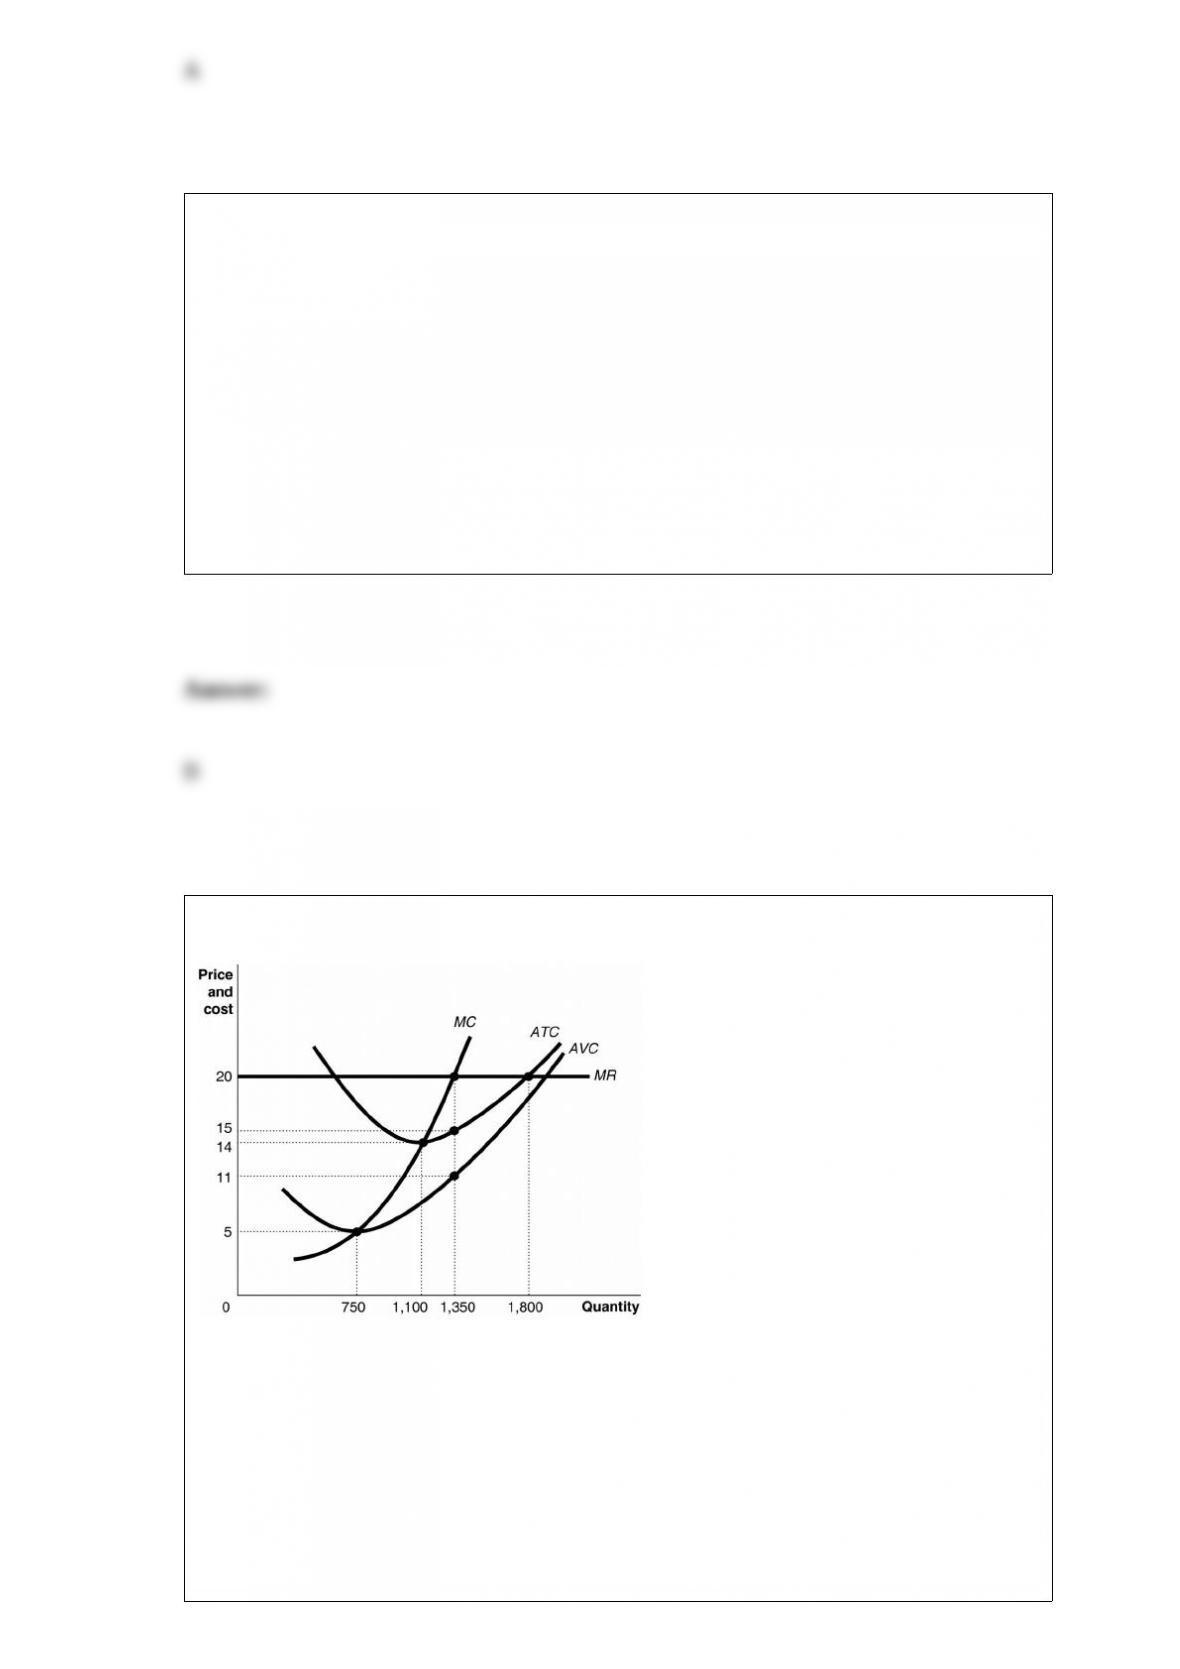
Figure 12-5
Figure 12-5 shows cost and demand
curves facing a typical firm in a constant-cost, perfectly competitive industry. If the
market price is $20, what is the firm’s profit-maximizing output?
A) 750 units
B) 1,100 units
C) 1,350 units

D) 1,800 units
Banks can continue to make loans until their
A) actual reserves equal their required reserves.
B) excess reserves equal their required reserves.
C) actual reserves equal their excess reserves.
D) actual reserves equal their checking account balances.
In 2012, global profits for McDonald’s increased by 6.3 percent when measured in local
currencies, but fell by 0.7 percent when measured in dollars. The reason for this
discrepancy is the value of the
A) euro decreased relative to the British pound.
B) British pound increased relative to the U.S. dollar.
C) U.S. dollar increased relative to most other currencies.
D) U.S. dollar decreased relative to the Japanese yen.
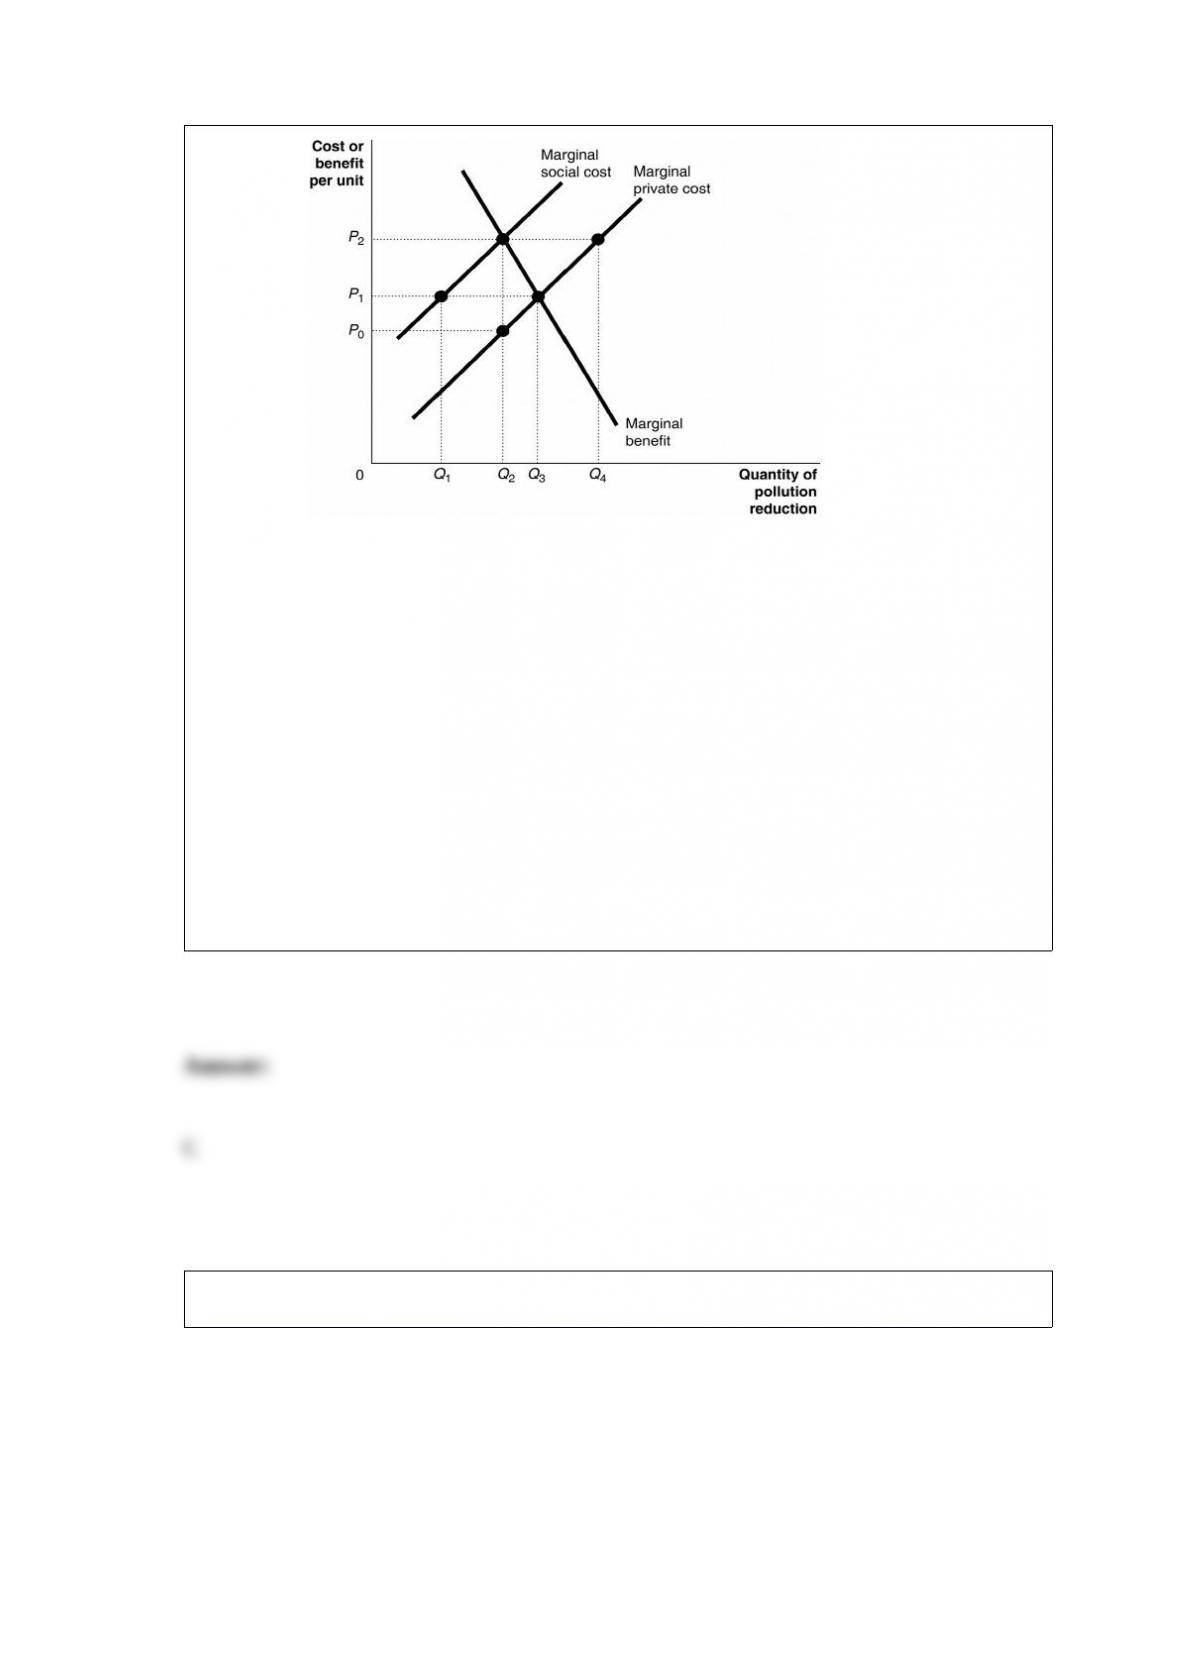
Figure 5-9 Companies producing
toilet paper bleach the paper to make it white. The bleach is discharged into rivers and
lakes and causes substantial environmental damage. Figure 5-9 illustrates the situation
in the toilet paper market.Let’s suppose the government imposes a tax of $50 per ton of
toilet paper to bring about the efficient level of production. What happens to the market
price of toilet paper?
A) It rises by $50.
B) It rises by more than $50.
C) It rises by less than $50.
D) It remains the same because the tax is imposed on producers who create the
externality.
Figure 11-5
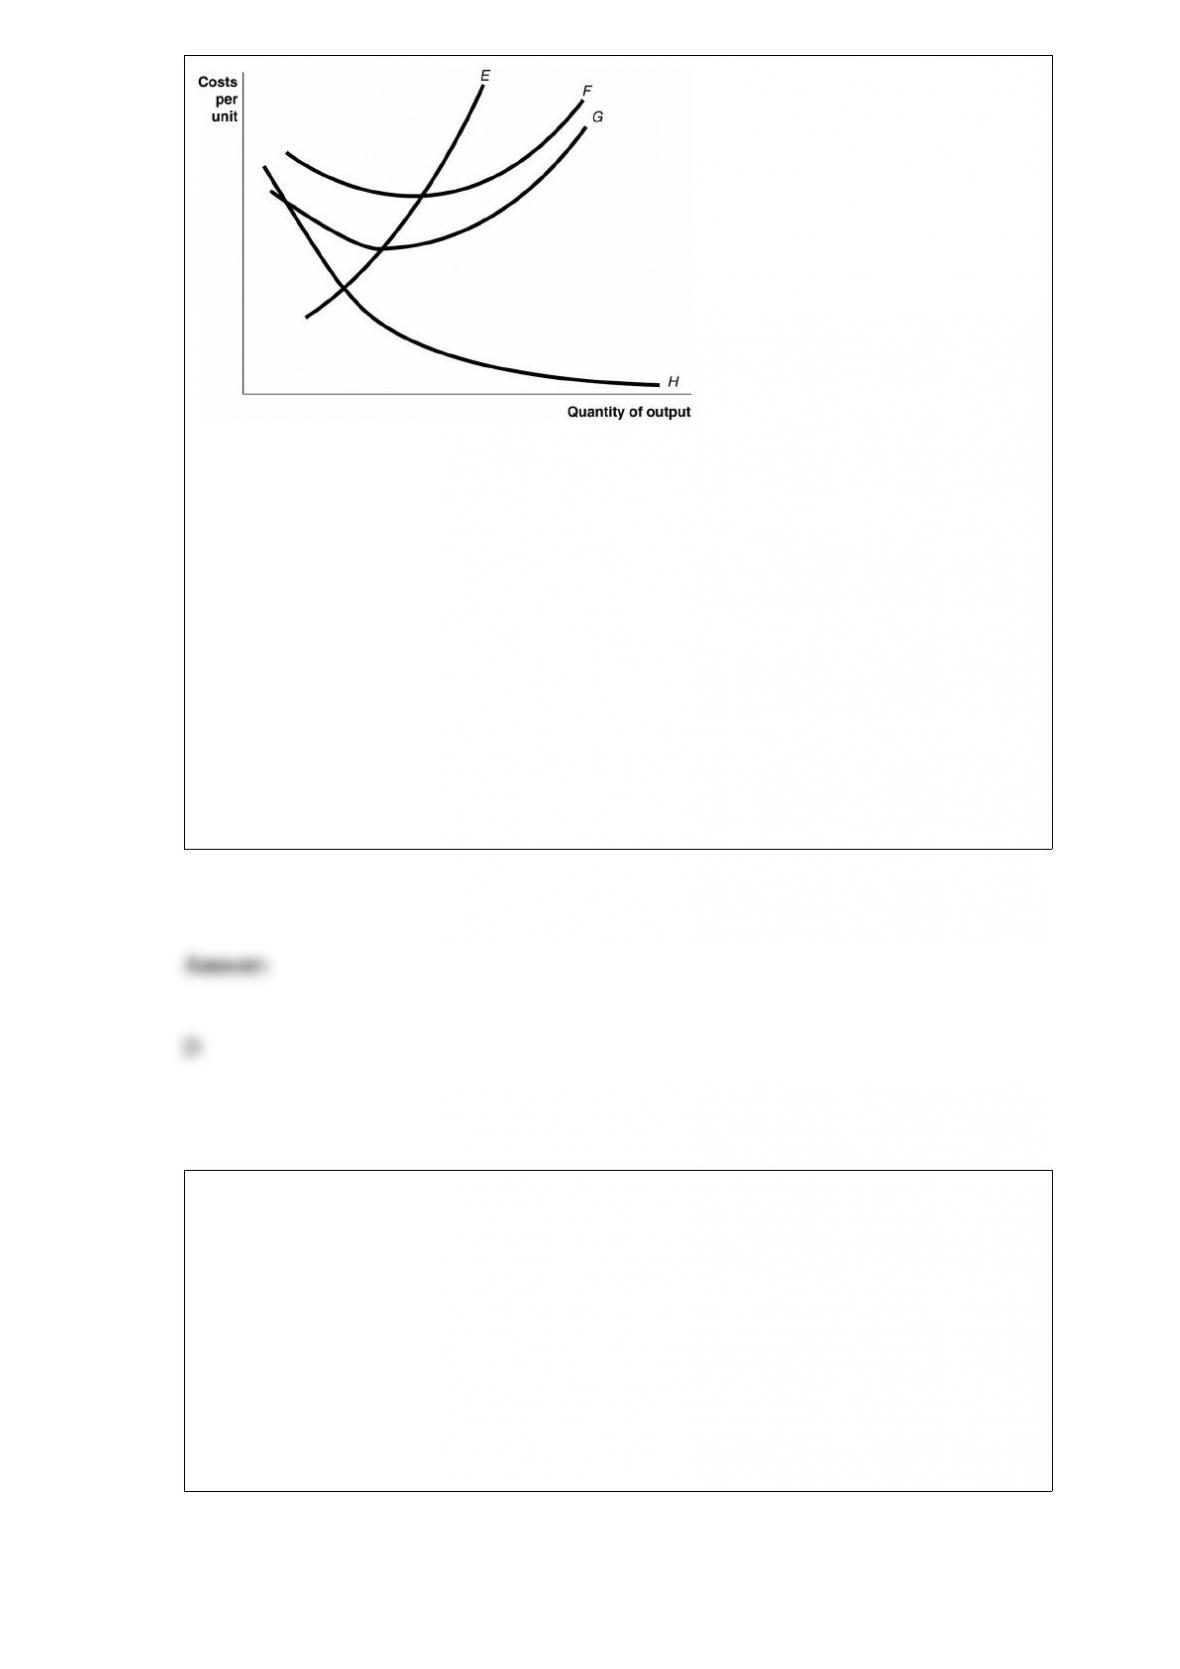
Identify the curves in the diagram.
A) E = average fixed cost curve; F = variable cost curve; G = total cost curve, H =
marginal cost curve
B) E = marginal cost curve; F = total cost curve; G = variable cost curve, H = average
fixed cost curve
C) E = average fixed cost curve; F = average total cost curve; G = average variable cost
curve, H = marginal cost curve
D) E = marginal cost curve; F = average total cost curve; G = average variable cost
curve; H = average fixed cost curve.
According to Porter’s Five Competitive Forces Model, which kinds of products are most
likely to limit the ability of firms in an industry to raise prices?
A) differentiated products that target a small subsegment of the industry
B) substitutable products produced by firms in different industries
C) similar products produced by similar industries in low-cost countries
D) complementary products produced by different firms in the same industry

College students and faculty members have a more elastic demand than the general
public for Apple’s iMac desktop computers. From this we can conclude that
A) Apple will charge college students and faculty members higher prices than it charges
the general public.
B) Apple will charge college students and faculty members lower prices than it charges
the general public.
C) the general public will earn arbitrage profits by buying iMac desktop computers
from Apple and reselling them to college students and faculty members.
D) Apple will earn economic profits from the computers it sells to the general public
but will break even on the computers it sells to college students and faculty members.
Suppose that in 2013, the national income in the United States was $200 billion,
depreciation was $15 billion, personal taxes were $20 billion, and transfer payments
were $10 billion. Gross domestic product in 2013 is
A) $185 billion.
B) $215 billion.
C) $220 billion.
D) $245 billion.
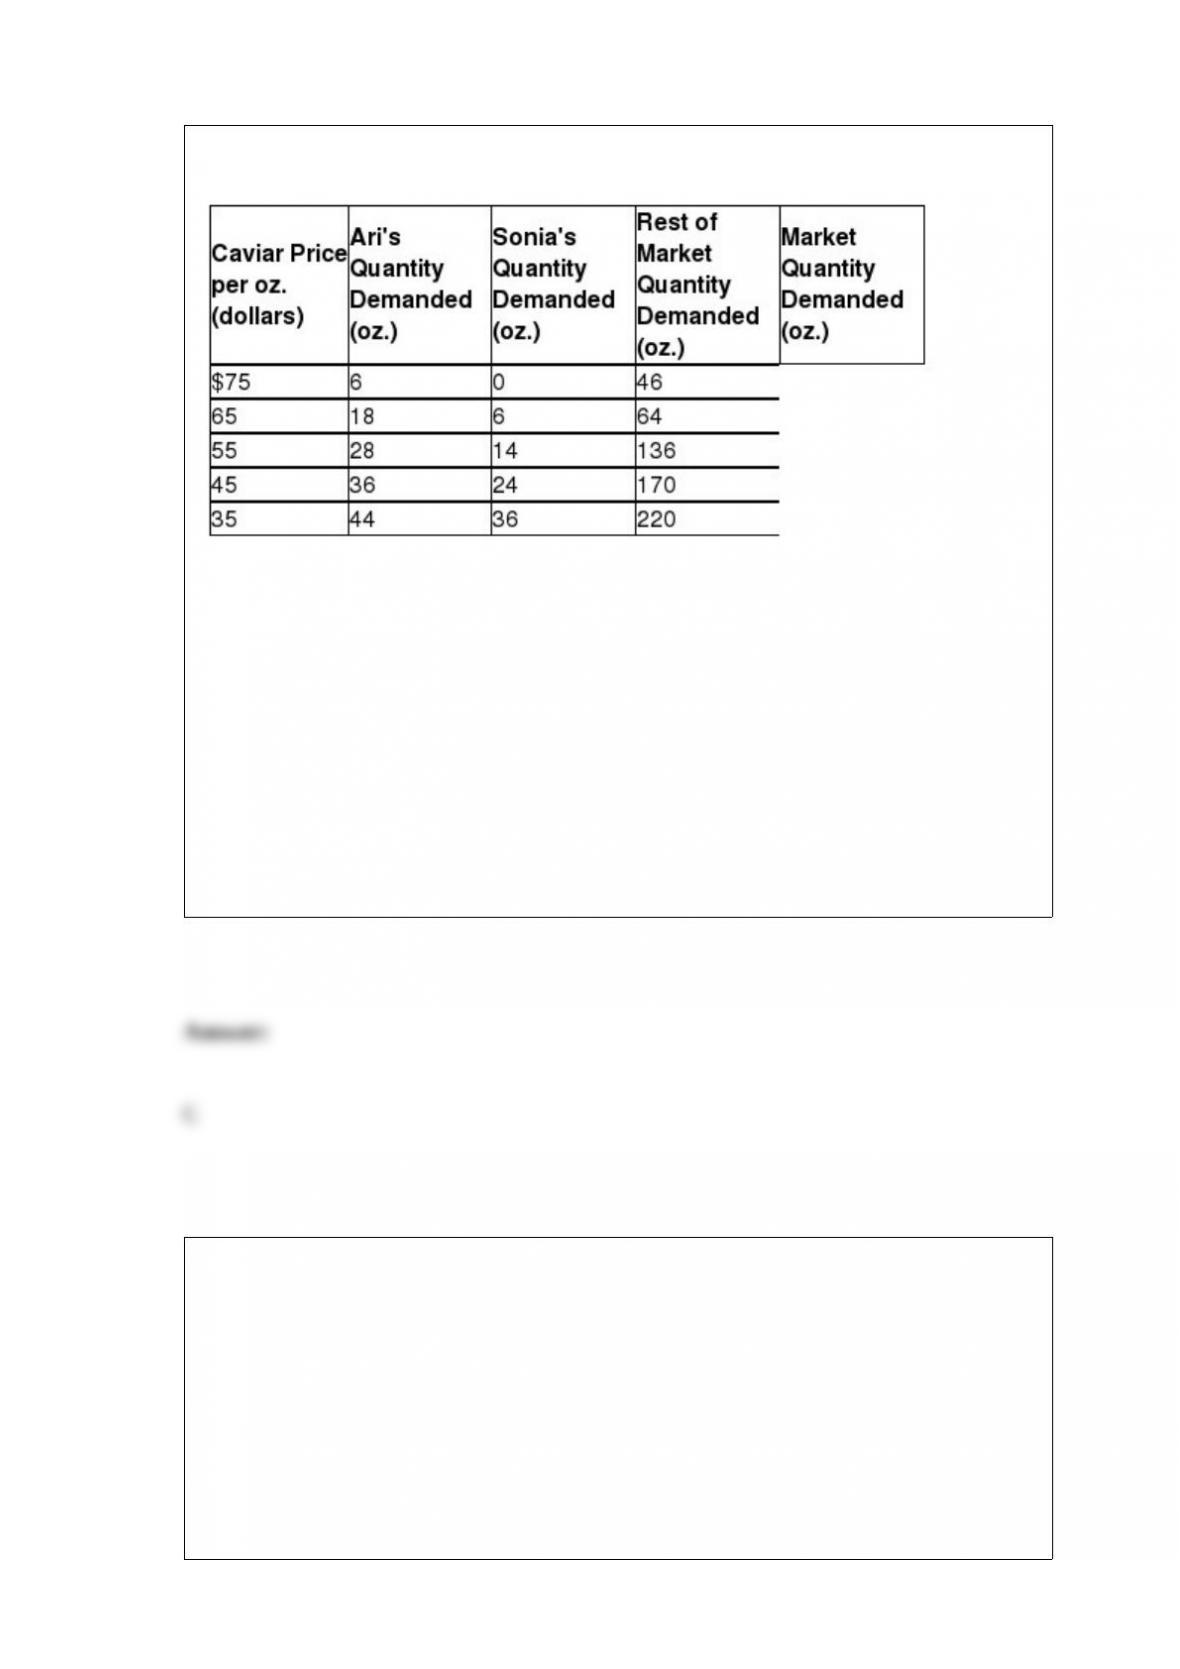
Table 3-2
The table above shows the demand schedules for caviar of two individuals (Ari and
Sonia) and the rest of the market. At a price of $75, the quantity demanded in the
market would be
A) 6 oz.
B) 46 oz.
C) 52 oz.
D) 127 oz.
Which of the following is important in determining the extent of competition in an
industry?
A) the minimum level of short run average total costs of production
B) the minimum efficient scale of production relative to market demand
C) whether or not the industry product is differentiated or standardized
D) the level of market demand for the industry’s product
Since 1948, the labor force participation rate for adult men has ________ and for adult
women has ________.
A) increased; increased
B) increased; decreased
C) decreased; increased
D) decreased; decreased
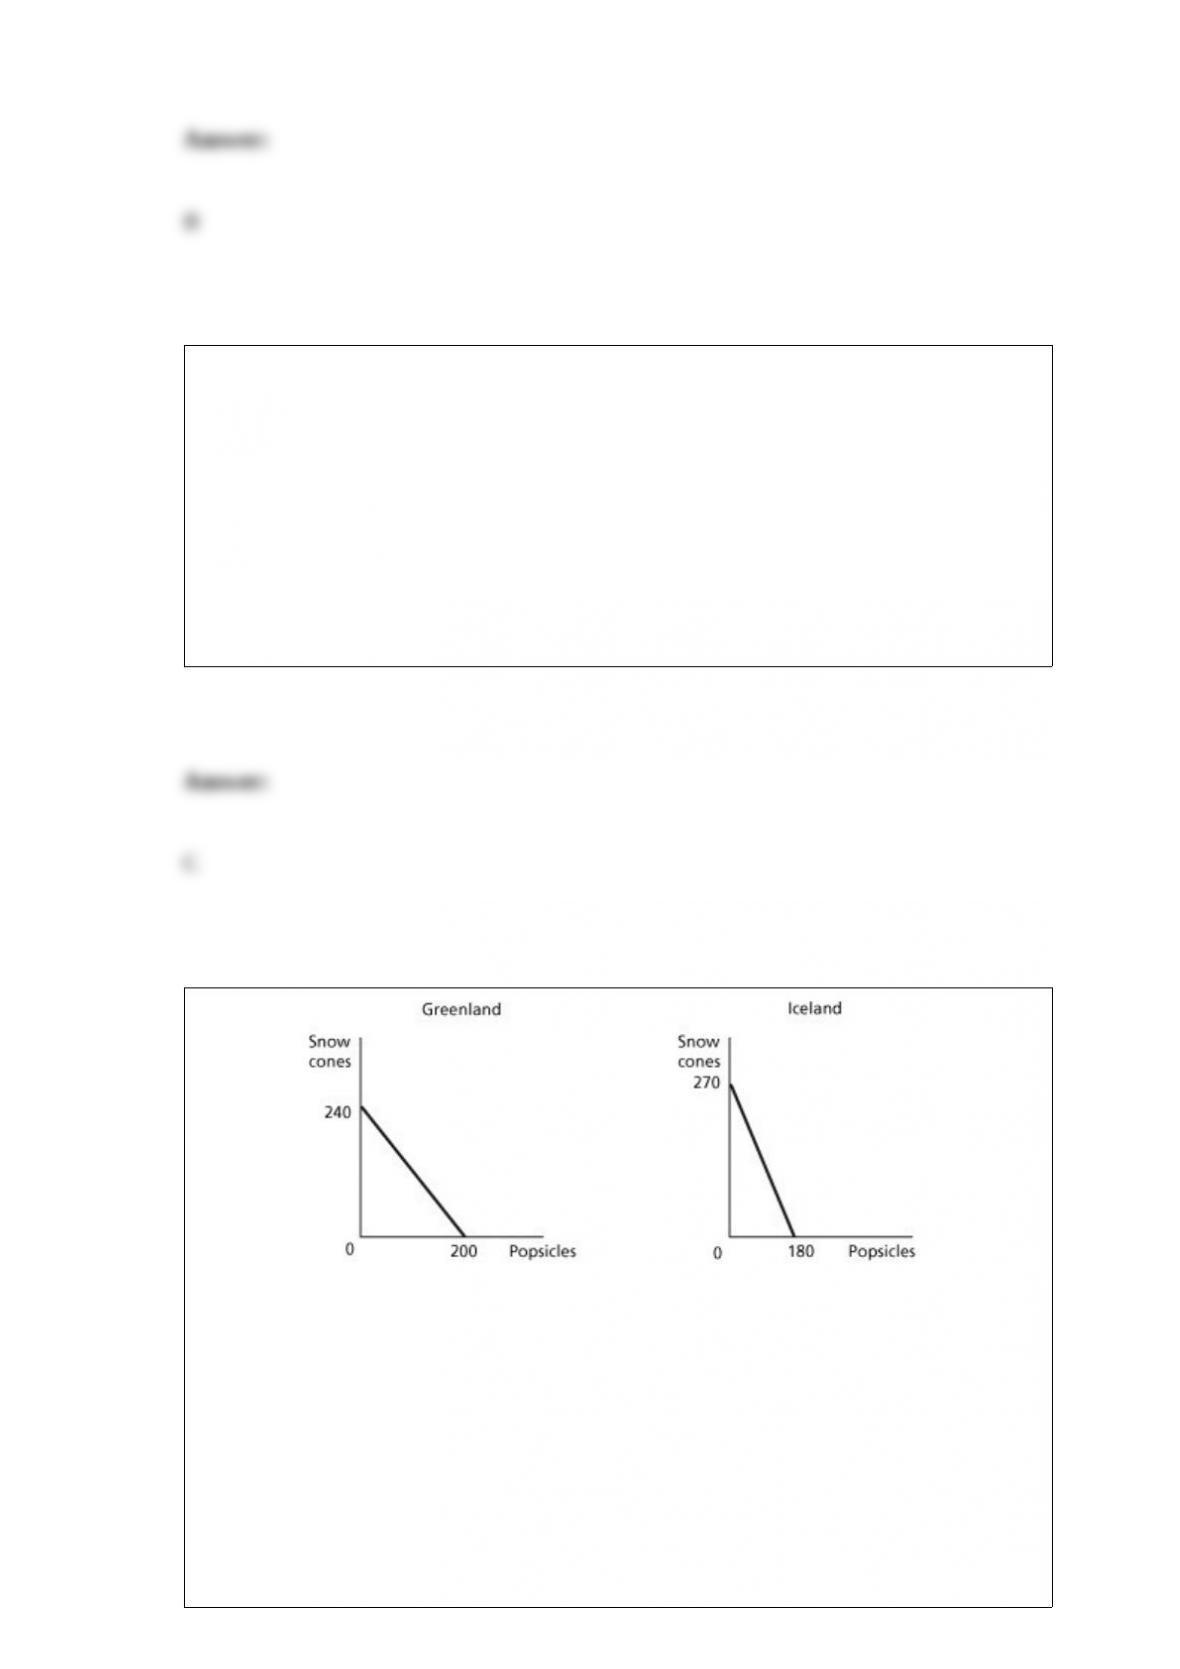
Figure 2-9 Figure 2-9
shows the production possibilities frontiers for Greenland and Iceland. Each country
produces two goods, snow cones and popsicles. What is the opportunity cost of
producing 1 popsicle in Iceland?
A) 1 1/2 snow cones
B) 3/4 of a snow cone
C) 2/3 of a snow cone
D) 270 snow cones