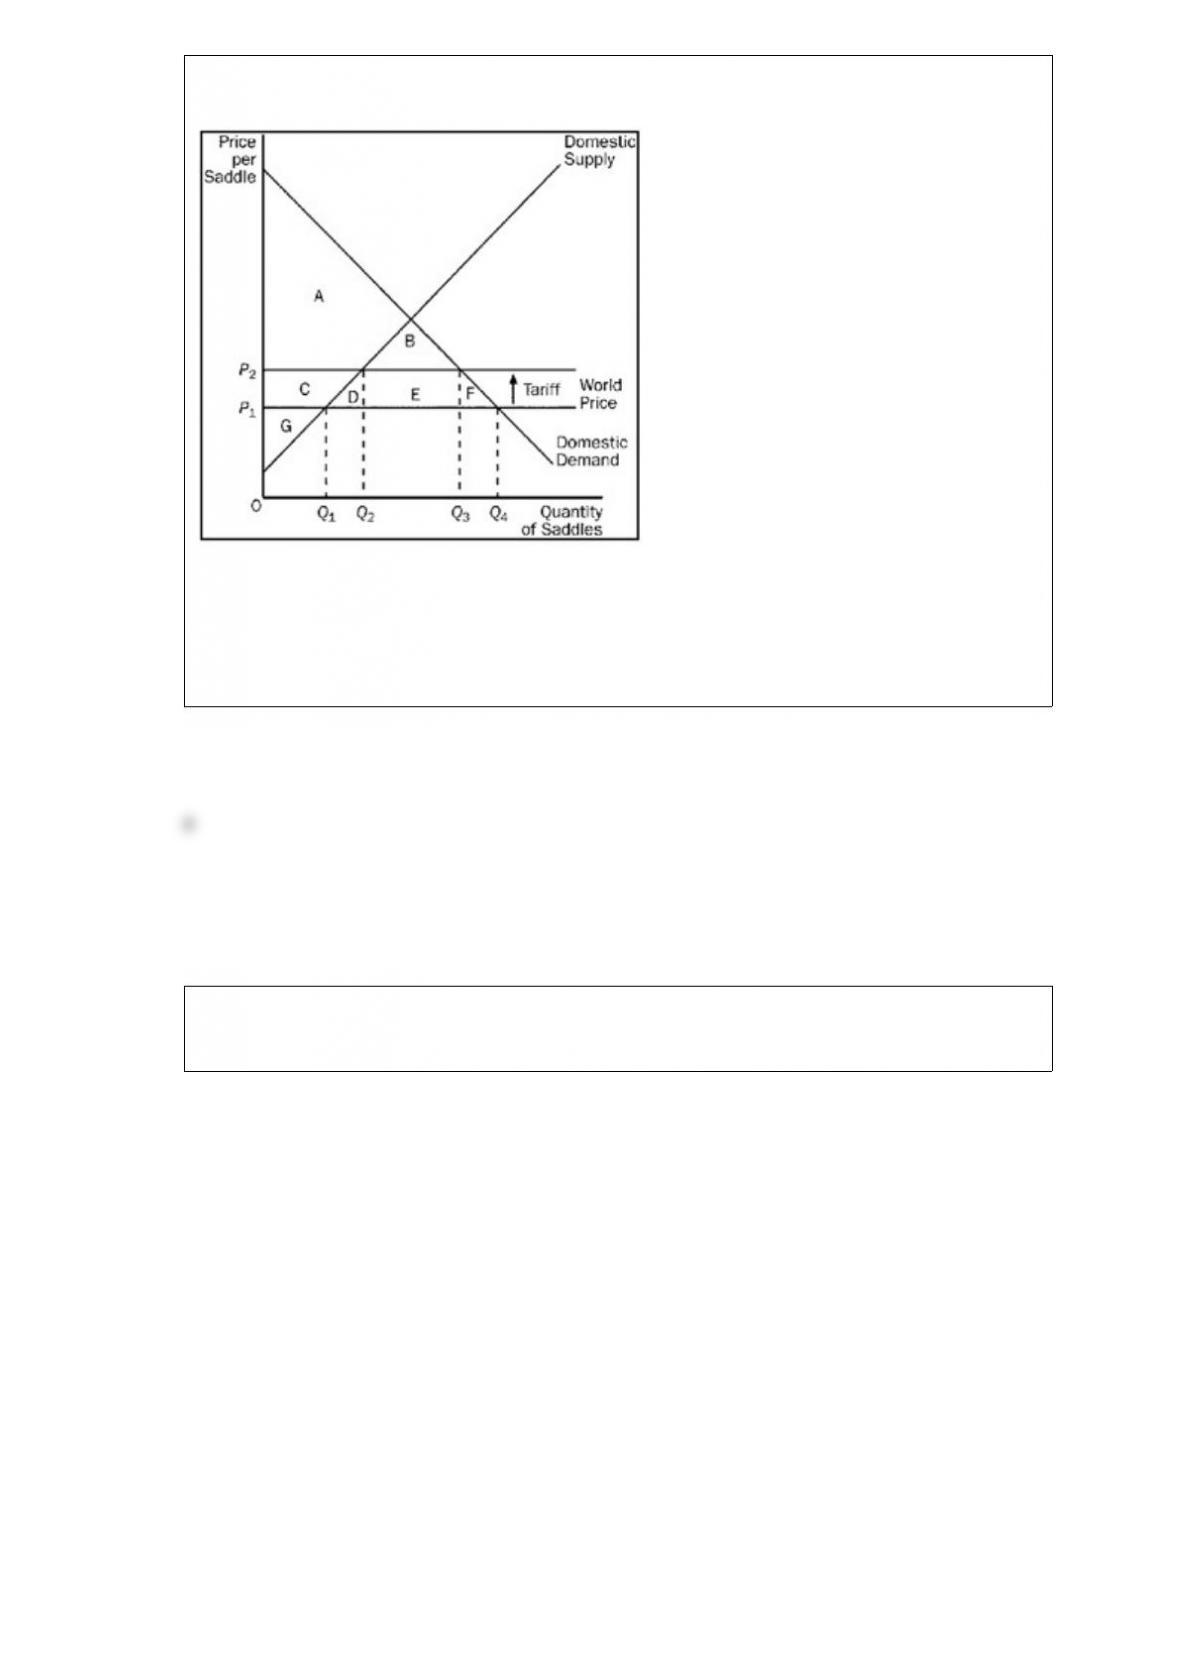
Figure 915
Refer to Figure 915. Producer surplus with trade and without a tariff is
a. G.
b. C + G.
c. A + C + G.
d. A + B + C + G.
Figure 84
The vertical distance between points A and B represents a tax in the market.
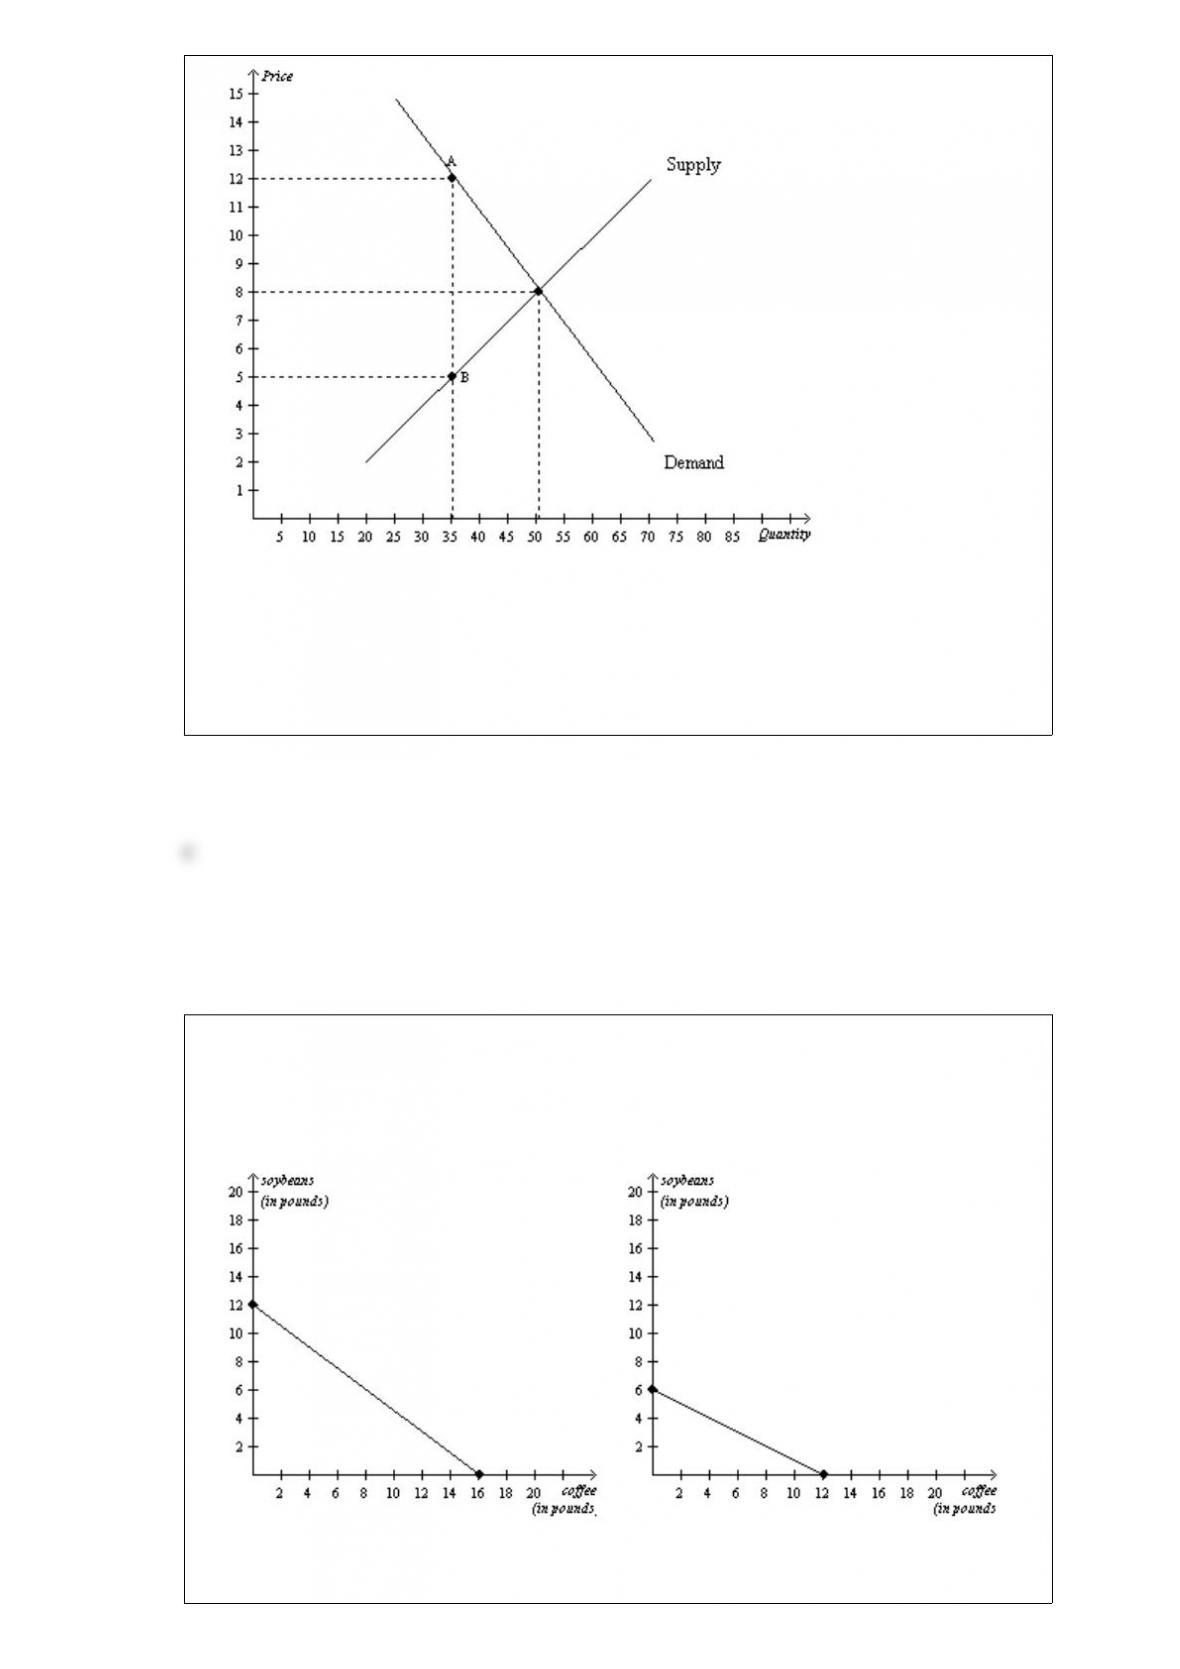
Refer to Figure 84. The tax results in a loss of consumer surplus that amounts to
a. $105.
b. $140.
c. $170.
d. $210.
Figure 319
Chile’s Production Possibilities FrontierColombia’s Production Possibilities
Frontier
Refer to Figure 319. Chile has an absolute advantage in the production of
a. coffee and Colombia has an absolute advantage in the production of soybeans.
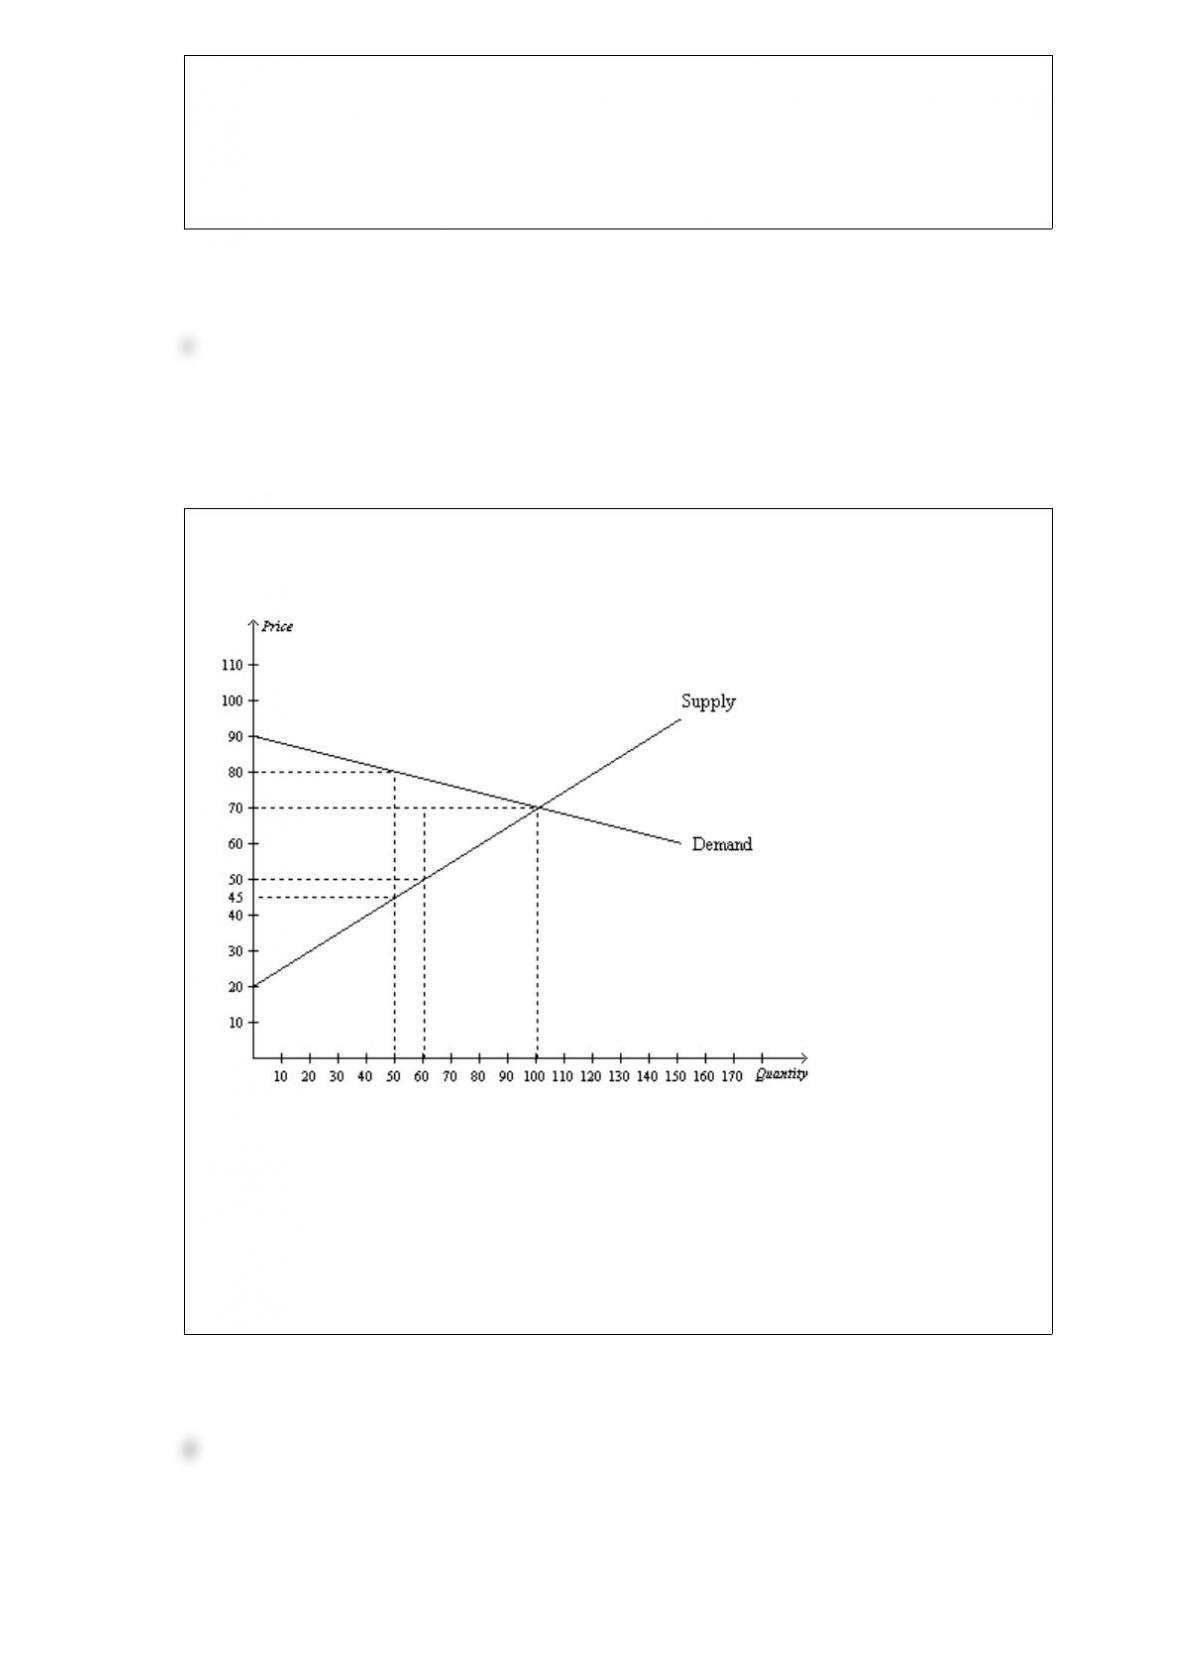
b. soybeans and Colombia has an absolute advantage in the production of coffee.
c. both goods and Colombia has an absolute advantage in the production of neither
good.
d. neither good and Colombia has an absolute advantage in the production of both
goods.
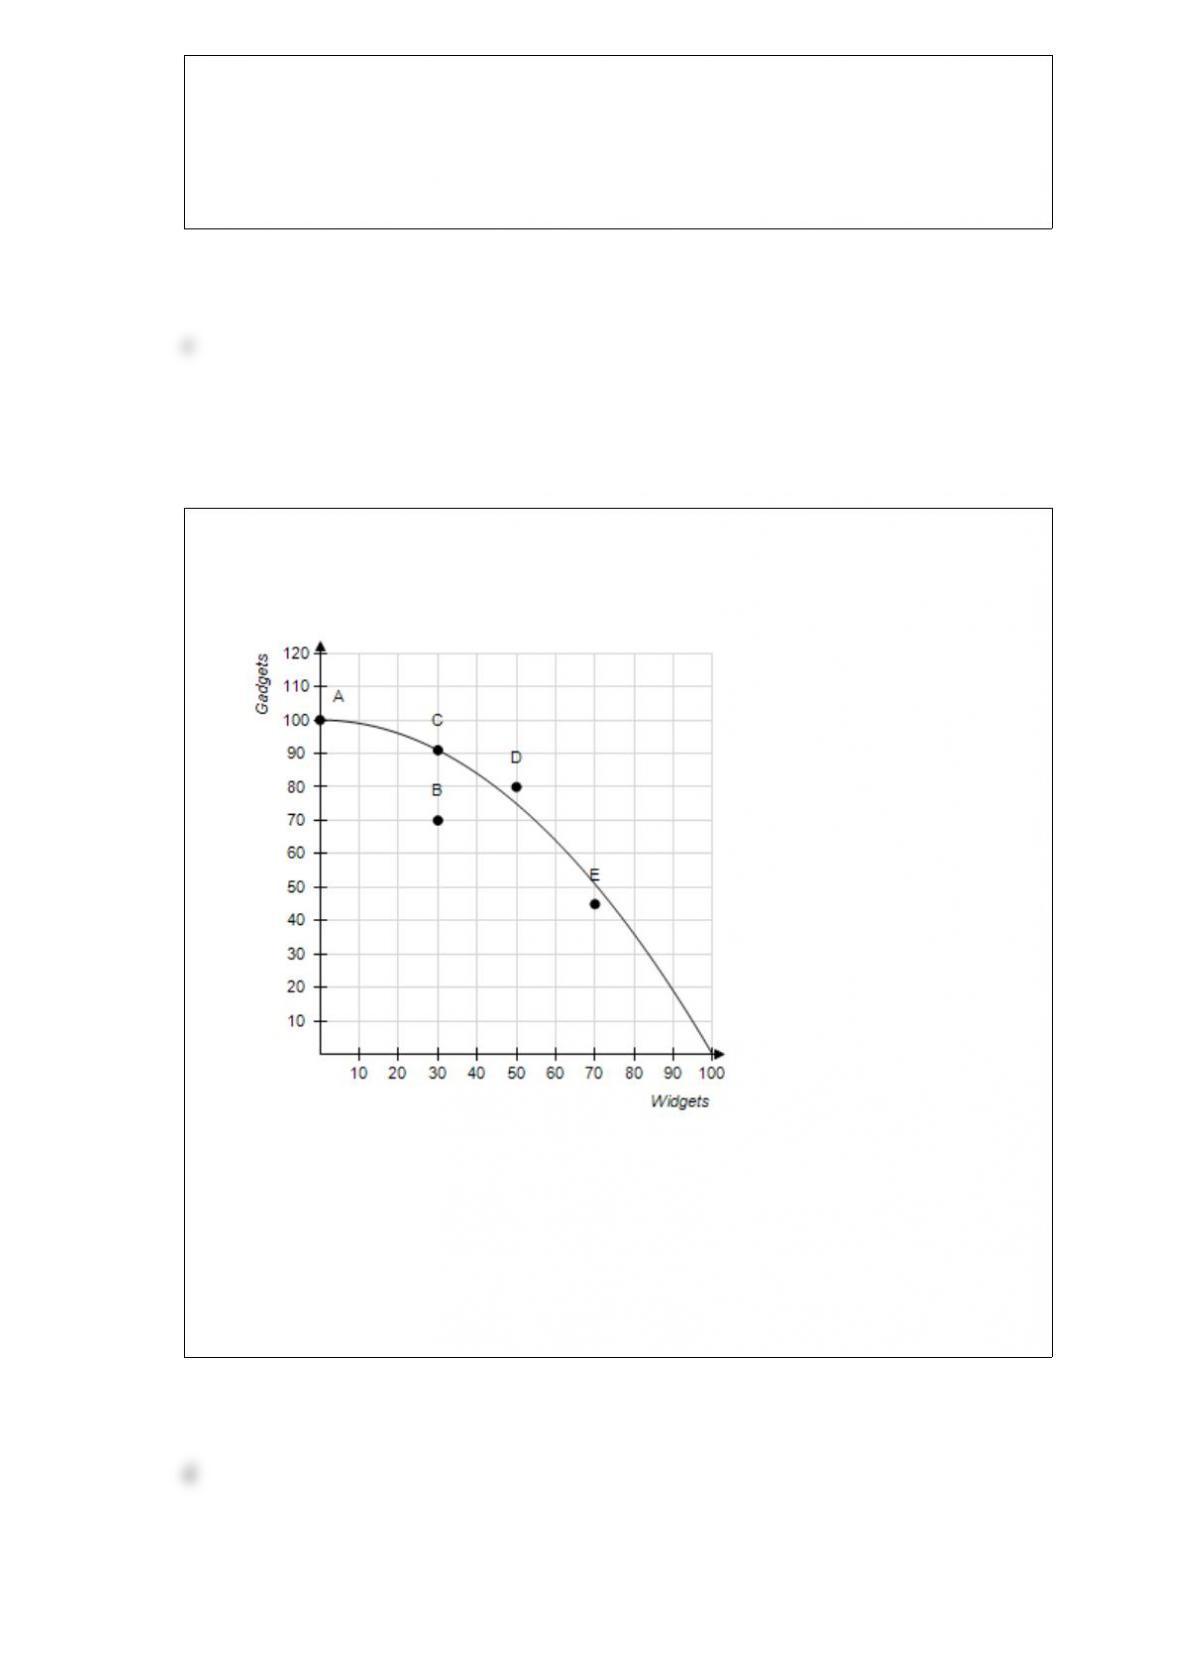
Figure 722
Refer to Figure 722. Assume demand increases, which causes the equilibrium price to
increase from $50 to $70. The increase in producer surplus to producers already in the
market would be
a. $1,600.
b. $600.
c. $800.
d. $1,200.

Equilibrium quantity must increase when demand
a. increases and supply does not change, when demand does not change and supply
increases, and when both demand and supply increase.
b. increases and supply does not change, when demand does not change and supply
increases, and when both demand and supply decrease.
c. decreases and supply does not change, when demand does not change and supply
decreases, and when both demand and supply increase.
d. decreases and supply does not change, when demand does not change and supply
decreases, and when both demand and supply decrease.
A market demand curve shows how the total quantity demanded of a good varies as
a. income varies.
b. price varies.
c. price of the nearest substitute good varies.
d. supply varies.
A market supply curve is determined by
a. vertically summing individual supply curves.
b. horizontally summing individual supply curves.
c. finding the average quantity supplied by sellers at each possible price.
d. finding the average price at which sellers are willing and able to sell a particular
quantity of the good.
If the government wants to reduce smoking, it should impose a tax on
a. buyers of cigarettes.
b. sellers of cigarettes.
c. either buyers or sellers of cigarettes.
d. whichever side of the market is less elastic.
Figure 216
Refer to Figure 216. The opportunity cost of obtaining 20 additional widgets by
moving from point C to point D is
a. 0 gadgets.
b. 10 gadgets.
c. 20 gadgets.
d. none of the above; the economy cannot move from point C to point D.
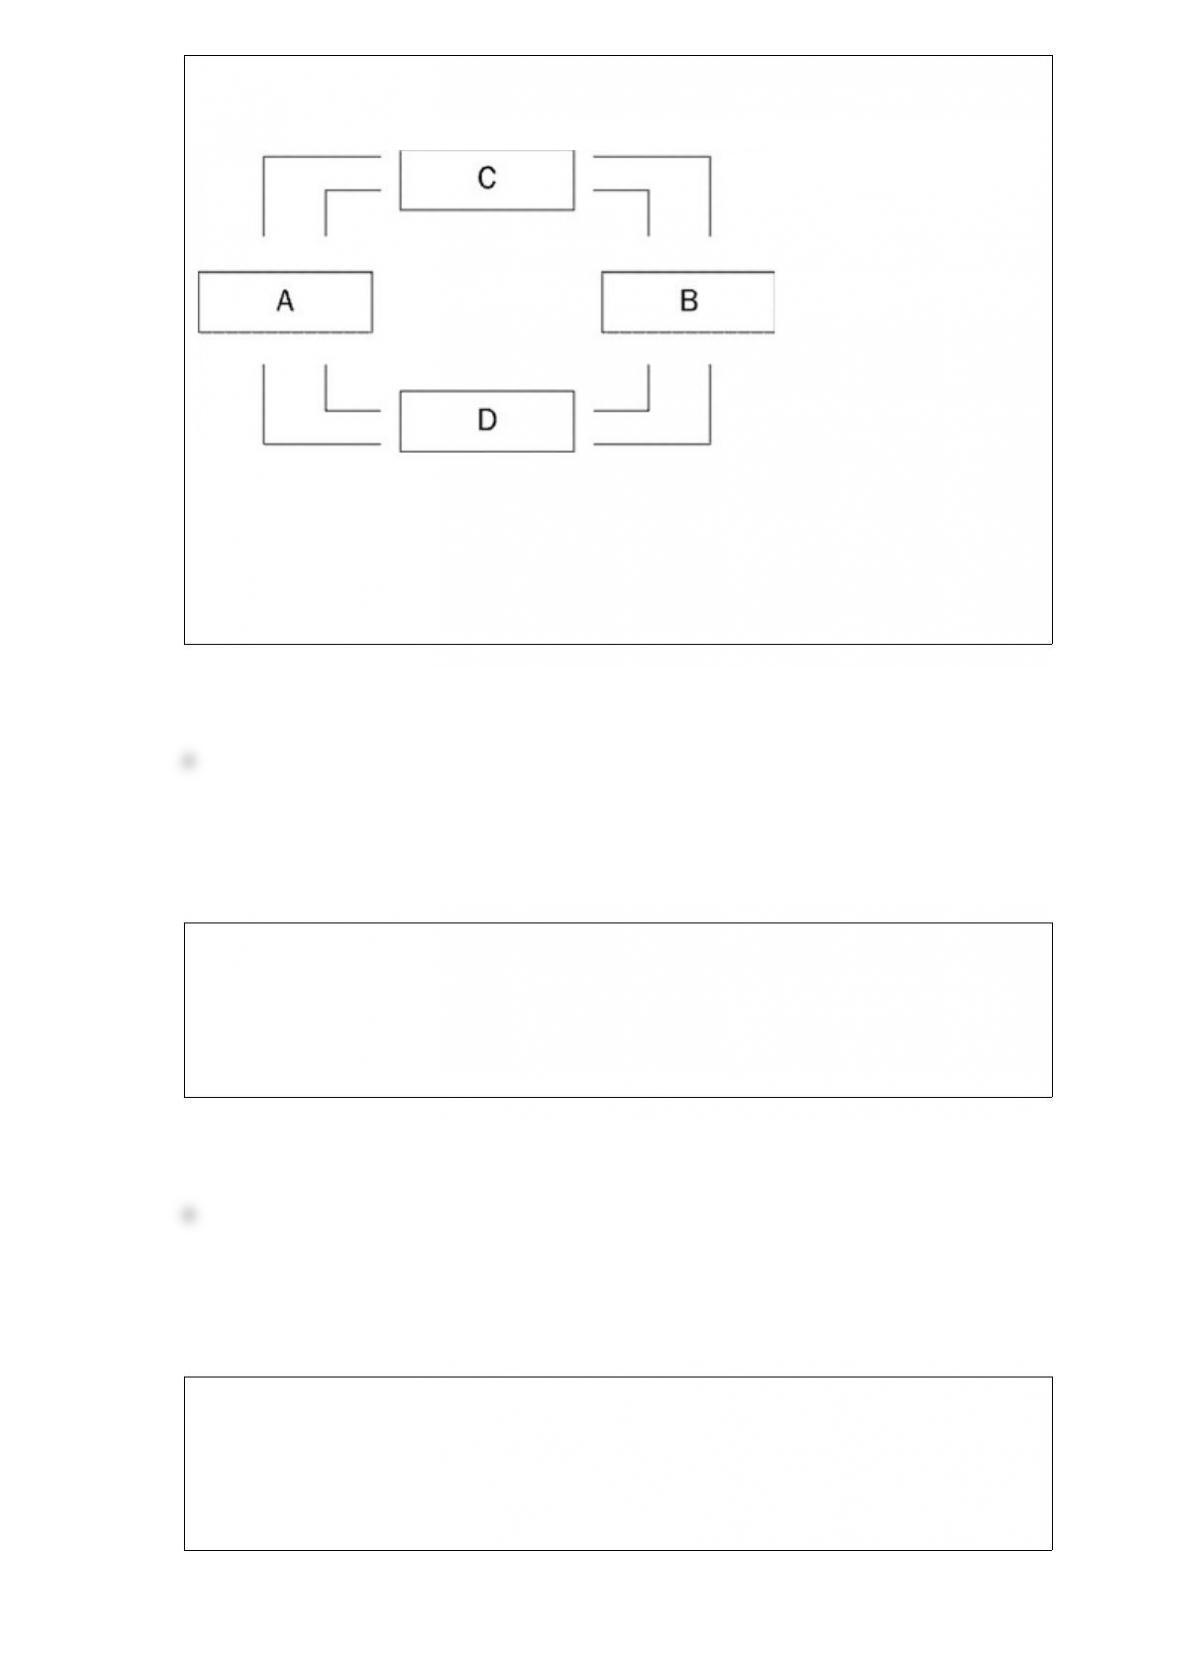
Figure 22
Refer to Figure 22. If Box A of this circularflow diagram represents firms, then which
box represents households?
a. Box B
b. Box C
c. Box D
d. Any one of the other boxes (B, C, or D) could represent households.
As the size of a tax rises, the deadweight loss
a. rises, and tax revenue first rises, then falls.
b. rises as does tax revenue.
c. falls, and tax revenue first rises, then falls.
d. falls as does tax revenue.
When government imposes a price ceiling or a price floor on a market,
a. price no longer serves as a rationing device.
b. efficiency in the market is enhanced.
c. shortages and surpluses are eliminated.
d. both buyers and sellers become better off.
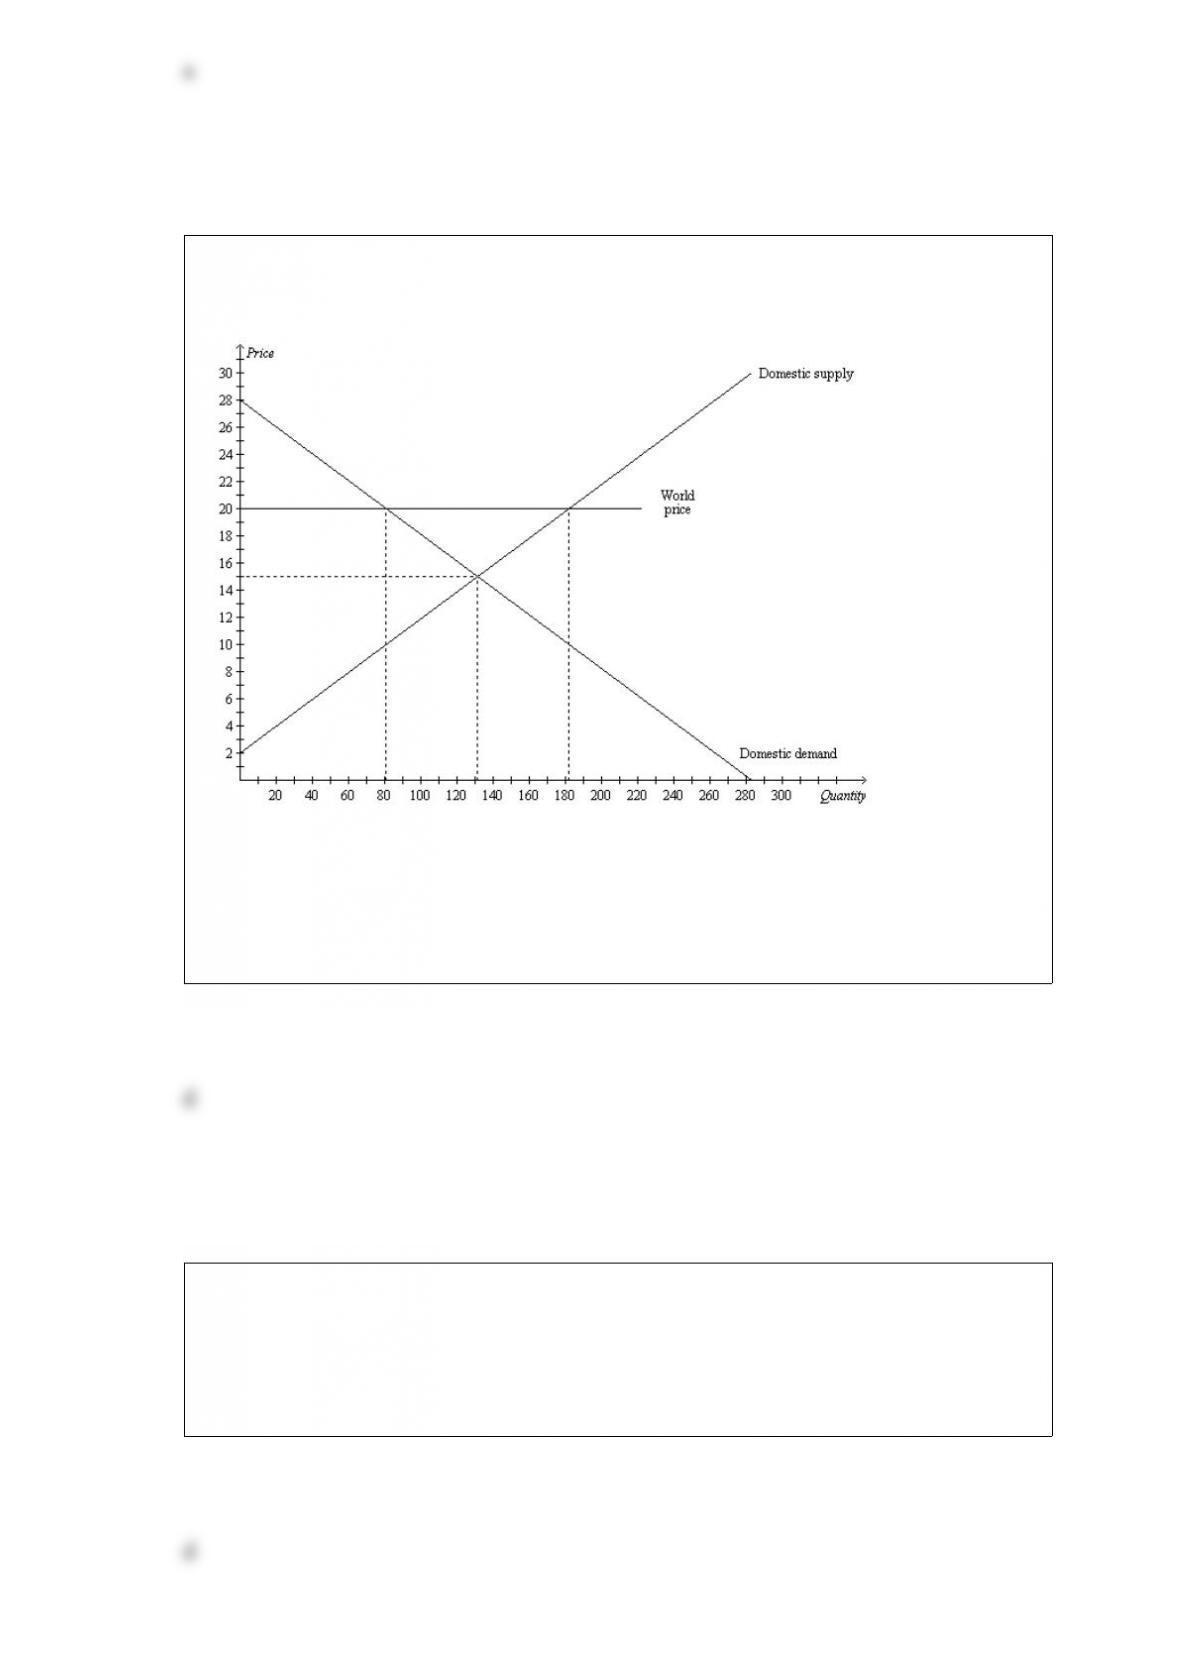
Figure 92
The figure illustrates the market for calculators in a country.
Refer to Figure 92. With free trade, this country will
a. import 50 calculators.
b. import 100 calculators.
c. export 50 calculators.
d. export 100 calculators.
In the circularflow diagram, which of the following is not a factor of production?
a. labor
b. land
c. capital
d. money
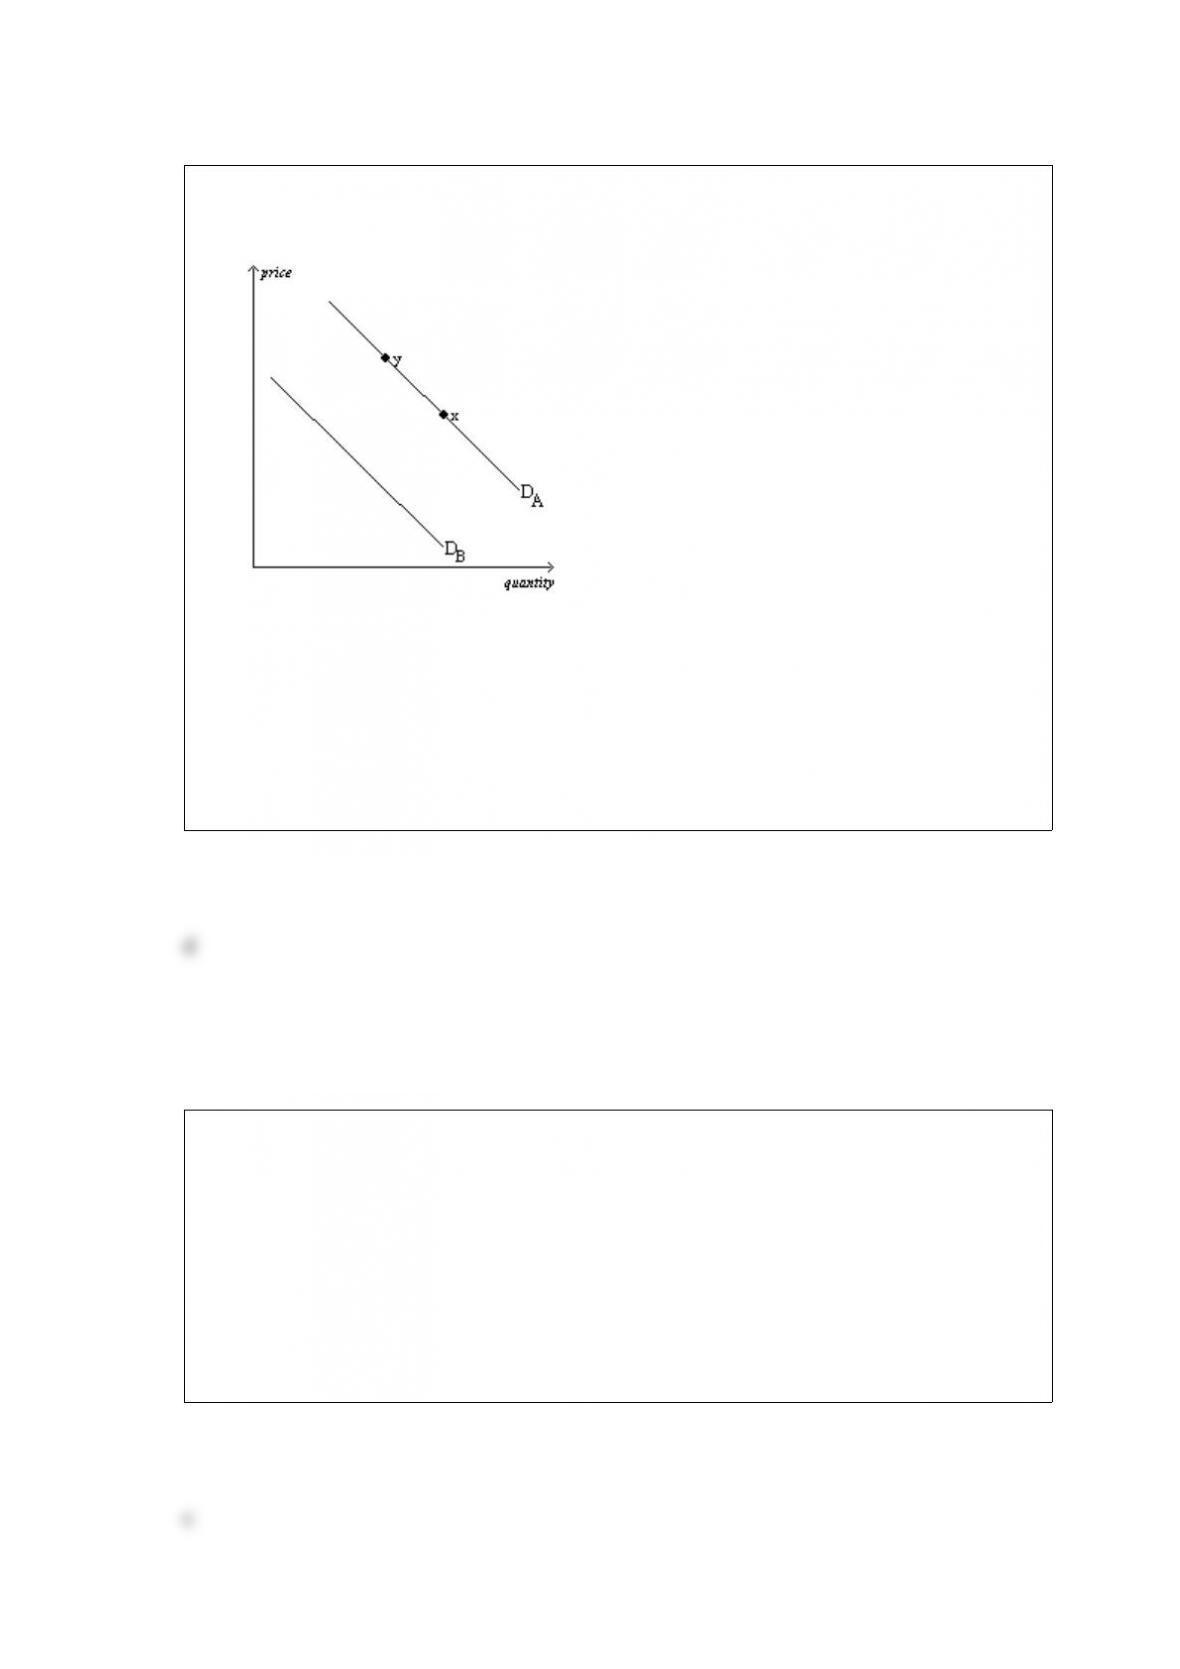
Figure 424
The diagram below pertains to the demand for turkey in the United States.
Refer to Figure 424. All else equal, a decrease in the price of the grain fed to turkeys
would cause a move from
a. DA to DB.
b. DB to DA.
c. x to y.
d. y to x.
Efficiency
a. and equality both refer to how much a society can produce with its resources.
b. and equality both refer to how fairly the benefits from using resources are distributed
between members of a society.
c. refers to how much a society can produce with its resources. Equality refers to how
evenly the benefits from using resources are distributed among members of society.
d. refers to how evenly the benefits from using resources are distributed between
members of society. Equality refers to how much a society can produce with its
resources

A movement along the demand curve might be caused by a change in
a. income.
b. the prices of substitutes or complements.
c. expectations about future prices.
d. the price of the good or service that is being demanded.
Table 713
The only four producers in a market have the following costs:
SellerCost
Abbey$30
Bev$40
Carl$55
Dale$65
Refer to Table 713. If the sellers bid against each other for the right to sell the good to
a single consumer, then the producer surplus will be
a. $0 or slightly more.
b. $5 or slightly less.
c. $10 or slightly less.
d. $25 or slightly less.
Figure 74
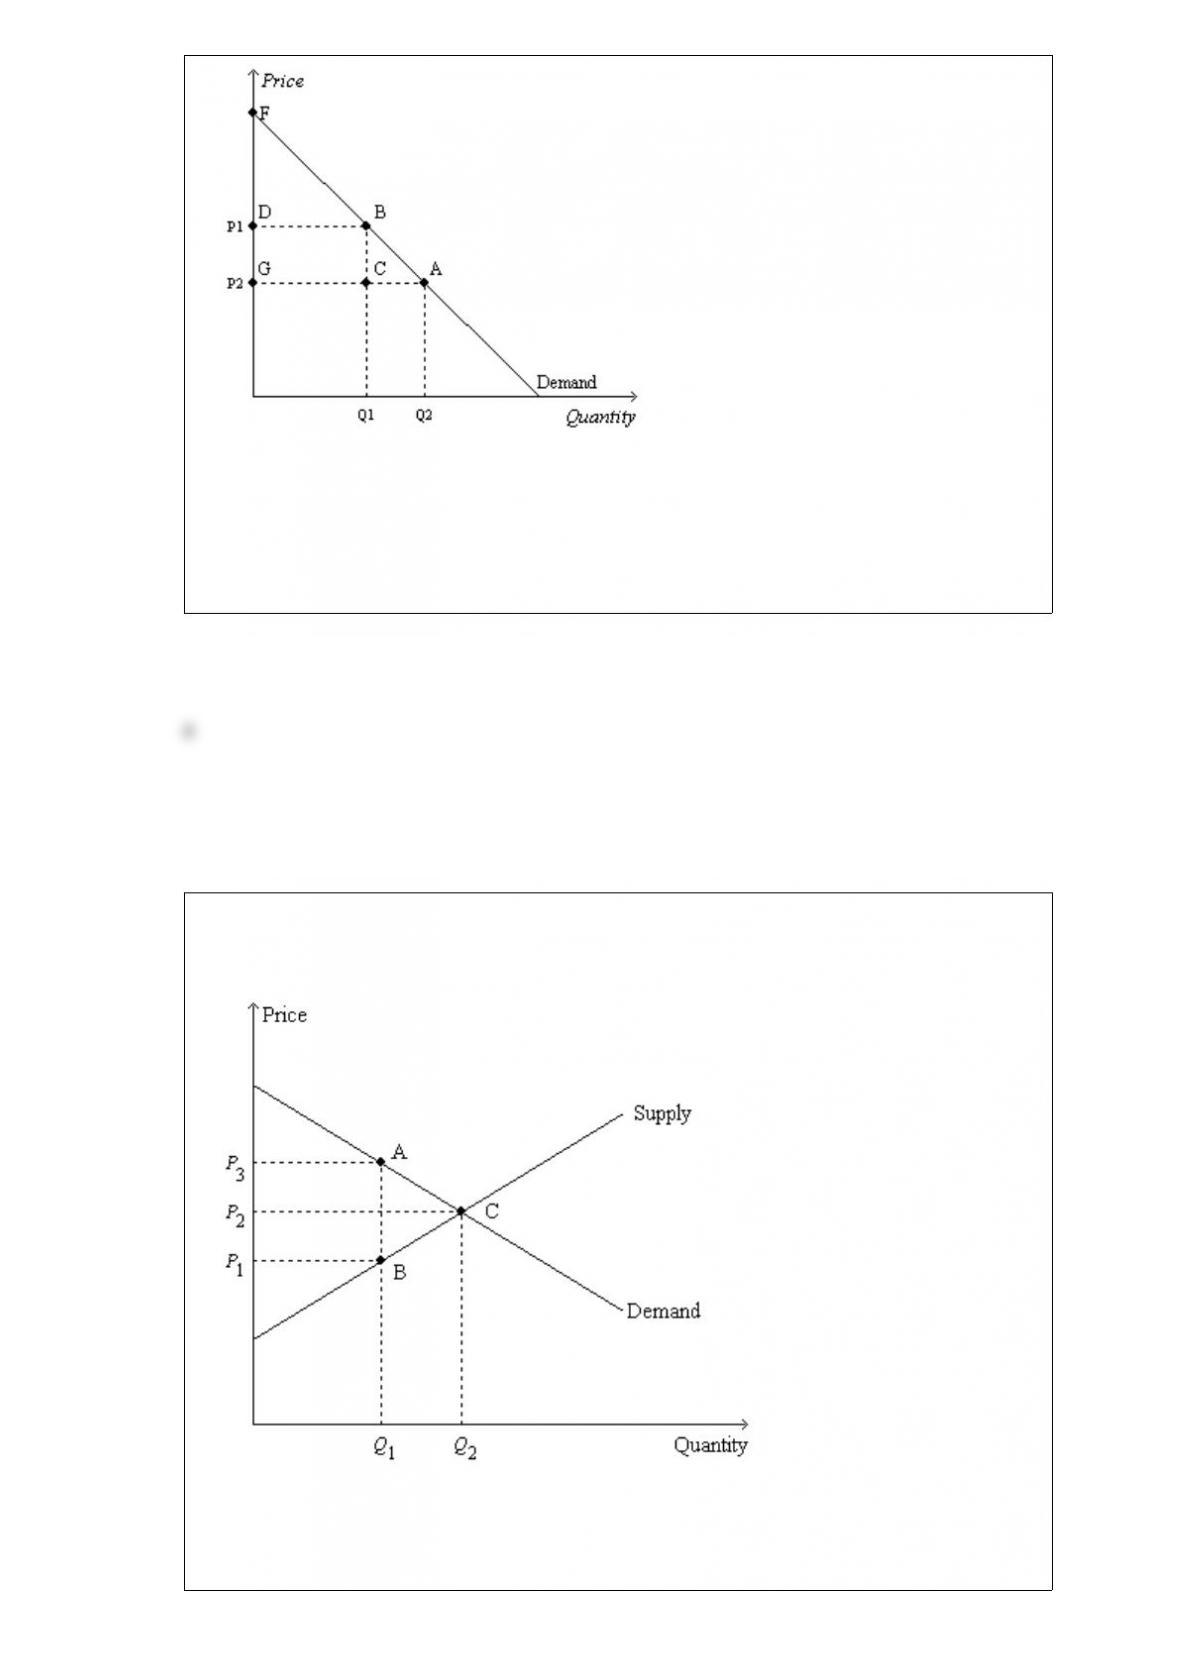
Refer to Figure 74. Which area represents consumer surplus at a price of P1?
a. BDF
b. AFG
c. ABDG
d. ABC
Figure 811
Refer to Figure 811. The price labeled as P2 on the vertical axis represents the
a. difference between the price paid by buyers after the tax is imposed and the price
paid by buyers before the tax is imposed.

b. difference between the price received by sellers before the tax is imposed and the
price received by sellers after the tax is imposed.
c. price of the good before the tax is imposed.
d. price of the good after the tax is imposed.
Table 326
Assume that Japan and Korea can switch between producing cars and producing
airplanes at a constant rate.
Hours Needed to Make 1Quantity Produced in 2400 Hours
CarAirplaneCarsAirplanes
Japan301508016
Korea501504816
Refer to Table 326. Japan’s opportunity cost of one car is
a. 1/5 airplane and Korea’s opportunity cost of one car is 1/3 airplane.
b. 1/5 airplane and Korea’s opportunity cost of one car is 3 airplanes.
c. 5 airplanes and Korea’s opportunity cost of one car is 1/3 airplane.
d. 5 airplanes and Korea’s opportunity cost of one car is 3 airplanes.
The slow growth of U.S. incomes during the 1970s and 1980s can best be explained by
a. unstable economic conditions in Eastern Europe.
b. increased competition from abroad.
c. a decline in the rate of increase in U.S. productivity.
d. a strong U.S. dollar abroad, hurting U.S. exports.
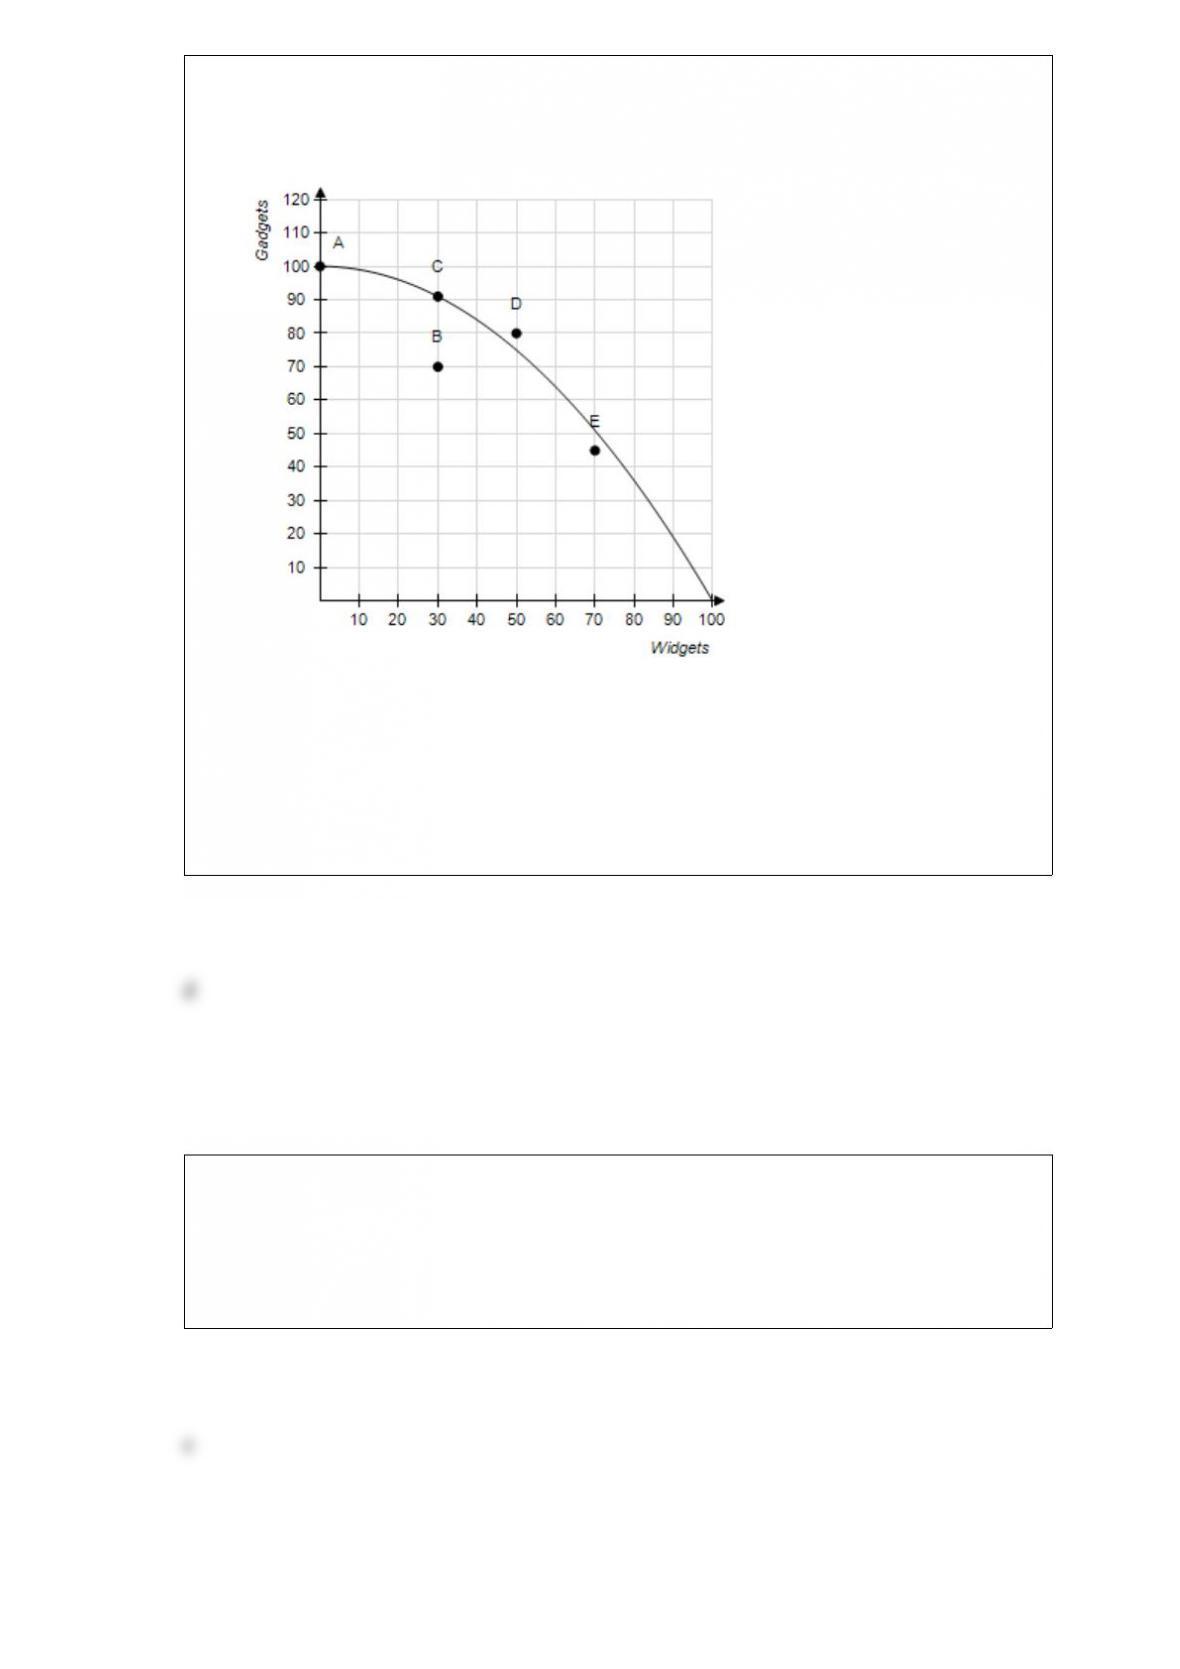
Figure 216
Refer to Figure 216. It is not possible for this economy to produce at point
a. A.
b. B.
c. C.
d. D.
A market includes
a. buyers only.
b. sellers only.
c. both buyers and sellers.
d. the place where transactions occur but not the people involved.

If the number of sellers in a market increases, then the
a. demand in that market will increase.
b. supply in that market will increase.
c. supply in that market will decrease.
d. demand in that market will decrease.
Deadweight loss measures the loss
a. in a market to buyers and sellers that is not offset by an increase in government
revenue.
b. in revenue to the government when buyers choose to buy less of the product because
of the tax.
c. of equality in a market due to government intervention.
d. of total revenue to business firms due to the price wedge caused by the tax.
When two variables have a positive correlation,
a. when the xvariable increases, the yvariable decreases.
b. when the xvariable decreases, the yvariable increases.
c. when the xvariable increases, the yvariable increases.
d. More than one of the above is correct.
Suppose the point (Q = 3,400, P = $20) is the midpoint on a certain downwardsloping,
linear demand curve. Then
a. a decrease in price from $18 to $16 will increase total revenue.

b. a decrease in price from $24 to $22 will decrease total revenue.
c. a decrease in the price from $21 to $19 will decrease total revenue.
d. the maximum value of total revenue is $68,000.
At a price of $1.00, a local coffee shop is willing to supply 100 cinnamon rolls per day.
At a price of $1.20, the coffee shop would be willing to supply 150 cinnamon rolls per
day. Using the midpoint method, the price elasticity of supply is about
a. 0.45
b. 0.90
c. 1.11
d. 2.20
Table 37
Assume that the farmer and the rancher can switch between producing meat and
producing potatoes at a constant rate.
Labor Hours Needed to Make 1 Pound ofPounds Produced in 24 Hours
MeatPotatoesMeatPotatoes
Farmer 6 4 4 6
Rancher 3 8 8 3
Refer to Table 37. Assume that the farmer and the rancher each has 24 labor hours
available. If each person divides his time equally between the production of meat and
potatoes, then total production is
a. 6 pounds of meat and 4.5 pounds of potatoes.
b. 5.5 pounds of meat and 8 pounds of potatoes.
c. 12 pounds of meat and 9 pounds of potatoes.
d. 5 pounds of meat and 5.5 pounds of potatoes.
