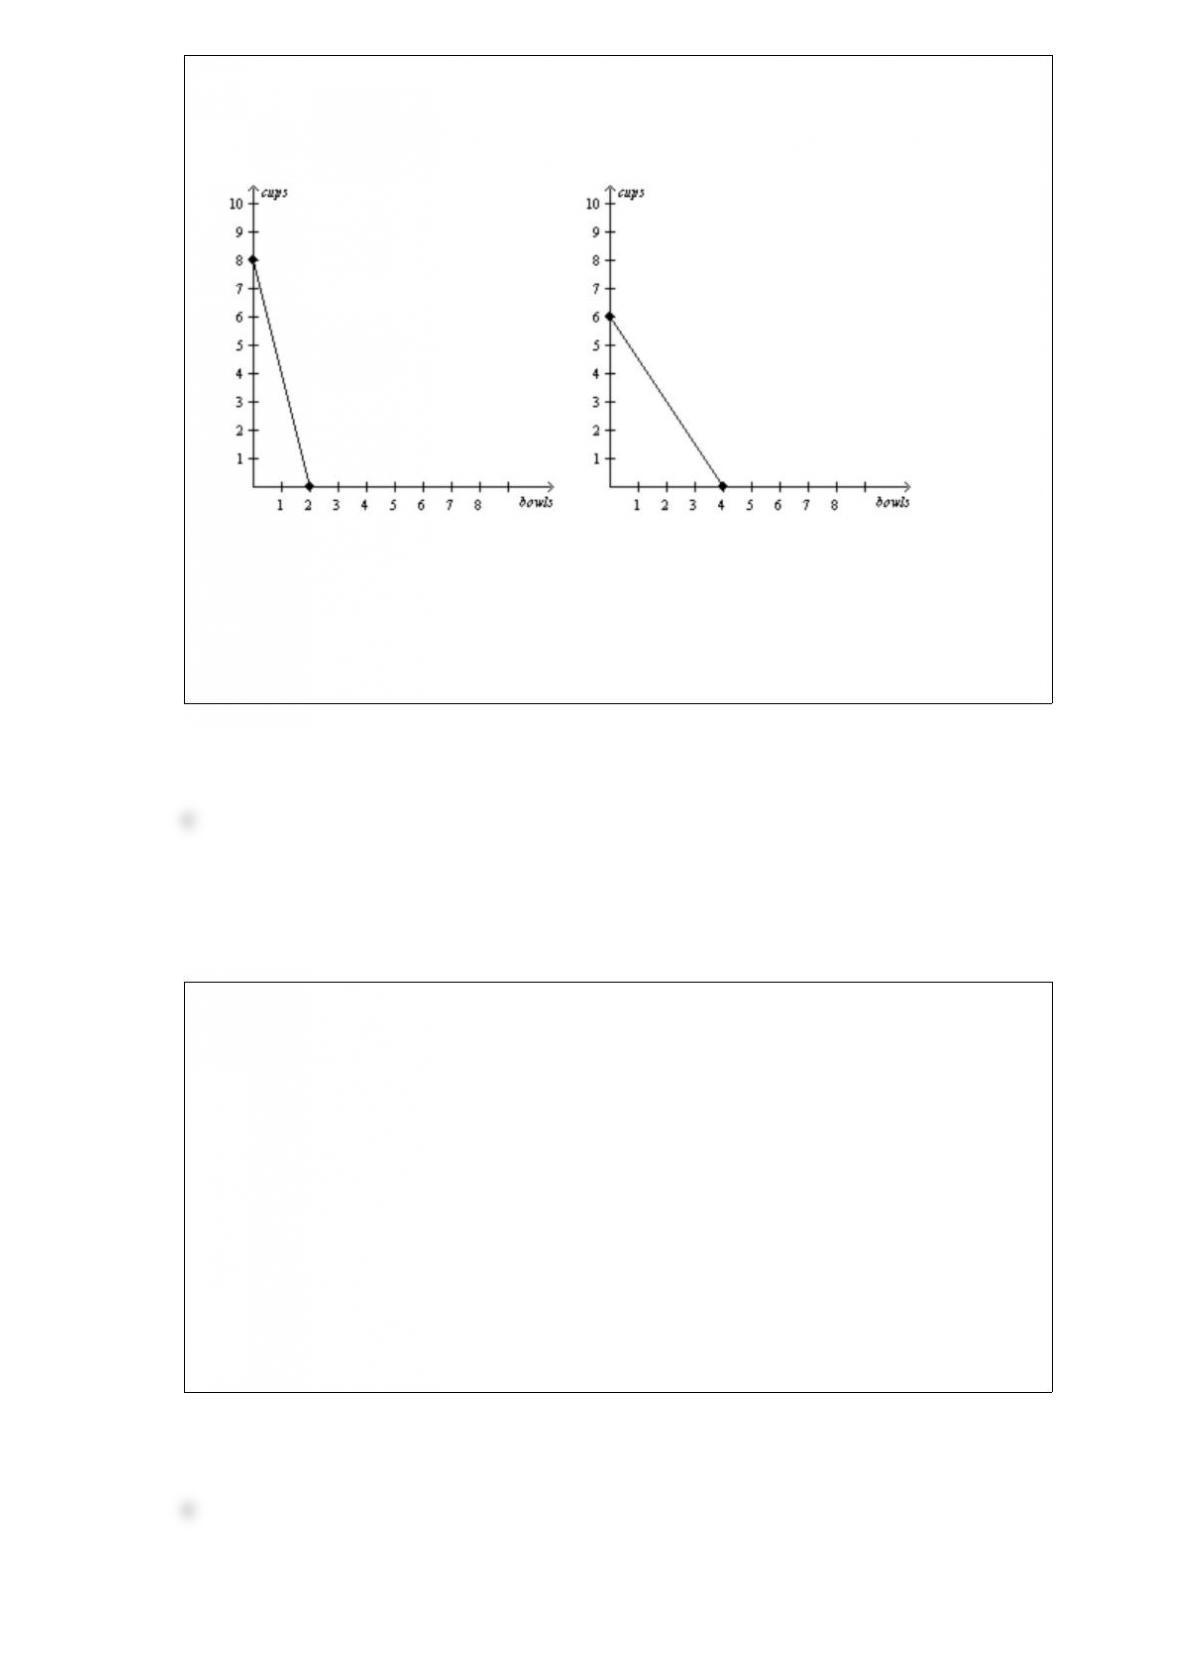
Figure 318
Bintu’s Production Possibilities FrontierJuba’s Production Possibilities Frontier
Refer to Figure 318. The opportunity cost of 1 bowl for Juba is
a. 1/4 cup.
b. 2/3 cup.
c. 3/2 cups.
d. 4 cups.
In January the price of dark chocolate candy bars was $2.00, and Willy’s Chocolate
Factory produced 80 pounds. In February the price of dark chocolate candy bars was
$2.50, and Willy’s produced 110 pounds. In March the price of dark chocolate candy
bars was $3.00, and Willy’s produced 140 pounds. The price elasticity of supply of
Willy’s dark chocolate candy bars was about
a. 0.70 when the price increased from $2.00 to $2.50 and 0.76 when the price increased
from $2.50 to $3.00.
b. 0.88 when the price increased from $2.00 to $2.50 and 1.08 when the price increased
from $2.50 to $3.00.
c. 1.42 when the price increased from $2.00 to $2.50 and 1.32 when the price increased
from $2.50 to $3.00.
d. 1.50 when the price increased from $2.00 to $2.50 and 1.18 when the price increased
from $2.50 to $3.00.

Table 413
The demand schedule below pertains to sandwiches demanded per week.
PriceHarry’s
Quantity
DemandedDarby’s
Quantity
DemandedJake’s
Quantity
Demanded
$3343
$512x
Refer to Table 413. Suppose Harry, Darby, and Jake are the only demanders of
sandwiches. Also suppose the following:
• x = 2.
• The current price of a sandwich is $3.00.
• The market quantity supplied of sandwiches is 4.
• The slope of the supply curve is 2.
Then there is currently a
a. shortage of 6 sandwiches, and the equilibrium price of a sandwich is less than $3.00.
b. shortage of 6 sandwiches, and the equilibrium price of a sandwich is $5.00.
c. surplus of 6 sandwiches, and the equilibrium price of a sandwich is less than $3.00.
d. surplus of 6 sandwiches, and the equilibrium price of a sandwich is $5.00.
Figure 82
The vertical distance between points A and B represents a tax in the market.
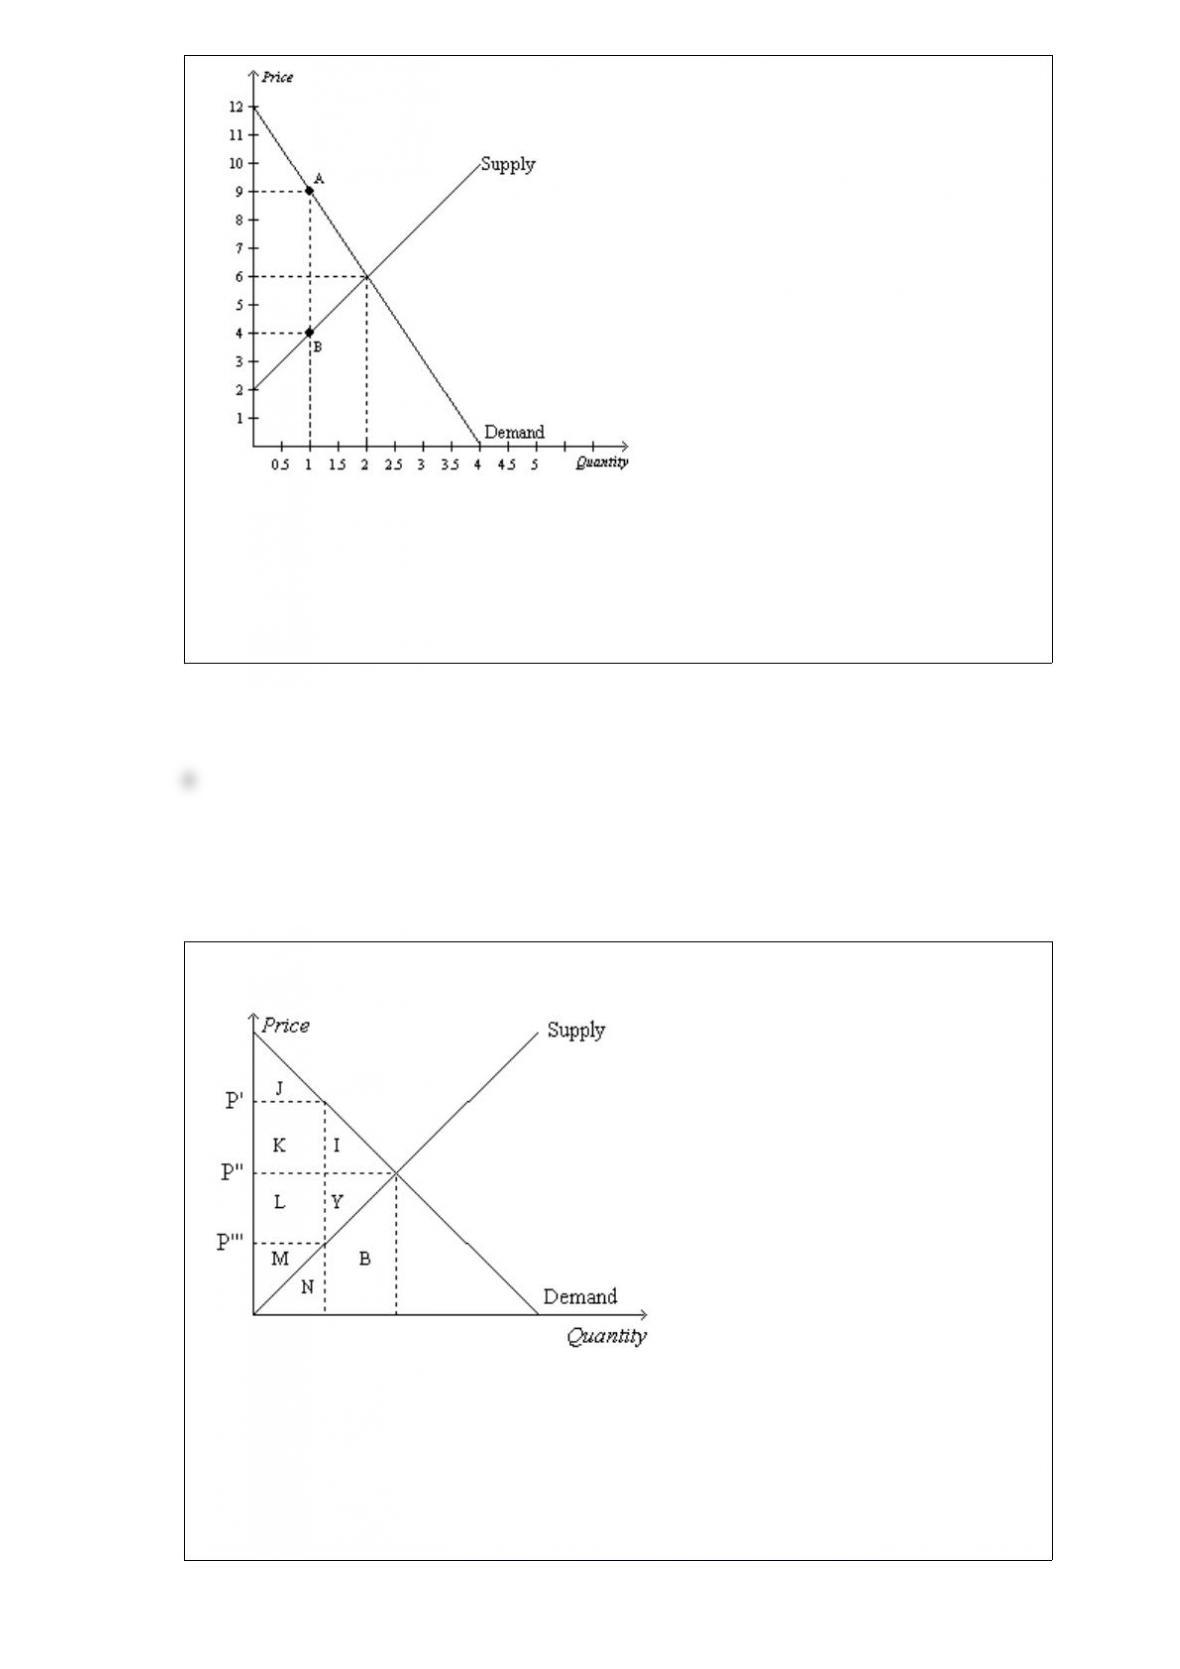
Refer to Figure 82. Producer surplus without the tax is
a. $4, and producer surplus with the tax is $1.
b. $4, and producer surplus with the tax is $3.
c. $10, and producer surplus with the tax is $1.
d. $10, and producer surplus with the tax is $3.
Figure 81
Refer to Figure 81. Suppose the government imposes a tax of P’ P”’. Total surplus after
the tax is measured by the area
a. I+Y.
b. J+K+L+M.
c. I+Y+B.
d. I+J+K+L+M+Y.
The less freedom people are given to choose the date of their retirement, the
a. more elastic is the supply of labor.
b. less elastic is the supply of labor.
c. flatter is the labor supply curve.
d. smaller is the decrease in employment that will result from a tax on labor.
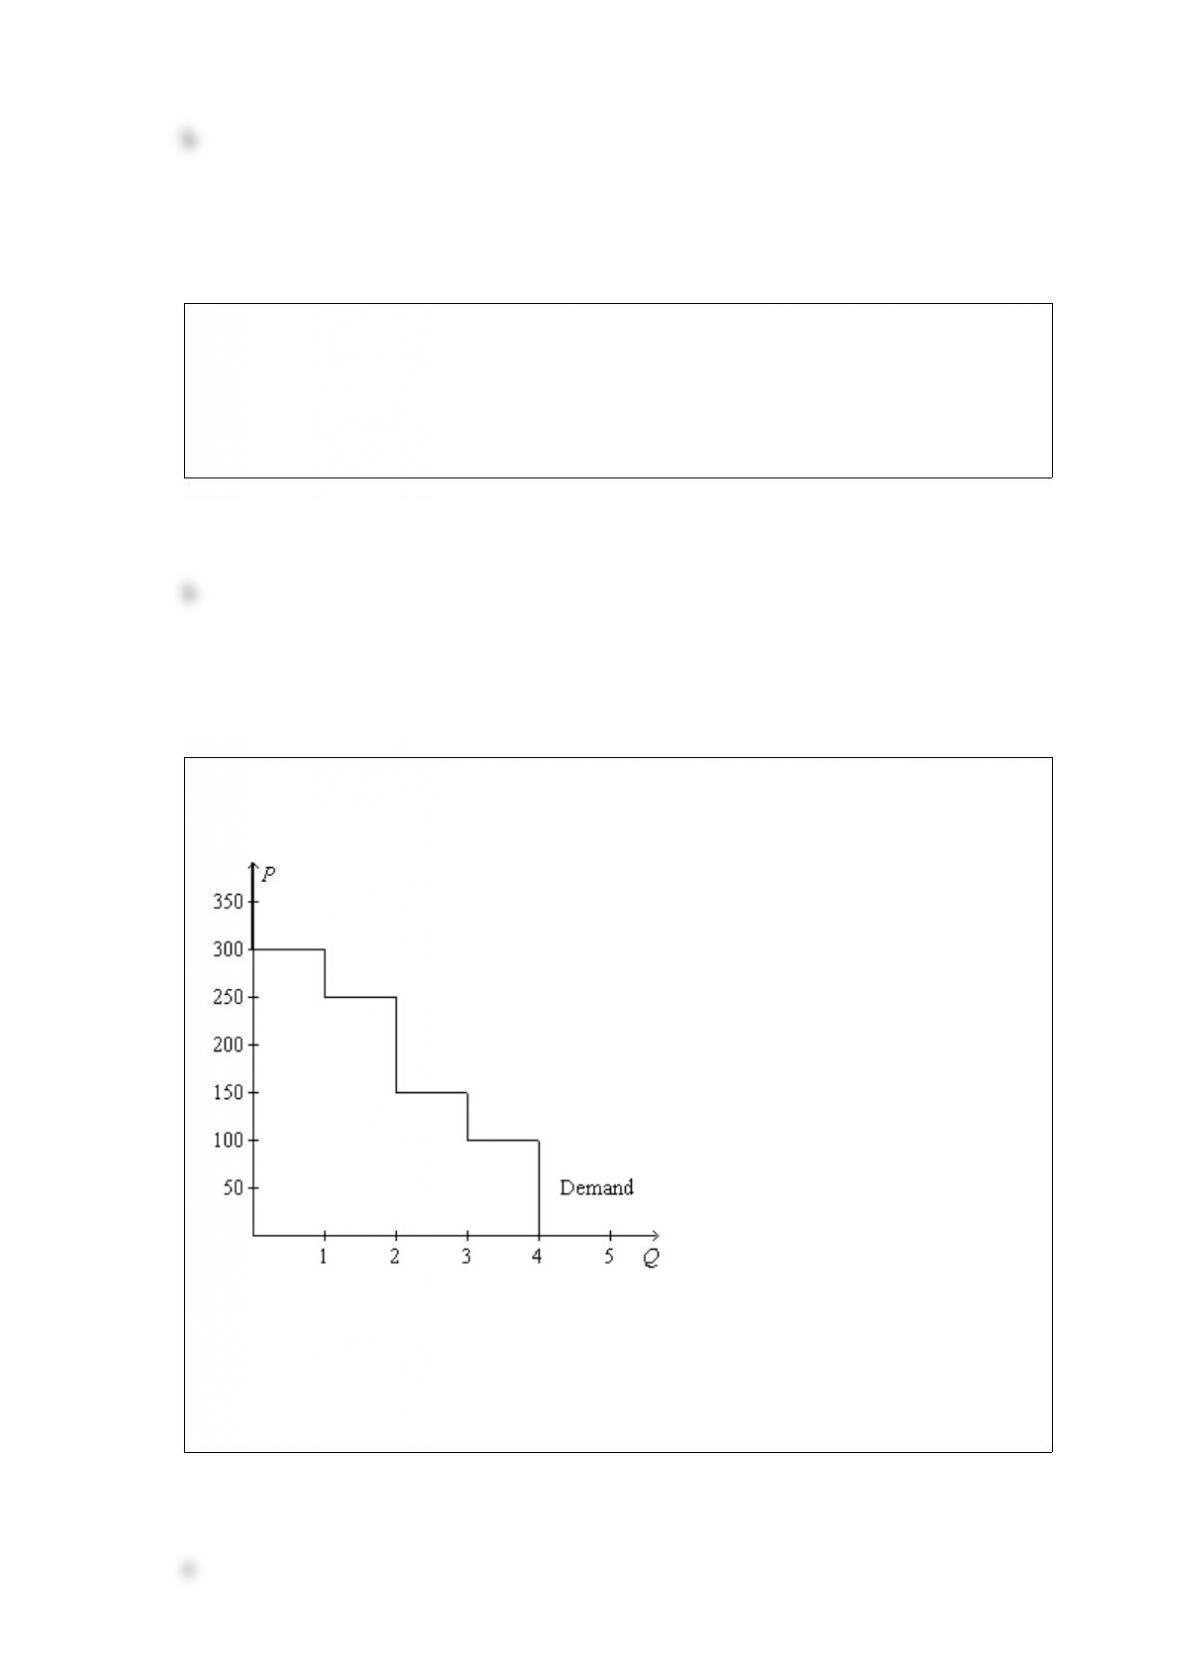
Figure 71
Refer to Figure 71. If the price of the good is $250, then consumer surplus amounts to
a. $50.
b. $100.
c. $150.
d. $200.
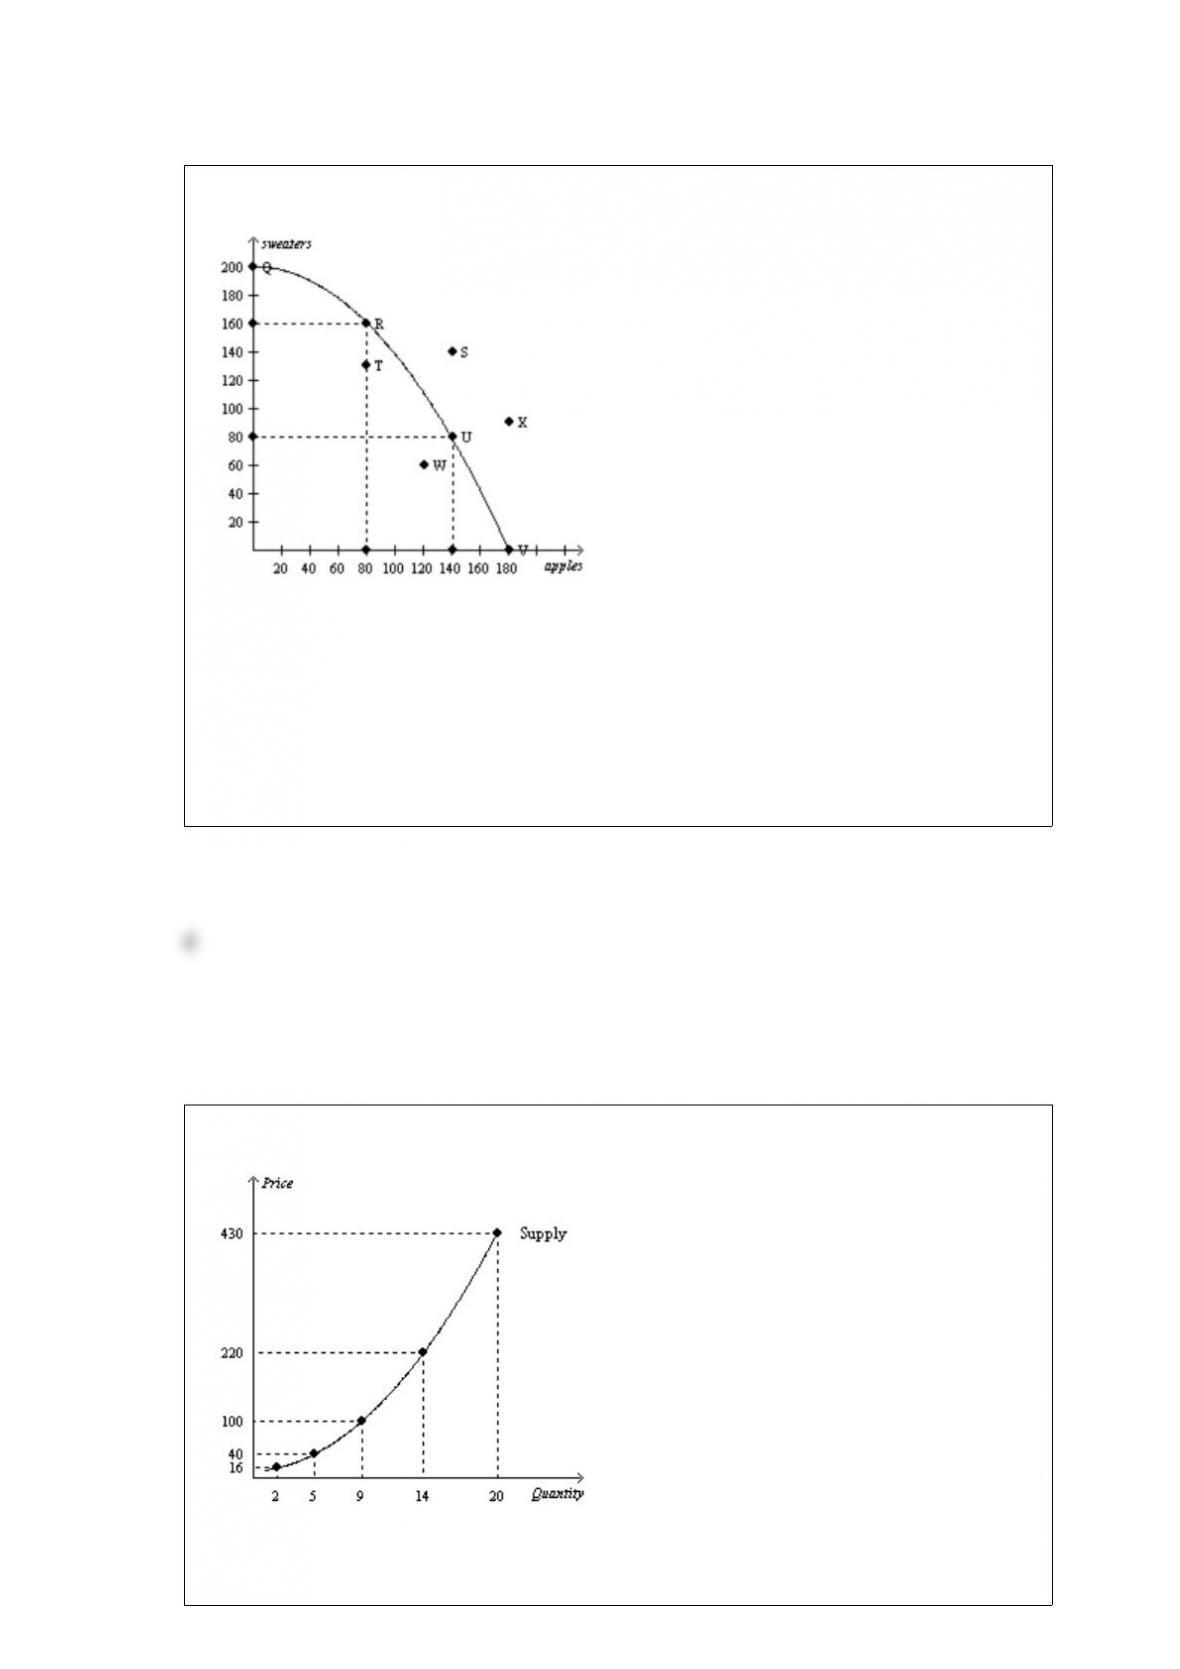
Figure 214
Consider the production possibilities curve for a country that can produce sweaters,
apples (in bushels), or a combination of the two
Refer to Figure 214. If this society moves from point U to point V,
a. it gives up 40 bushels of apples to get 80 sweaters.
b. it gives up 140 bushels of apples to get 80 sweaters.
c. it gives up 80 sweaters to get 140 bushels of apples.
d. it gives up 80 sweaters to get 40 bushels of apples.
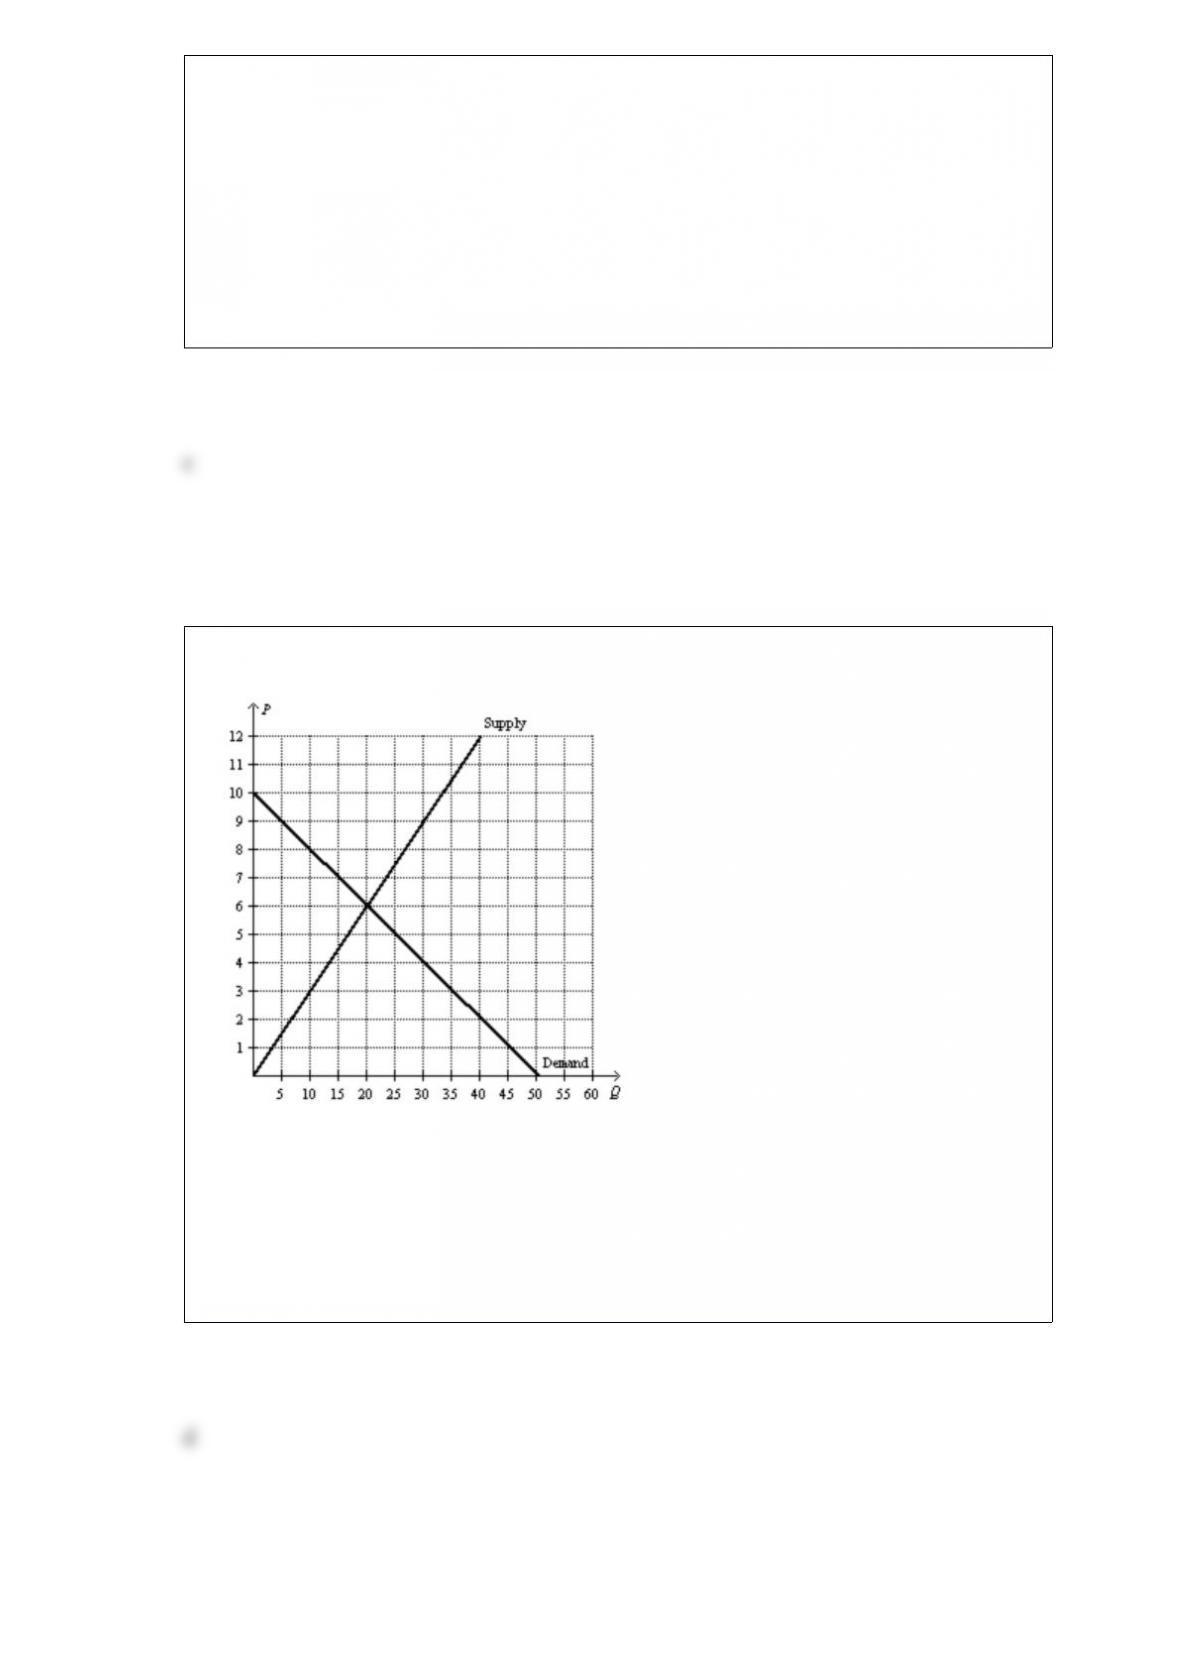
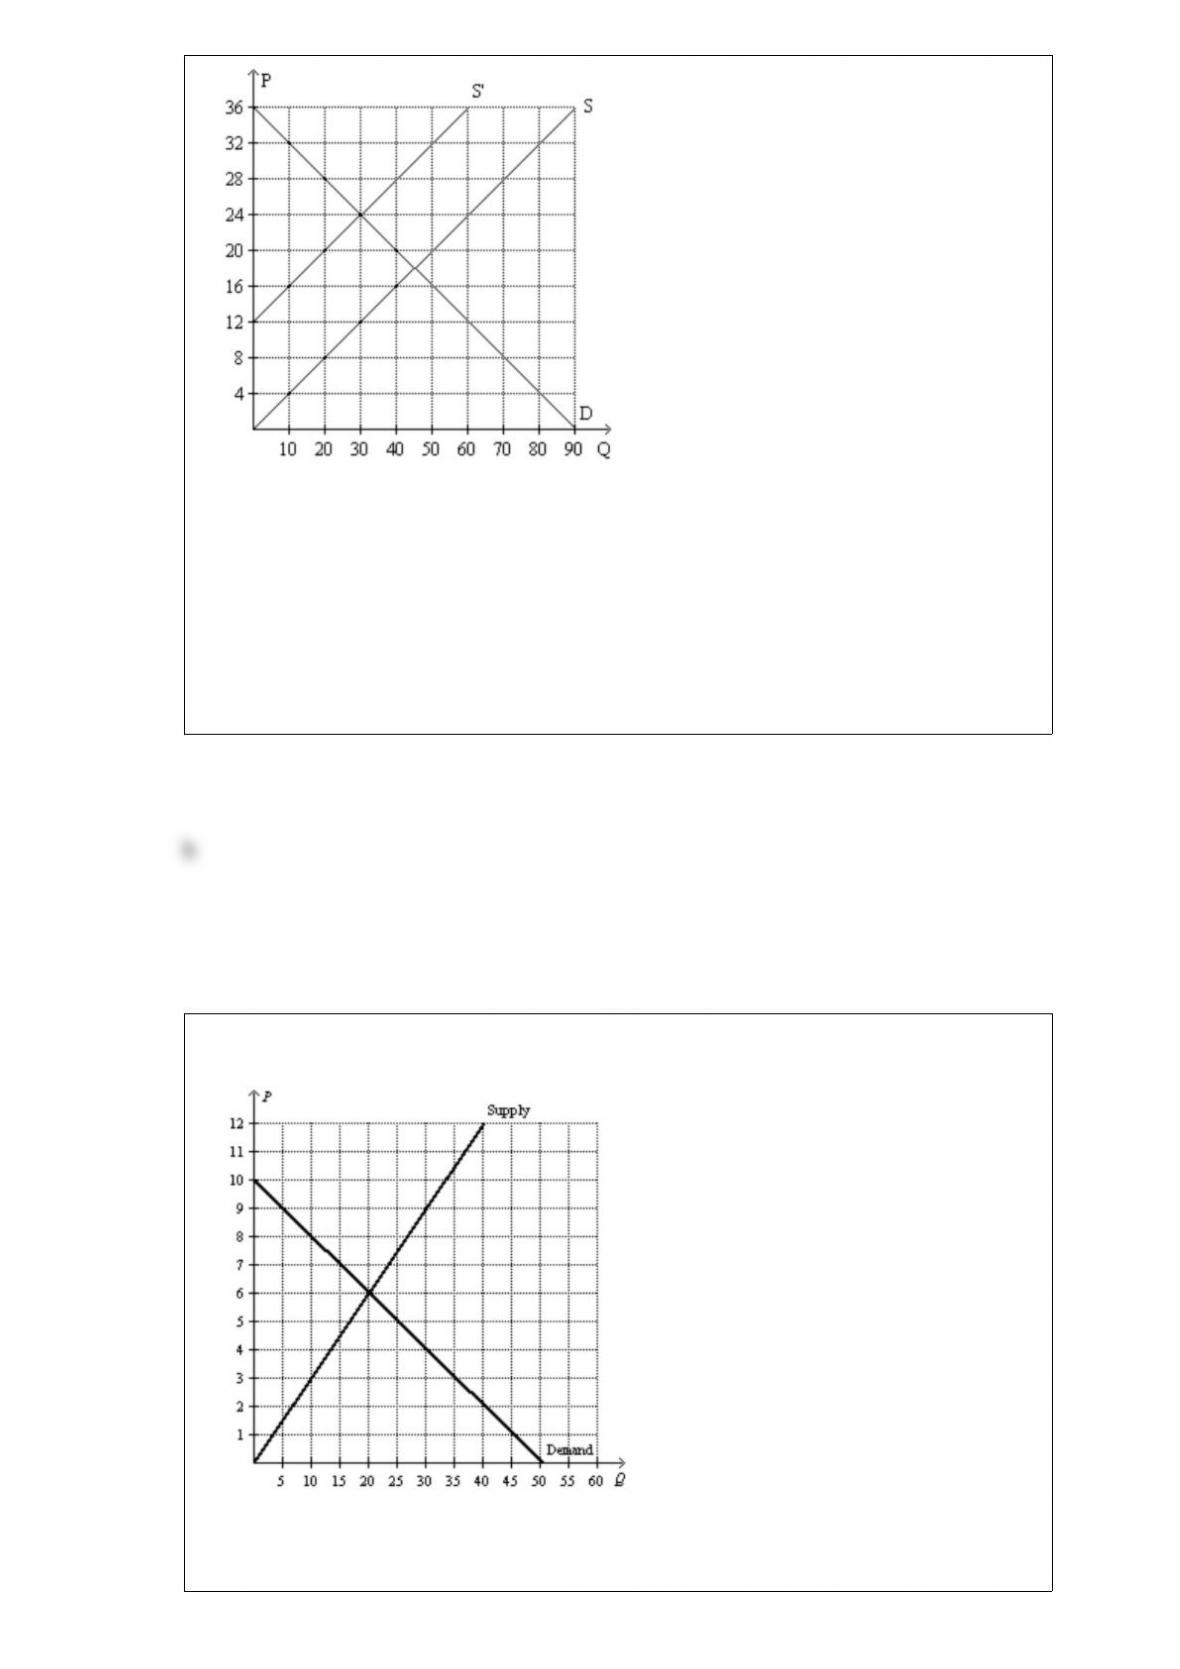
Figure 514
Refer to Figure 514. Using the midpoint method, what is the price elasticity of supply
between $16 and $40?

a. 0.125
b. 0.86
c. 1.0
d. 2.5
Which of the following is correct?
a. Efficiency deals with the size of the economic pie, and equality deals with how fairly
the pie is sliced.
b. Equality can be judged on positive grounds whereas efficiency requires normative
judgments.
c. Efficiency is more difficult to evaluate than equality.
d. Equality and efficiency are both maximized in a society when total surplus is
maximized.
The graph that represents the amount of deadweight loss (measured on the vertical axis)
as a function of the size of the tax (measured on the horizontal axis) looks like
a. a U.
b. an upsidedown U.
c. a horizontal straight line.
d. an upwardsloping curve.
Chile is an importer of computer chips, taking the world price of $12 per chip as given.
Suppose Chile imposes a $7 tariff on chips. Which of the following outcomes is
possible?
a. The price of chips in Chile increases to $19; the quantity of Chileanproduced chips
decreases; and the quantity of chips imported by Chile decreases.
b. The price of chips in Chile increases to $16; the quantity of Chileanproduced chips
increases; and the quantity of chips imported by Chile decreases.
c. The price of chips in Chile increases to $19; the quantity of Chileanproduced chips
increases; and the quantity of chips imported by Chile decreases.
d. The price of chips in Chile increases to $16; the quantity of Chileanproduced chips
increases; and the quantity of chips imported by Chile does not change.
Figure 813
Refer to Figure 813. Suppose the government places a $5 perunit tax on this good. The
amount of deadweight loss resulting from this tax is
a. $120.
b. $80.
c. $50.
d. $25.
Which of the following statements is correct regarding the imposition of a tax on
gasoline?
a. The incidence of the tax depends upon whether the buyers or the sellers are required
to remit tax payments to the government.
b. The incidence of the tax depends upon the price elasticities of demand and supply.
c. The amount of tax revenue raised by the tax depends upon whether the buyers or the
sellers are required to remit tax payments to the government.
d. The amount of tax revenue raised by the tax does not depend upon the amount of the
tax per unit.
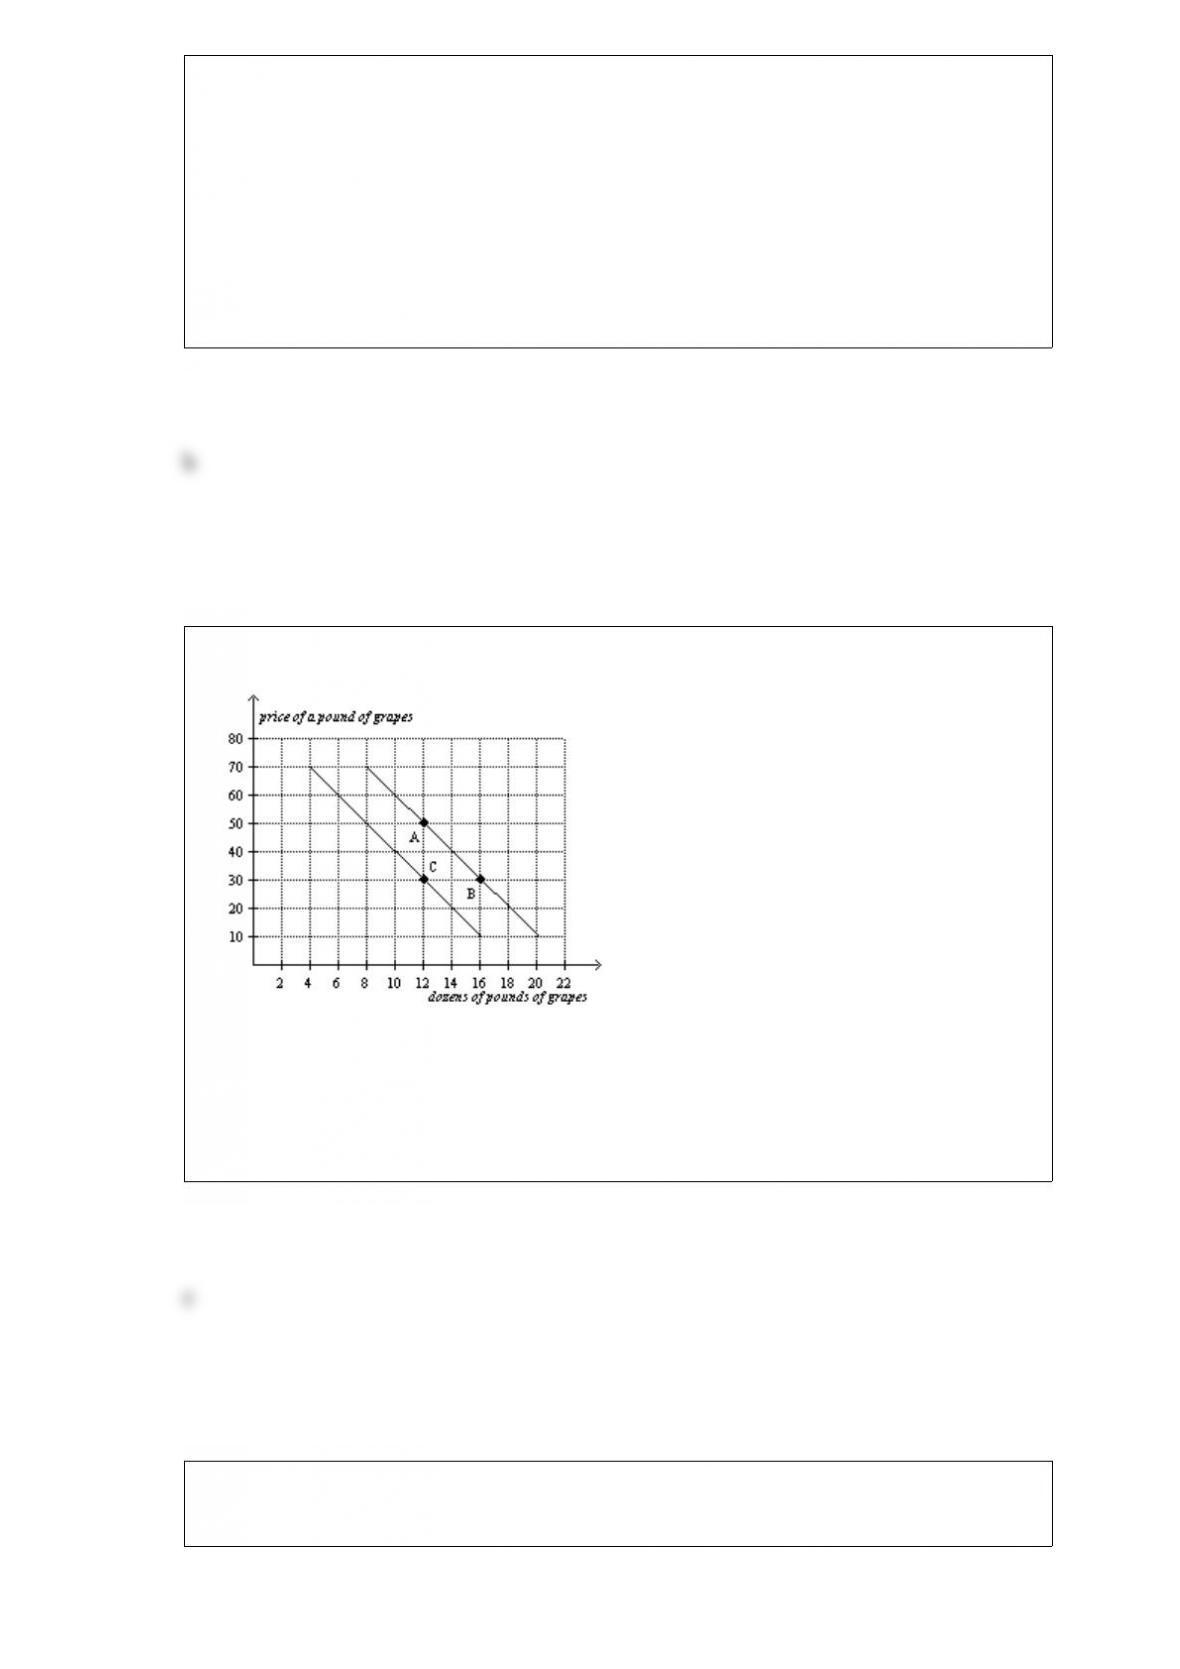
Figure 217
Refer to Figure 217. The movement from point A to point B is a(n)
a. shift of the demand curve.
b. indication of a change in preferences for grapes.
c. movement along the demand curve.
d. indication of an increase in income.
Figure 724

Refer to Figure 724. At equilibrium, total surplus is
a. $36.
b. $54.
c. $18.
d. $108.
The value of the price elasticity of demand for a good will be relatively large when
a. there are no good substitutes available for the good.
b. the time period in question is relatively short.
c. the good is a luxury rather than a necessity.
d. All of the above are correct.
Scenario 51
Suppose that when the average college student’s income is $10,000 per year, the annual
quantity demanded of Patty’s Pizza is 50 and the annual quantity demanded of Sue’s
Subs is 80. Suppose that when the price of Patty’s Pizza increases from $8 to $10 per
pie, the quantity demanded of Sue’s Subs increases from 80 to 100. Suppose also that

when the average student’s income increases to $12,000 per year, the annual quantity
demanded of Patty’s Pizza increases from 50 to 60.
Refer to Scenario 51. What can you deduce about the type of good Patty’s Pizza is and
about the relationship between Patty’s Pizza and Sue’s Subs?
a. Patty’s Pizza is a normal good and Patty’s Pizza and Sue’s Subs are substitutes.
b. Patty’s Pizza is a normal good and Patty’s Pizza and Sue’s Subs are complements.
c. Patty’s Pizza is an inferior good and Patty’s Pizza and Sue’s Subs are substitutes.
d. Patty’s Pizza is an inferior good and Patty’s Pizza and Sue’s Subs are complements.
Katie is planning to sell her house, and she is considering making two upgrades to the
house before listing it for sale. Replacing the carpeting will cost her $2,500 and
replacing the roof will cost her $9,000. Katie expects the new carpeting to increase the
value of her house by $3,000 and the new roof to increase the value of her house by
$7,000.
a. She should make both improvements to her house.
b. She should replace the carpeting but not replace the roof.
c. She should replace the roof but not replace the carpeting.
d. She should not make either improvement to her house.
If a tax is levied on the sellers of a product, then the demand curve will
a. shift down.
b. shift up.
c. become flatter.
d. not shift.

Steak and chicken are substitutes. A sharp reduction in the supply of steak would
a. increase consumer surplus in the market for steak and decrease producer surplus in
the market for chicken.
b. increase consumer surplus in the market for steak and increase producer surplus in
the market for chicken.
c. decrease consumer surplus in the market for steak and increase producer surplus in
the market for chicken.
d. decrease consumer surplus in the market for steak and decrease producer surplus in
the market for chicken.
The decrease in total surplus that results from a market distortion, such as a tax, is
called a
a. wedge loss.
b. revenue loss.
c. deadweight loss.
d. consumer surplus loss.
Figure 218
Relationship between Price and Restaurant Meals
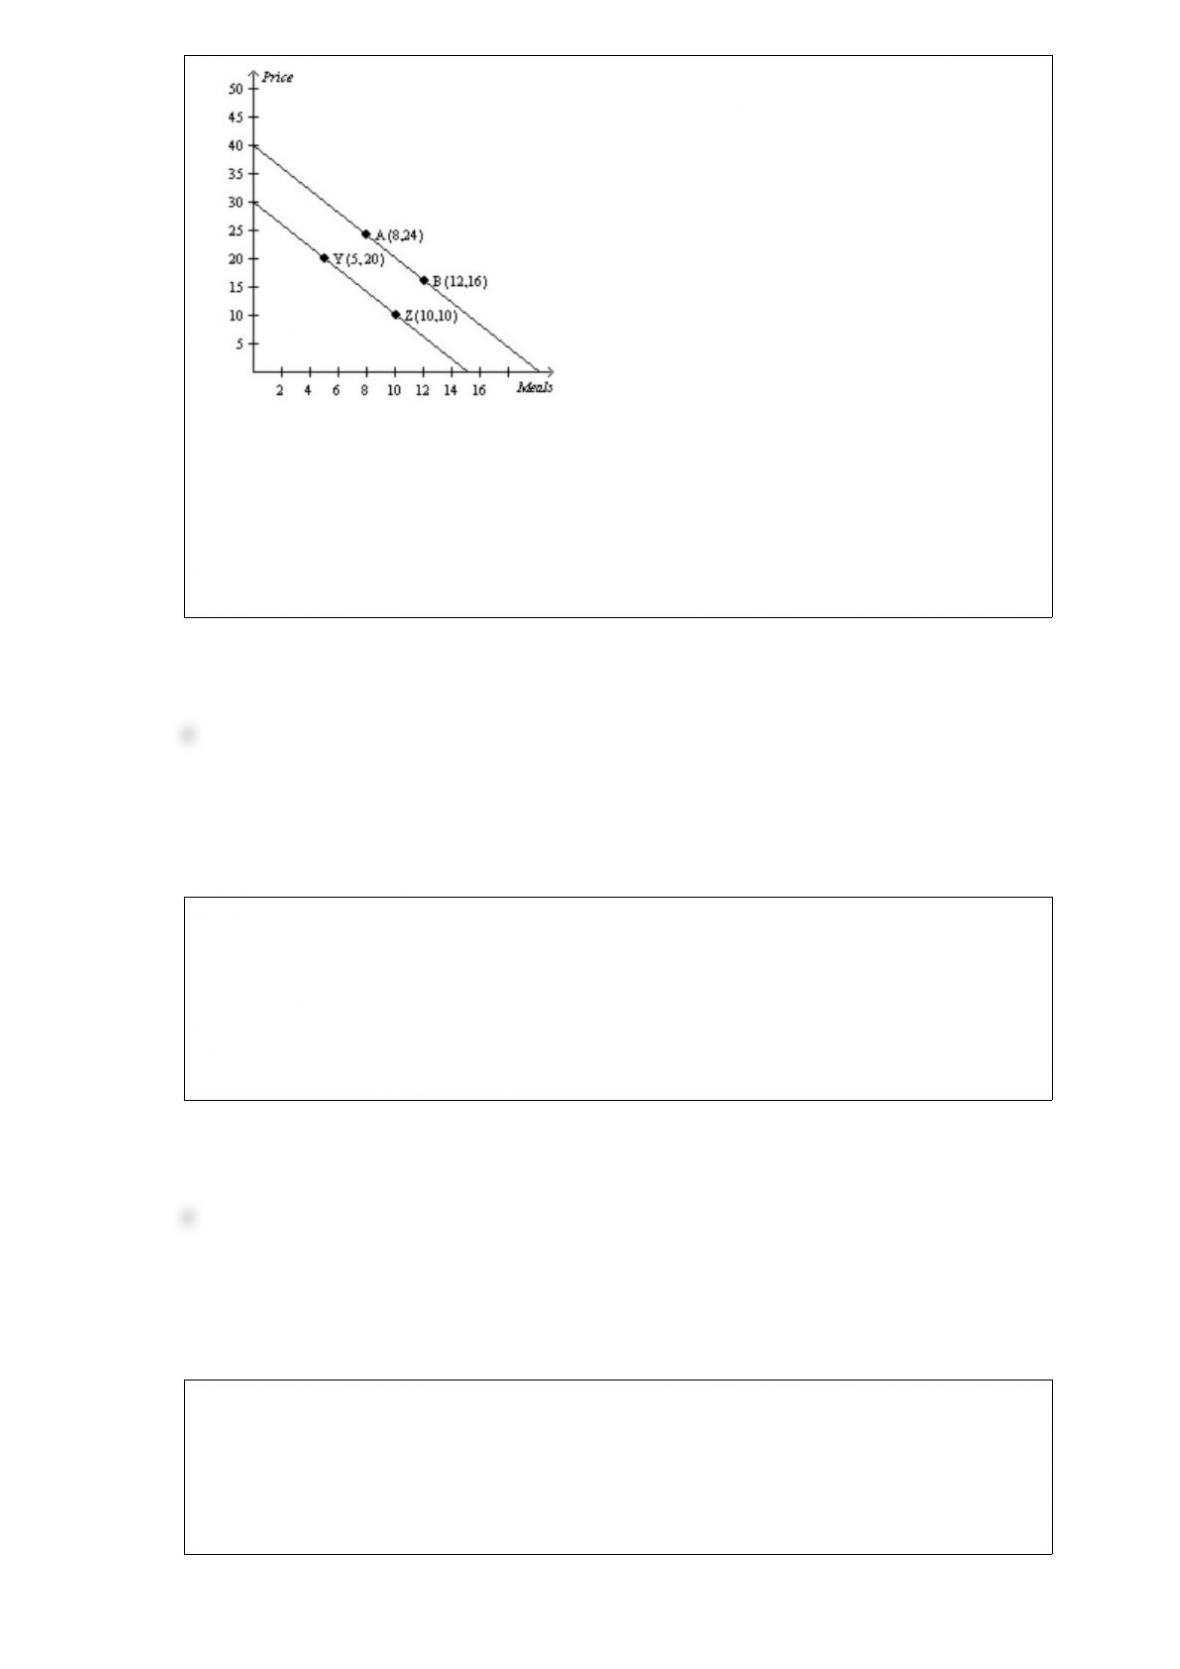
Refer to Figure 218. Which of the following could result in a movement from point A
to point B?
a. a change in income
b. a change in the cost of producing a restaurant meal
c. a change in the price of restaurant meals
d. a change in the price of movies
Chuck would be willing to pay $20 to attend a dog show, but he buys a ticket for $15.
Chuck values the dog show at
a. $5.
b. $15.
c. $20.
d. $35.
Which of the following could reduce economic efficiency?
a. laws that encourage lawsuits
b. policies that redistribute income
c. policies that impose significant restrictions on international trade
d. All of the above are correct
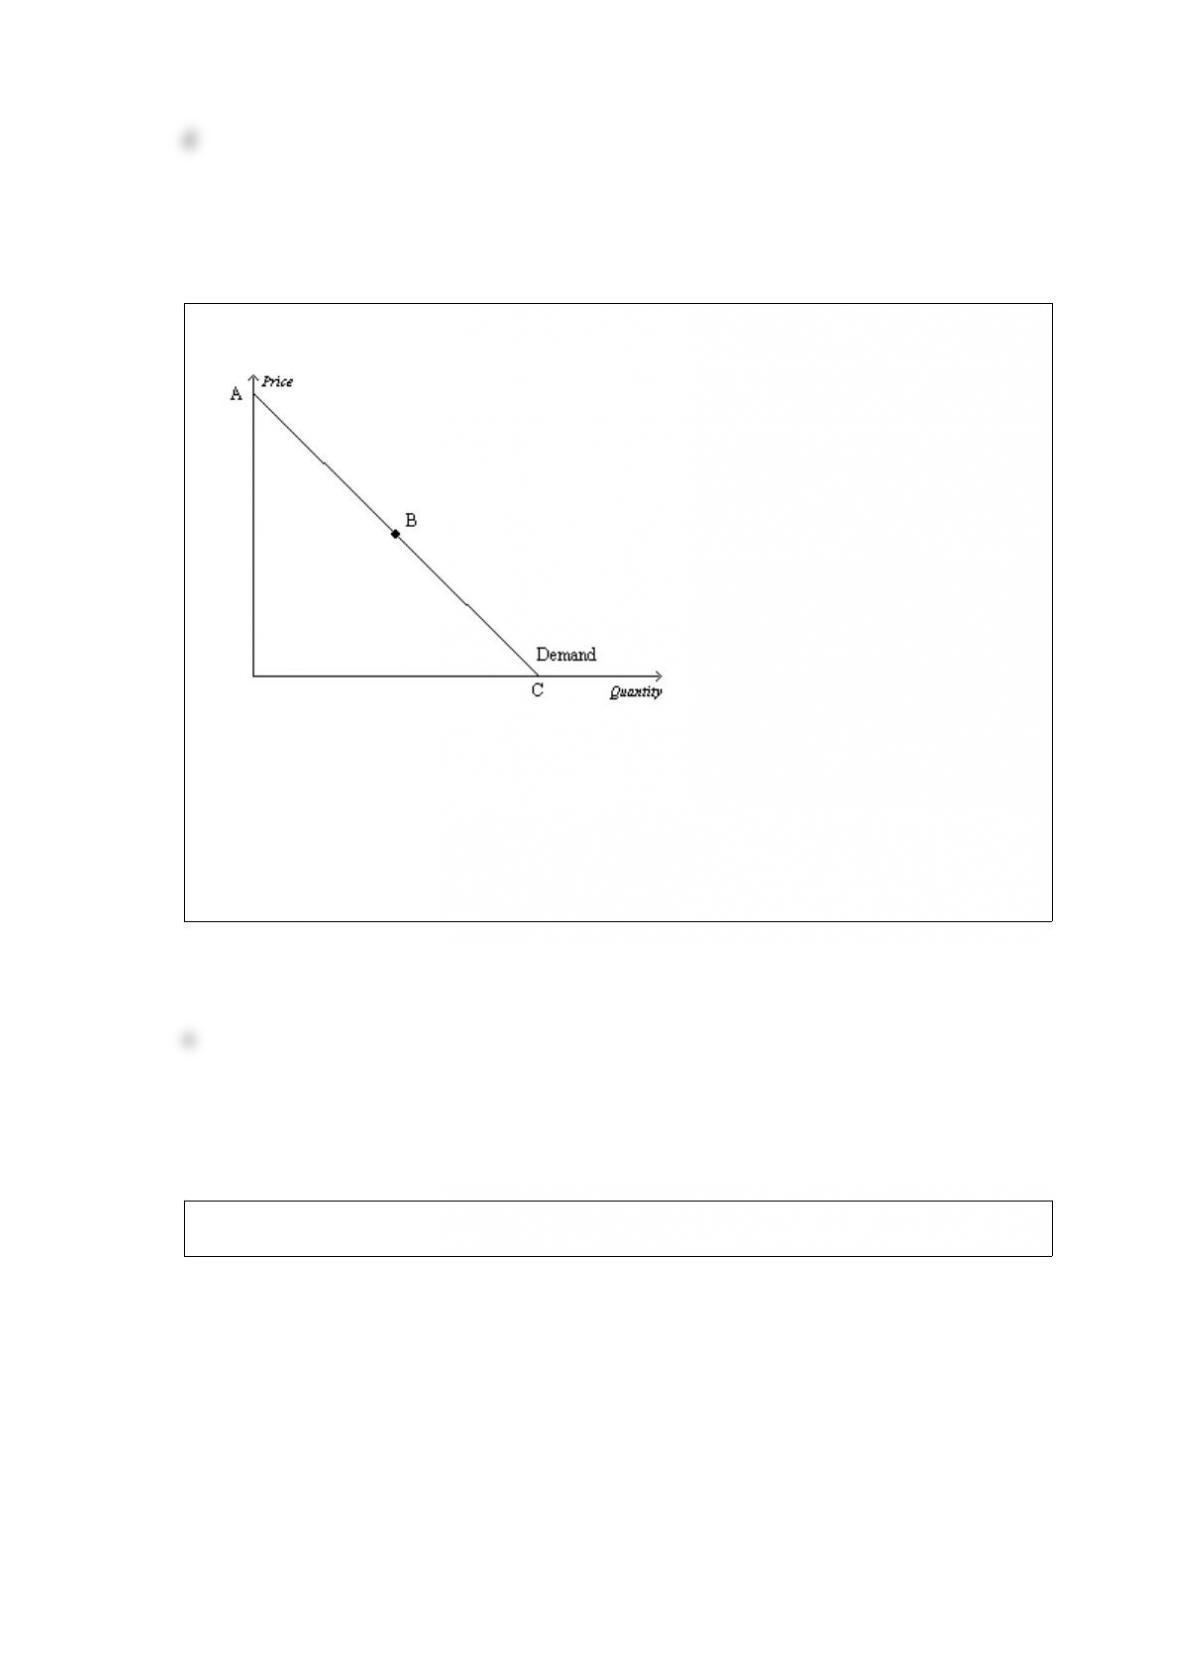
Figure 54
Refer to Figure 54. Assume the section of the demand curve from B to C corresponds
to prices between $0 and $15. Then, when the price changes between $7 and $9,
a. quantity demanded changes proportionately less than the price.
b. quantity demanded changes proportionately more than the price.
c. quantity demanded changes the same amount proportionately as price.
d. the price elasticity of demand equals zero.
Figure 717
Refer to Figure 717. Suppose the market starts out in equilibrium with demand curve
D and supply curve S. Next, suppose demand shifts left so as to decrease the quantity
demanded by 20 units at every price. What is the change in producer surplus as a result
of this demand shift?
a. $80
b. $160
c. $240
d. $320
Figure 813
Refer to Figure 813. Suppose the government places a $5 perunit tax on this good. The
loss of consumer surplus resulting from this tax is
a. $80.
b. $40.
c. $30.
d. $10.
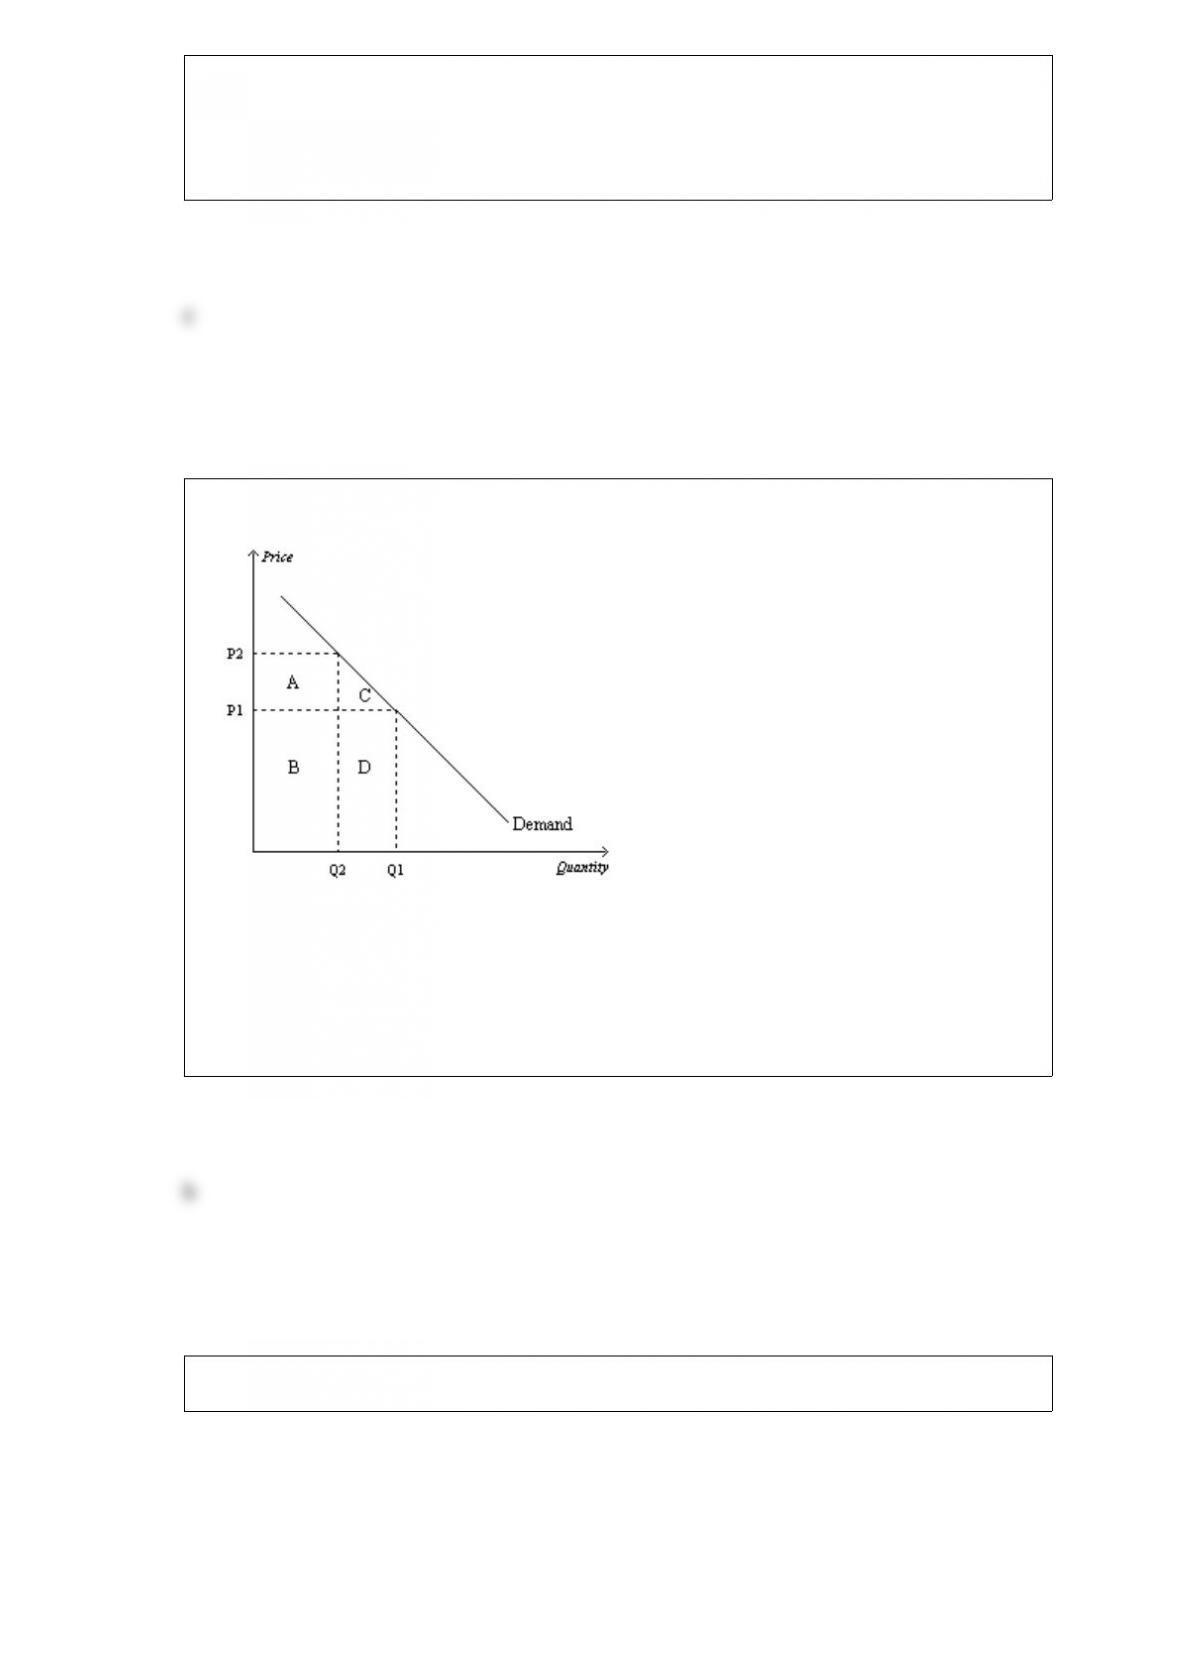
Figure 510
Refer to Figure 510. Total revenue when the price is P2 is represented by the area(s)
a. B + D.
b. A + B.
c. C + D.
d. D.
Figure 94. The domestic country is Nicaragua.
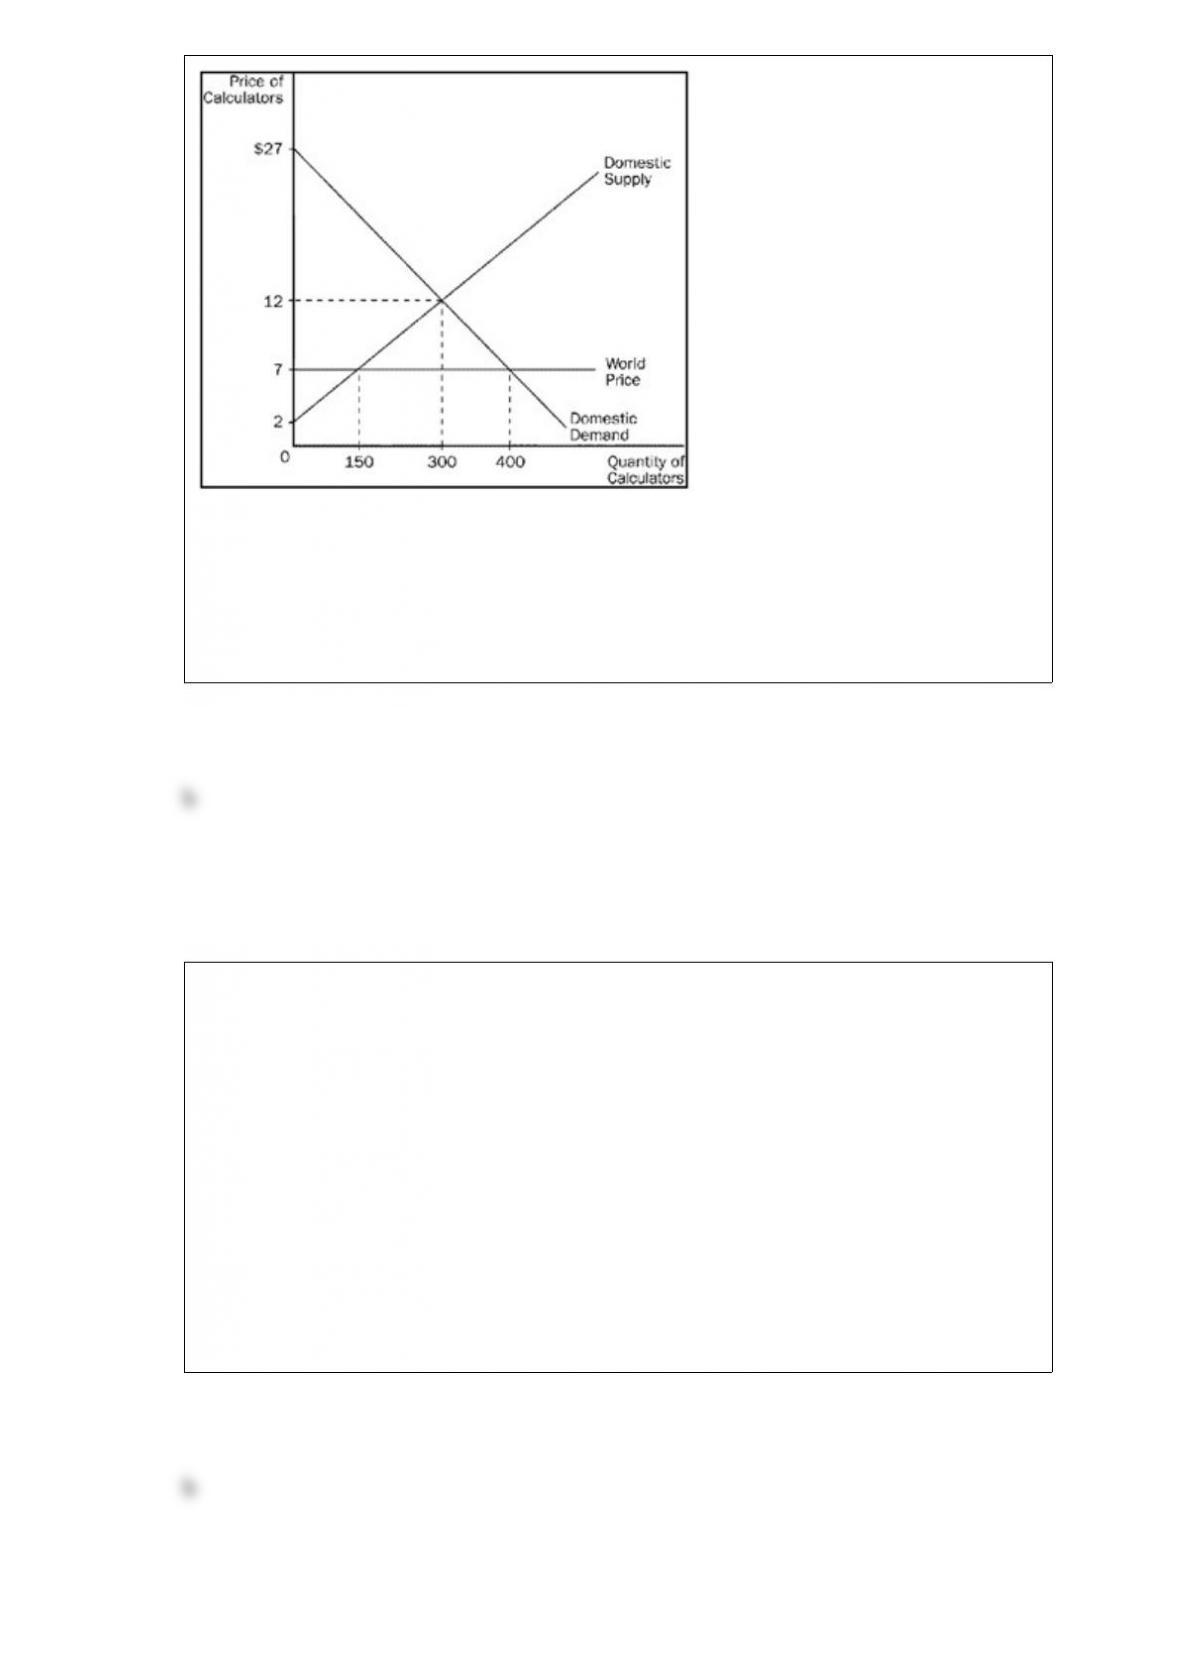
Refer to Figure 94. Which of the following statements is accurate?
a. Consumer surplus with trade is $3,200.
b. Producer surplus with trade is $375.
c. The gains from trade amount to $800.
d. The gains from trade are represented on the graph by the area bounded by the points
(0, $12), (300, $12), (300, $7) and (0, $7).
Table 713
The only four producers in a market have the following costs:
SellerCost
Abbey$30
Bev$40
Carl$55
Dale$65
Refer to Table 713. If the sellers bid against each other for the right to sell the good to
a single consumer, then the good will sell for
a. $30 or slightly more.
b. $40 or slightly less.
c. $55 or slightly less.
d. $65 or slightly less.

Table 325
Assume that Maya and Miguel can switch between producing mixers and producing
toasters at a constant rate.
Hours Needed to Make 1Amount Produced in 40 Hours
mixertoastermixerstoasters
Maya8558
Miguel201024
Refer to Table 325. The opportunity cost of 1 mixer for Miguel is
a. 1/2 toaster.
b. 1/2 hour of labor.
c. 2 toasters.
d. 8 hours of labor.
Table 336
Minutes Needed
to Make 1
TowelUmbrella
Antigua1220
Barbuda1510
Refer to Table 336. What is Barbuda’s opportunity cost of one towel?
a. 3/5 umbrellas
b. 2/3 umbrellas
c. 3/2 umbrellas
d. 5/3 umbrellas