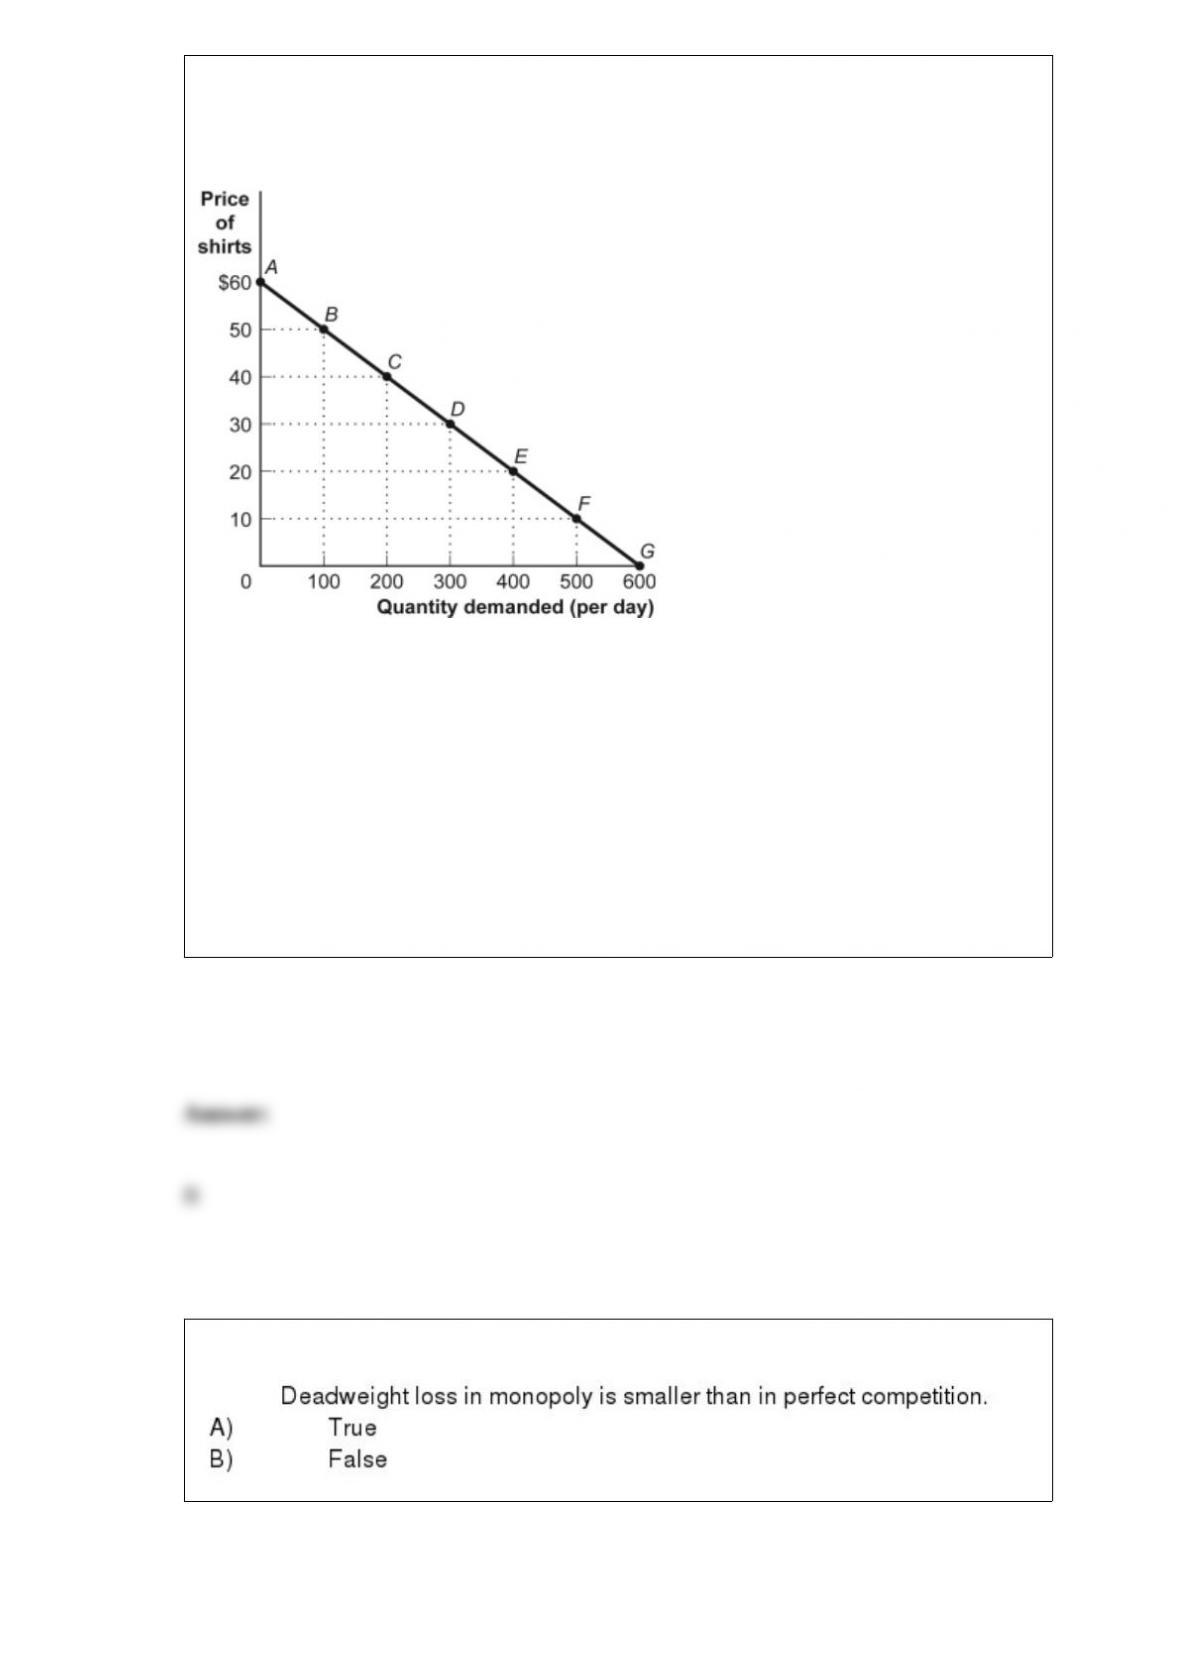
Figure: The Demand for Shirts
(Figure: The Demand for Shirts) Look at the figure The Demand for Shirts. The price
elasticity of demand, by the midpoint method, for the segment FG is approximately:
A) 0.
B) 0.09.
C) 0.5.
D) greater than 1.

Sunk costs:
A) affect economic profit.
B) are the losses associated with failed business ventures.
C) are an important component of marginal analysis.
D) are the same as marginal costs.
When the government imposes a quota on sales of a good or service, it usually licenses
the right to sell a given quantity of the good. The market price of the license is equal to:
A) the demand price of the good.
B) the wedge that represents the difference between the demand price and the supply
price.
C) the quota rent.
D) the quota rent plus the wedge that represents the difference between the demand
price and the supply price.
Means-tested programs:
A) provide benefits for all.
B) are poverty programs that specifically help those with low incomes.
C) provide benefits only for households that earn below the mean household income in
the United States for a given year.
D) provide only in-kind benefits.
A decision maker who is irrational:
A) chooses an option that makes him or her worse off rather than choosing another
available option.
B) chooses the option that makes him or her better off rather than choosing another

available option.
C) allocates income to maximize his or her satisfaction from consuming goods and
services.
D) seeks to maximize business profit.
Suppose Congress passed a new tax system, such that all federal, state, and local taxes
were replaced with one tax: a tax of $14,000 for every person 18 and over. This new tax
system would clearly improve:
A) tax equity.
B) tax fairness.
C) tax efficiency.
D) government revenue.
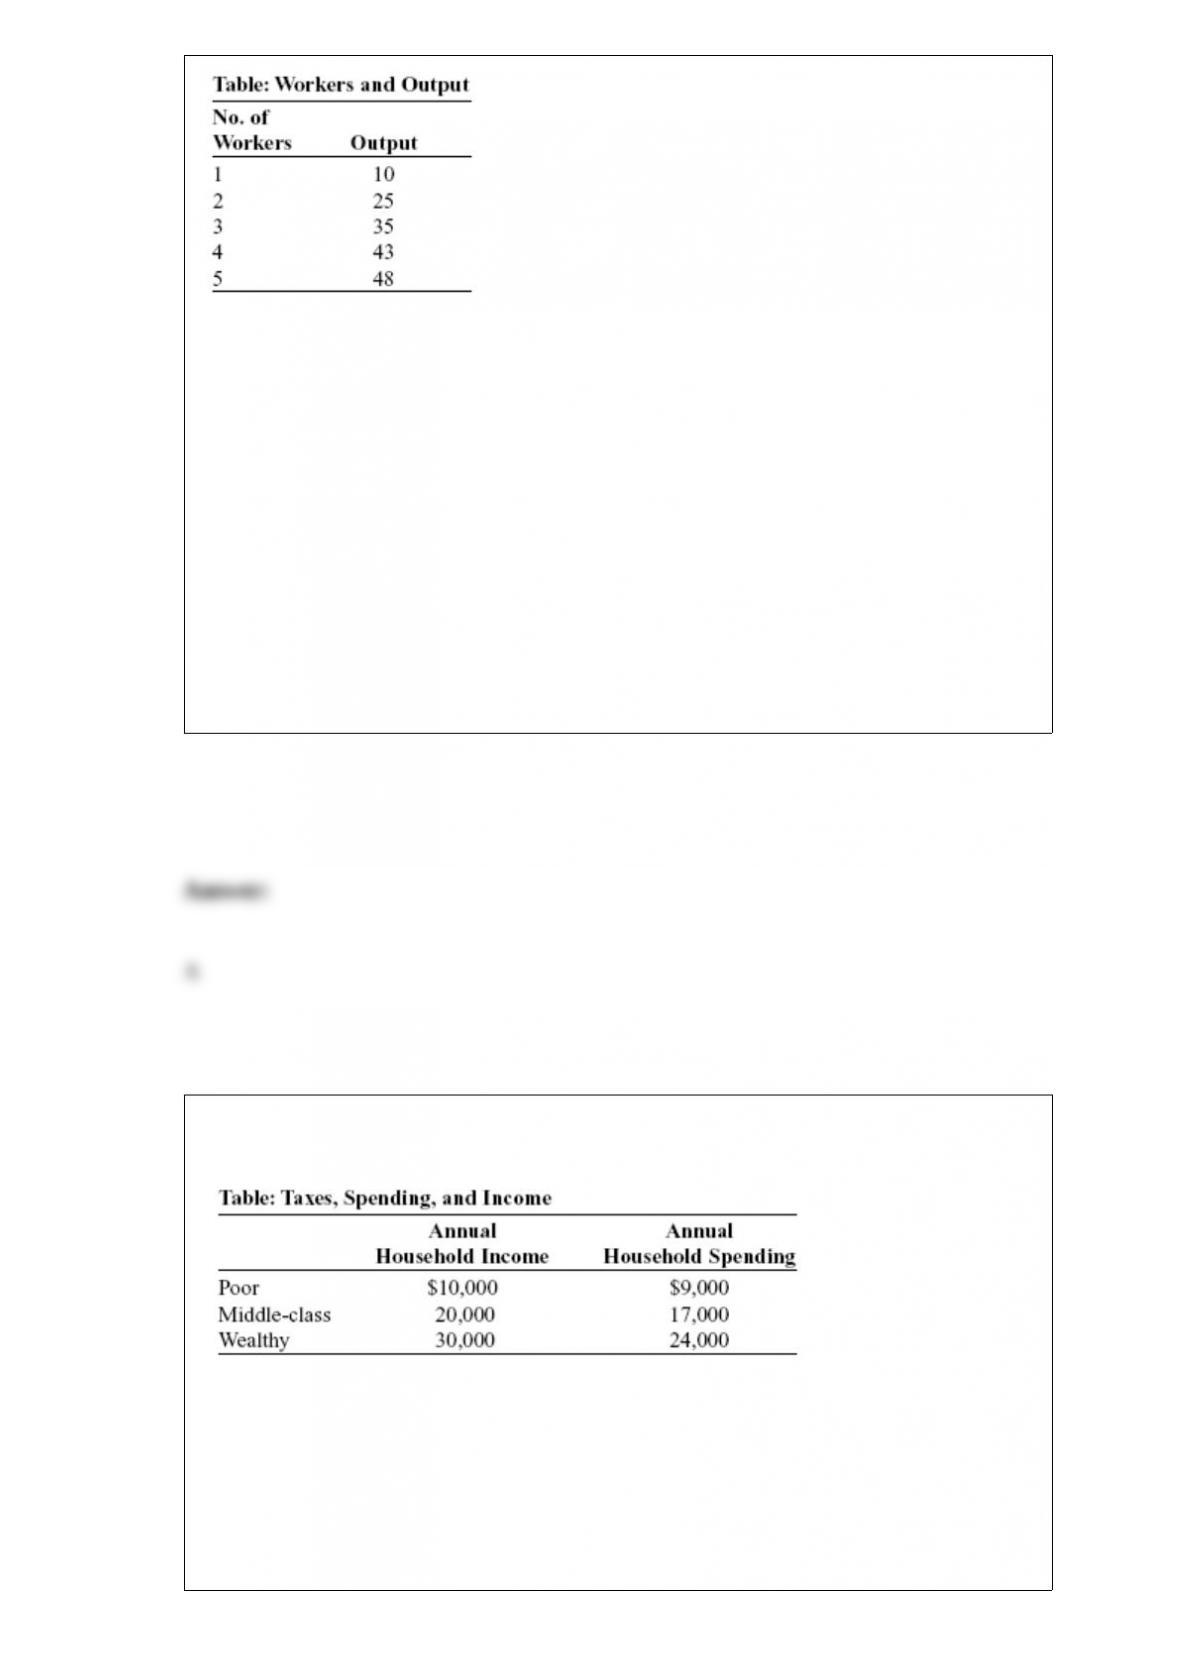
(Table: Workers and Output) Look at the table Workers and Output. After graduation
you achieve your dream of opening an art shop that specializes in selling mud statues.
You pay $10 per day on a loan from your uncle, and regardless of how much you
produce, you pay $10 per day to each of the workers who make the mud statues. The
variable cost of producing 48 statues is:
A) $50.
B) $48.
C) $20.
D) $10.
(Table: Taxes, Spending, and Income) Look at the table Taxes, Spending, and Income.
Suppose Governor Meridias decides to initiate a state tax of 5% on all sales. This tax
will be:
A) progressive.

B) proportional.
C) regressive.
D) structural.
(Table: Choice with Uncertainty) Look at the table Choice with Uncertainty. Suppose
the probability that the sitcom does not make it to television is 30%, that it makes it to
television but is not the most viewed show in its time slot is 50%, and that it makes it to
television and is the most viewed show in its time slot is 20%. Given this information,
Norman’s expected income is:
A) $52,500.
B) $47,500.
C) $40,000.
D) $37,500.
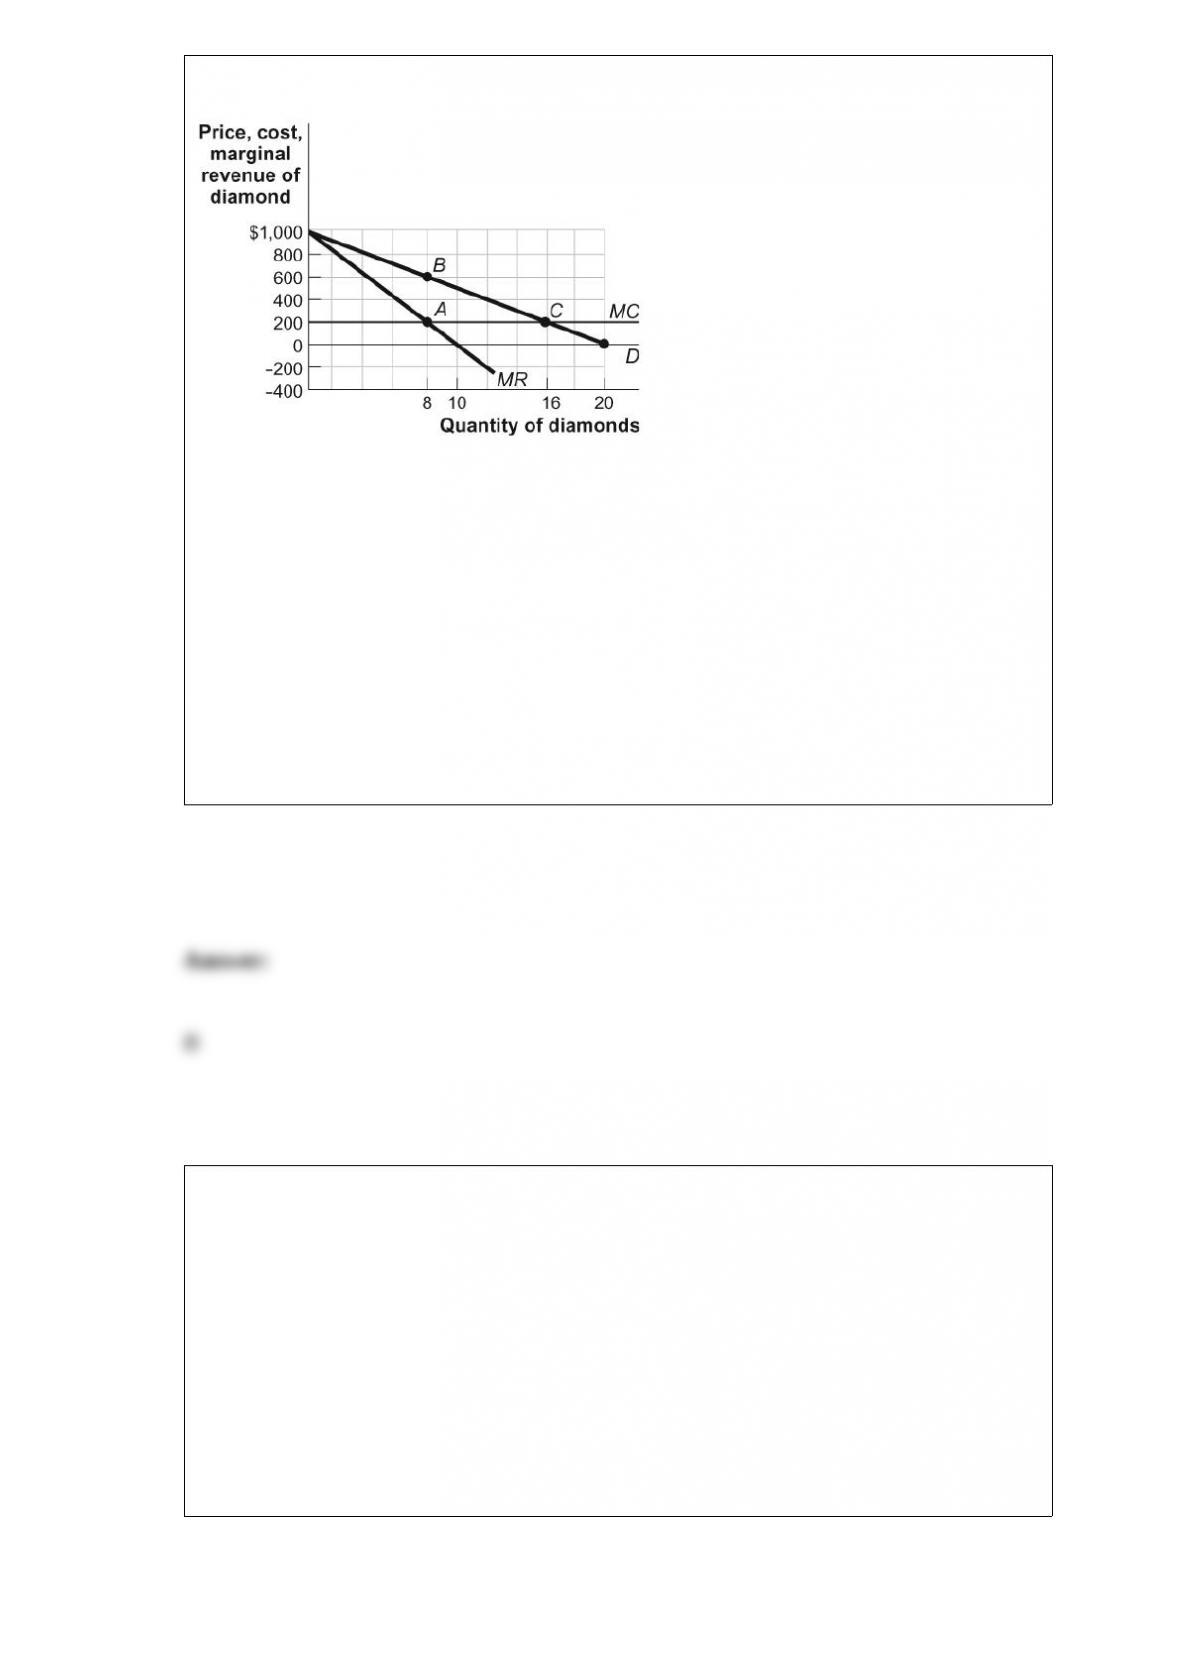
Figure: The Profit-Maximizing Output and Price
(Figure: The Profit-Maximizing Output and Price) Look at the figure The
Profit-Maximizing Output and Price. Assume that there are no fixed costs and AC =
MC = $200. The profit-maximizing output for a monopolist is:
A) 0.
B) 8.
C) 16.
D) 20.
If personal income up to and including $25,000 is not taxed, income of $25,001 to
$50,000 is taxed at 10%, and income over $50,000 is taxed at 20%, then a family
earning an income of $75,000 will pay a MARGINAL tax rate of:
A) 5%.
B) 7.5%.
C) 10%.
D) 20%.
Good X and good Y are related. If the price of good X increases and the demand for
good Y shifts left, these goods are:
A) complements.
B) substitutes.
C) inferior.
D) normal.
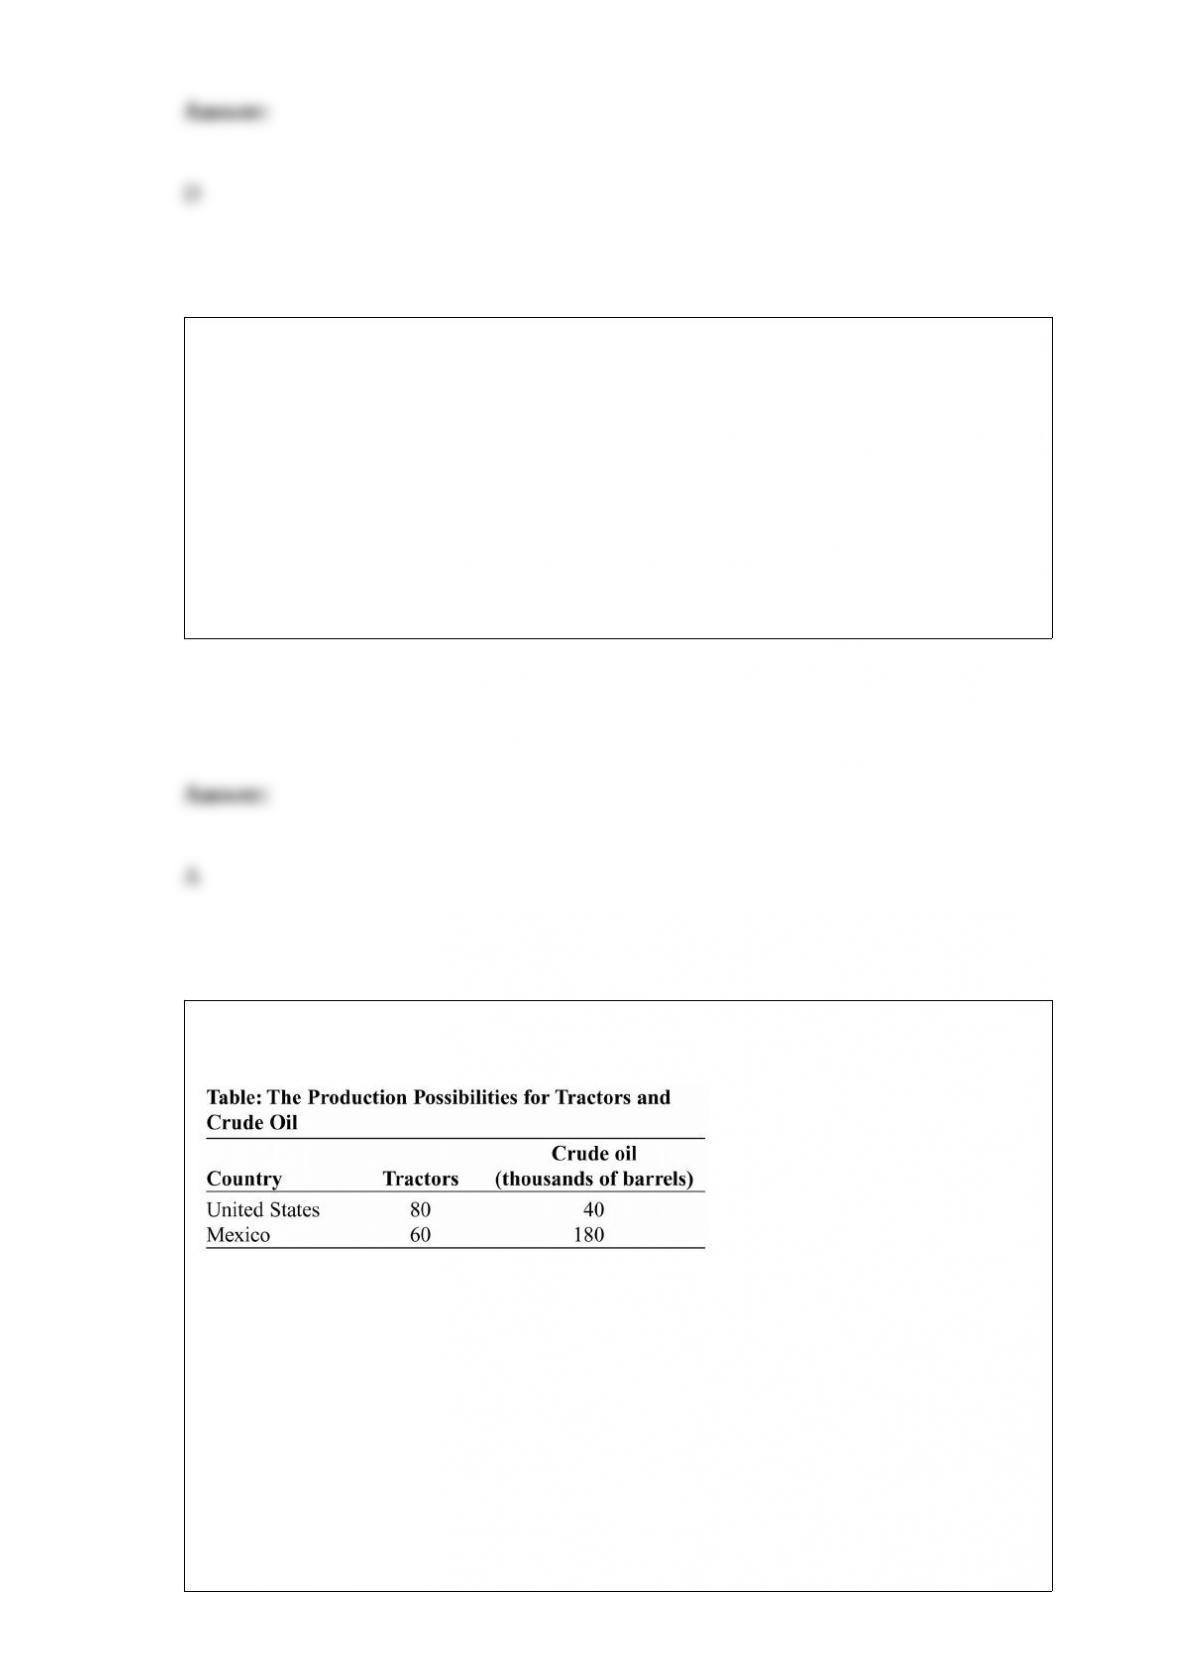
(Table: The Production Possibilities for Tractors and Crude Oil) Look at the table The
Production Possibilities for Tractors and Crude Oil. _____ has (have) an absolute
advantage in producing tractors.
A) The United States
B) Mexico
C) Both the United States and Mexico
D) Neither the United States nor Mexico
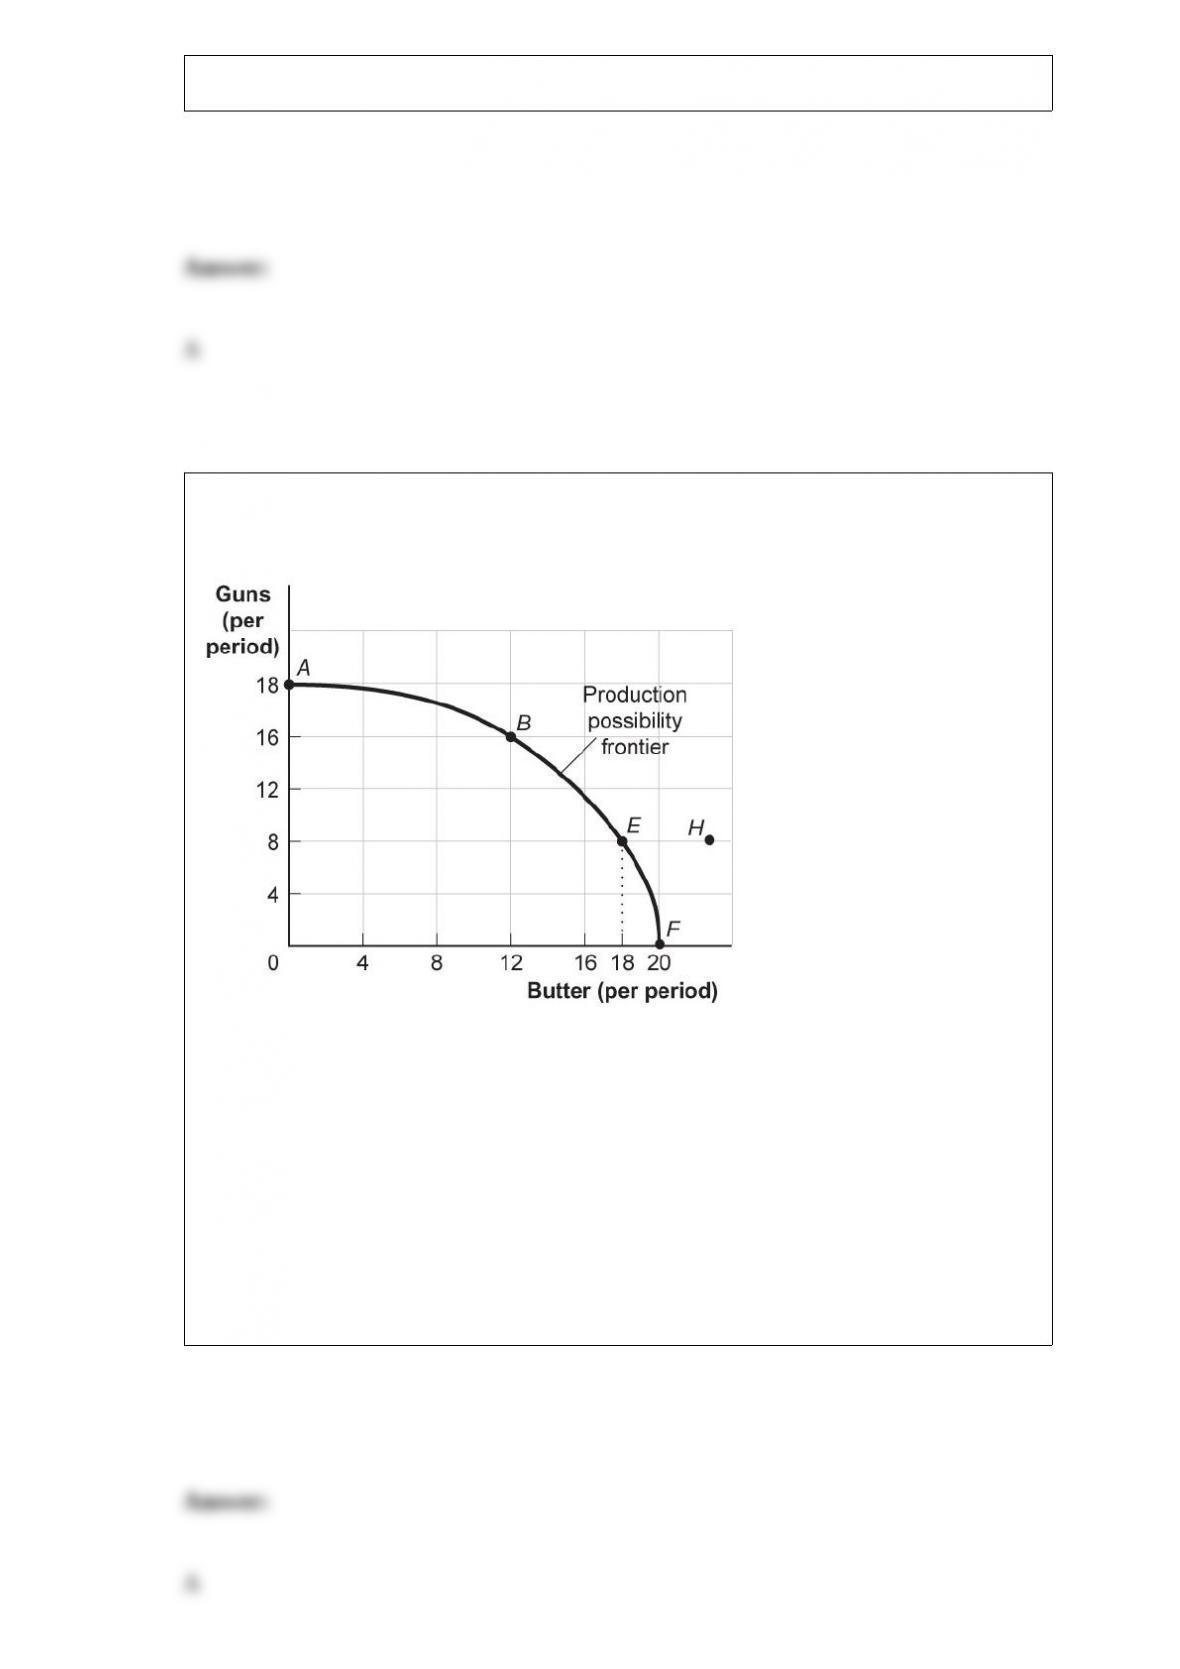
Figure: Guns and Butter
(Figure: Guns and Butter) Look at the figure Guns and Butter. This production
possibility frontier is:
A) bowed out because of increasing opportunity costs.
B) bowed in because of increasing opportunity costs.
C) bowed in because of constant costs of guns and butter.
D) linear because of constant costs.

If the price elasticity of demand is calculated to be 0.75, then demand is:
A) price-inelastic.
B) price-elastic.
C) price unit-elastic.
D) positively sloped.
The student center on campus has burritos, bagels, or burgers for lunch, and they all
cost the same. You decide to have a burger today, but if they were out of burgers, you
would have bought a bagel. Your opportunity cost of buying a burger is your enjoyment
of the:
A) burger.
B) bagel.
C) burrito.
D) bagel and the burrito.
Toby operates a small deli downtown. The deli industry is monopolistically
competitive. If some delis leave the industry, Toby’s _____ curve will shift to the
_____.
A) marginal cost; left
B) marginal cost; right
C) demand; left
D) demand; right

The substitution effect always involves a change in consumption in the _____ direction
as (to) the _____ change.
A) same; budget
B) same; price
C) opposite; price
D) opposite; budget
One way the government of Alaska could prevent an inefficiently large production of
crab fishing would be to:
A) subsidize fishermen to encourage competition.
B) sell exclusive licenses for the right to fish.
C) offer tax breaks for more efficient boats.
D) allow competition from foreign fishermen.

Figure: Rita’s Time Allocation Budget Line
(Figure: Rita’s Time Allocation Budget Line) Look at the figure Rita’s Time Allocation
Budget Line. It is based on 80 hours available for labor and leisure. Her hourly wage is:
A) $5.60.
B) $7.00.
C) $8.00.
D) $10.00.
In the United States, if someone does not have health insurance, it is likely that this
person:
A) is college educated.
B) is a low-income worker whose employer does not provide coverage and who cannot
afford private coverage.
C) is very ill.
D) will not have to worry, since government assistance is available without a means
test.
An excise tax causes inefficiency if the number of transactions in a market is reduced as
a result of the tax. Because the tax discourages mutually beneficial transactions, there is
a(n) _____ from a tax.
A) quota rent
B) deadweight loss
C) increased consumer surplus
D) increased producer surplus
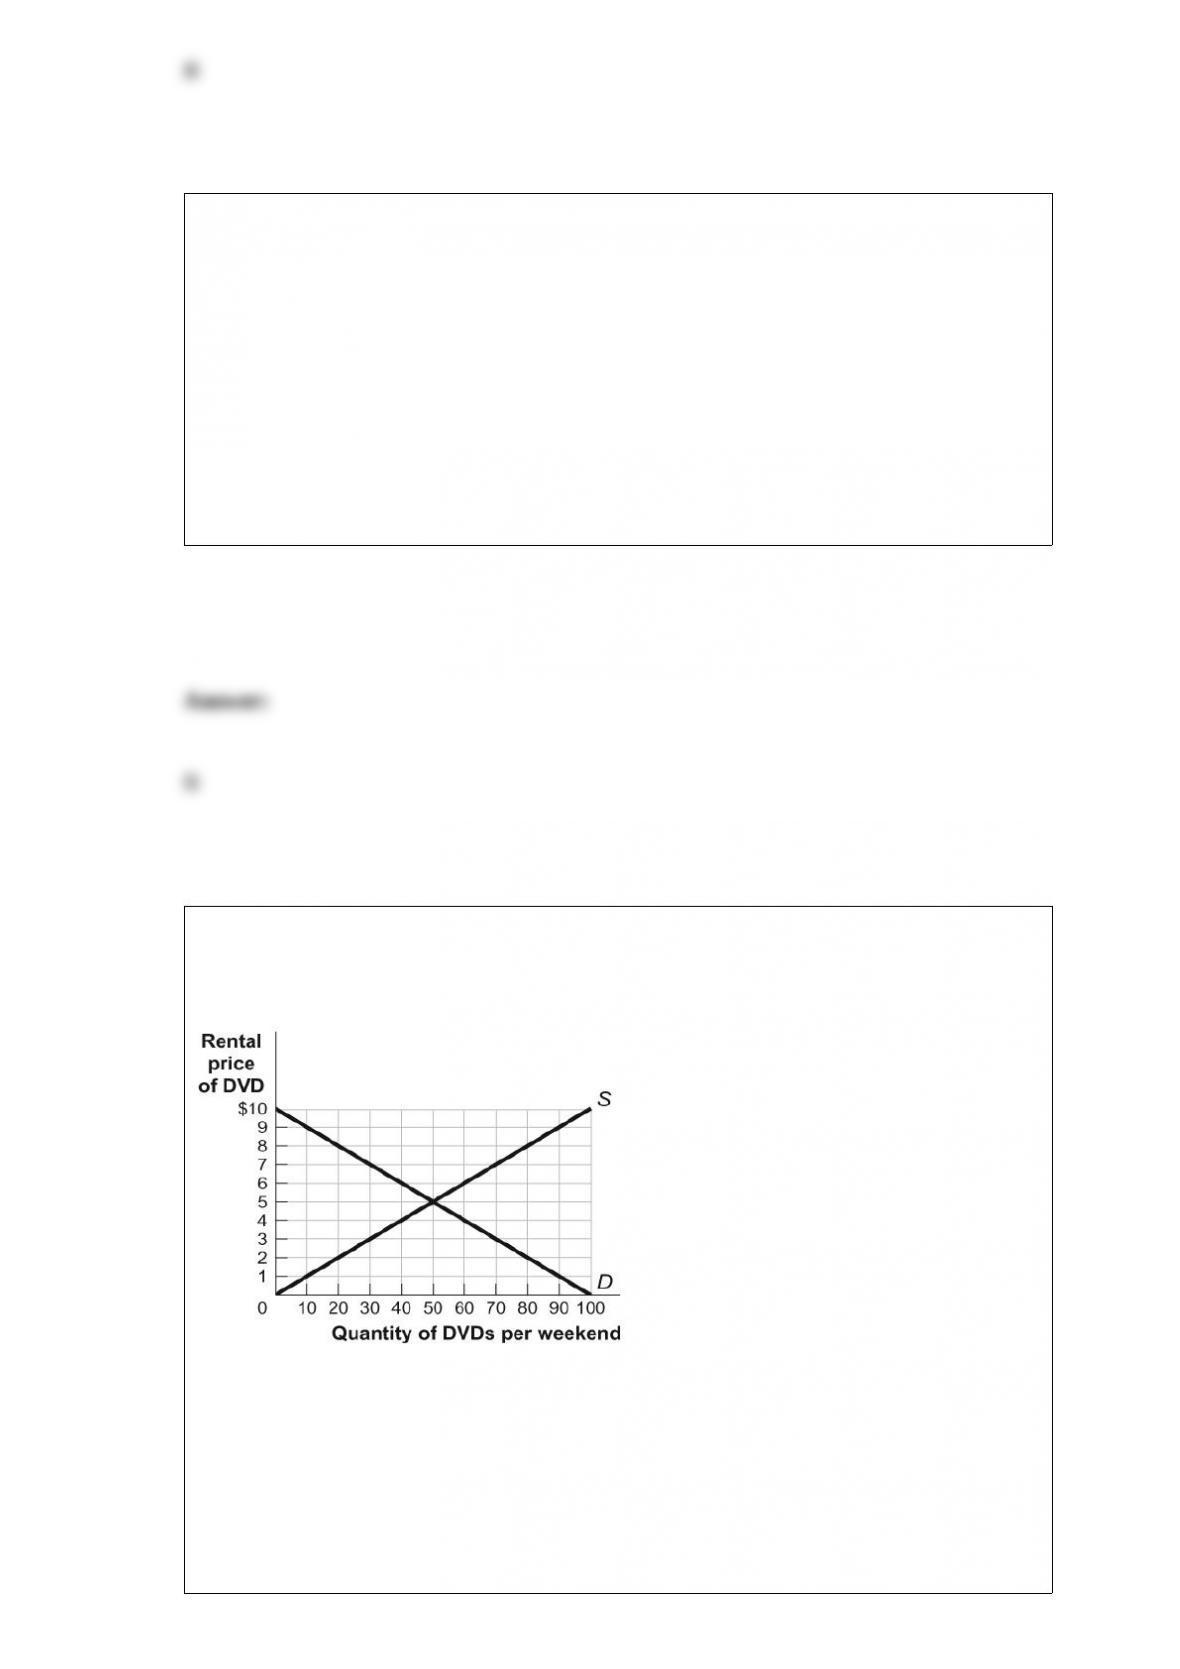
Figure: The DVD Rental Market
(Figure: The DVD Rental Market) Look at the figure The DVD Rental Market. If the
rental price of DVDs rises from $5 to $7:
A) demand will decrease from 50 to 30 rentals per weekend.
B) the quantity demanded will decrease from 50 to 30 rentals per weekend.

C) supply will increase from 50 to 70 rentals per weekend.
D) the quantity supplied will increase from 50 to 60 rentals per weekend.
People in the eastern part of Beirut are prevented by border guards from traveling to the
western part of Beirut to shop for or sell food. This situation violates the perfect
competition assumption of:
A) price-setting behavior.
B) a small number of buyers and sellers.
C) differentiated goods.
D) ease of entry and exit.
Figure: The Indifference Curve Map II
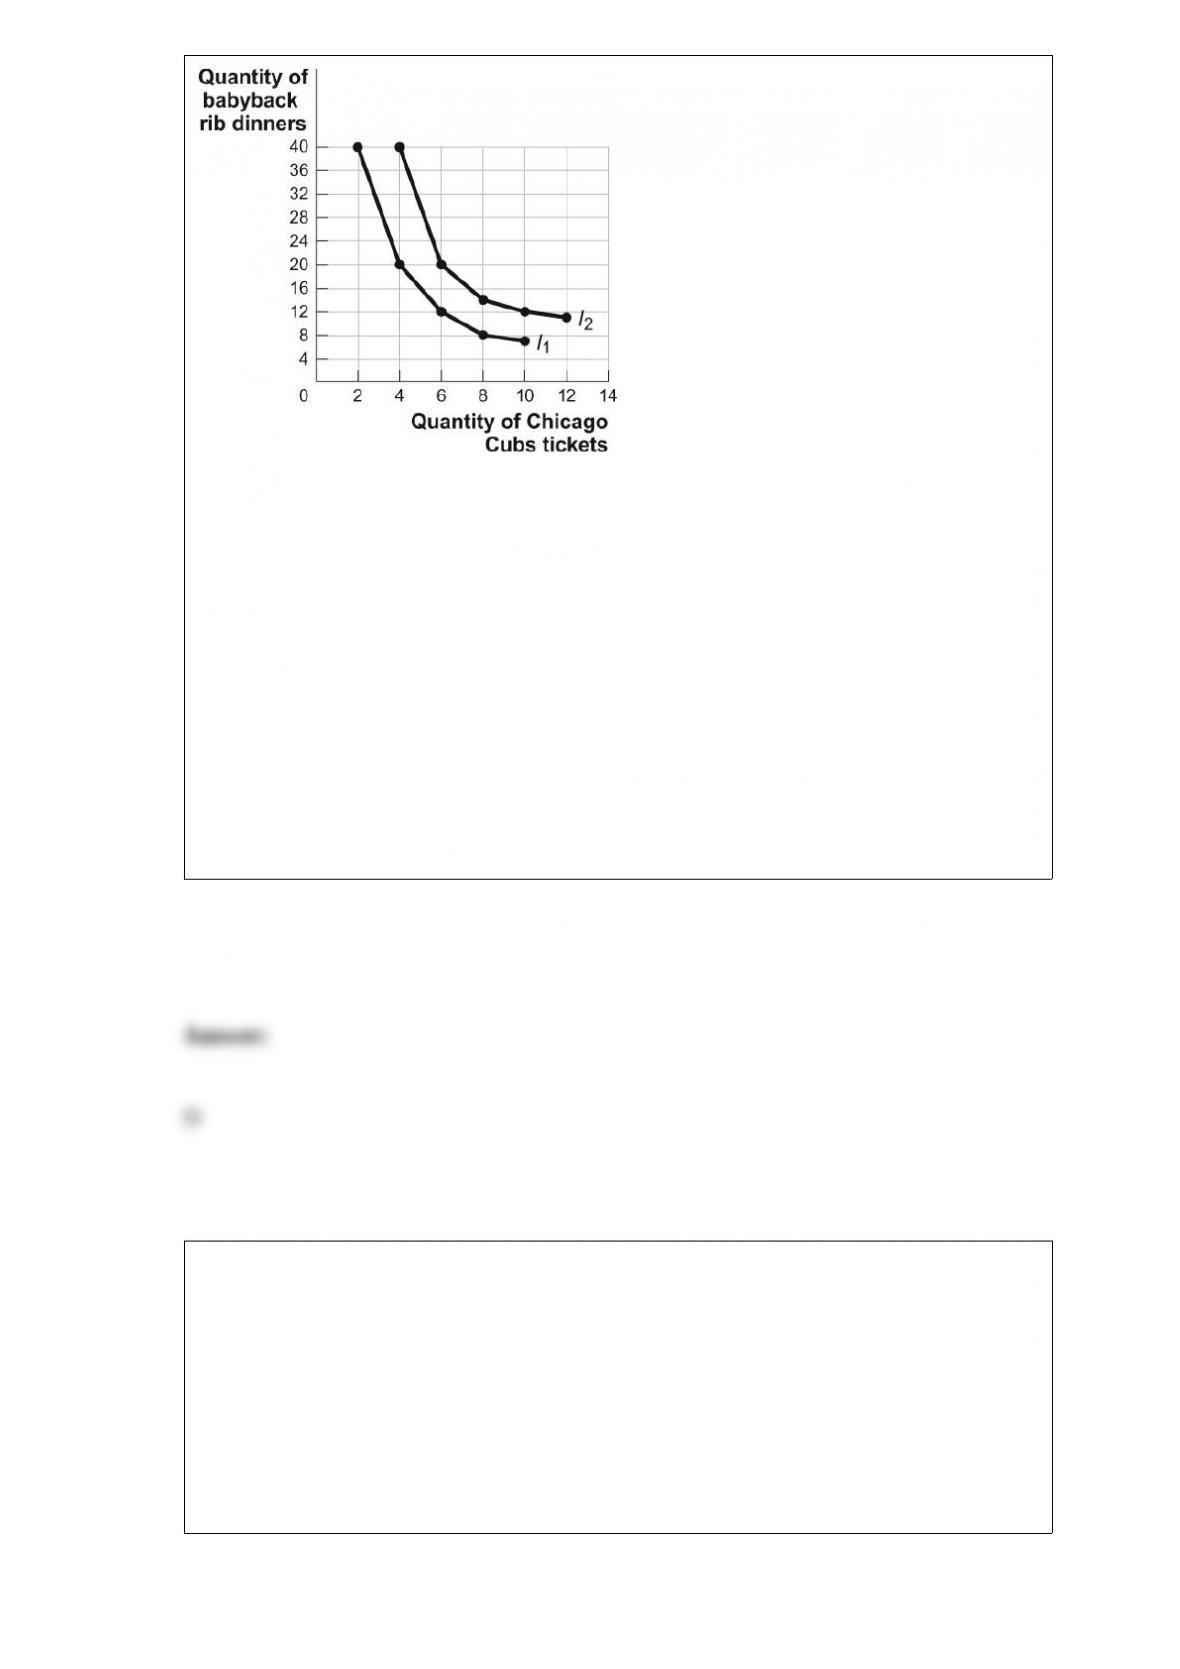
(Figure: The Indifference Curve Map II) Look at the figure The Indifference Curve Map
II. Sara enjoys attending Chicago Cubs baseball games and eating baby back rib
dinners. The figure shows two of her indifference curves for Cubs tickets and baby back
rib dinners. If she consumes 20 baby back rib dinners and 6 tickets to Cubs games, she
would be equally happy to give up 8 dinners for _____ more ticket(s) to Cubs games.
A) 1
B) 0.5
C) 3
D) 4
Which of the following is most likely to shift the supply of milk to the right?
A) a tax on each gallon of milk produced
B) an increase in household income, milk being a normal good
C) a decrease in the price of feed given to dairy cows
D) the bankruptcy of many small dairy farms
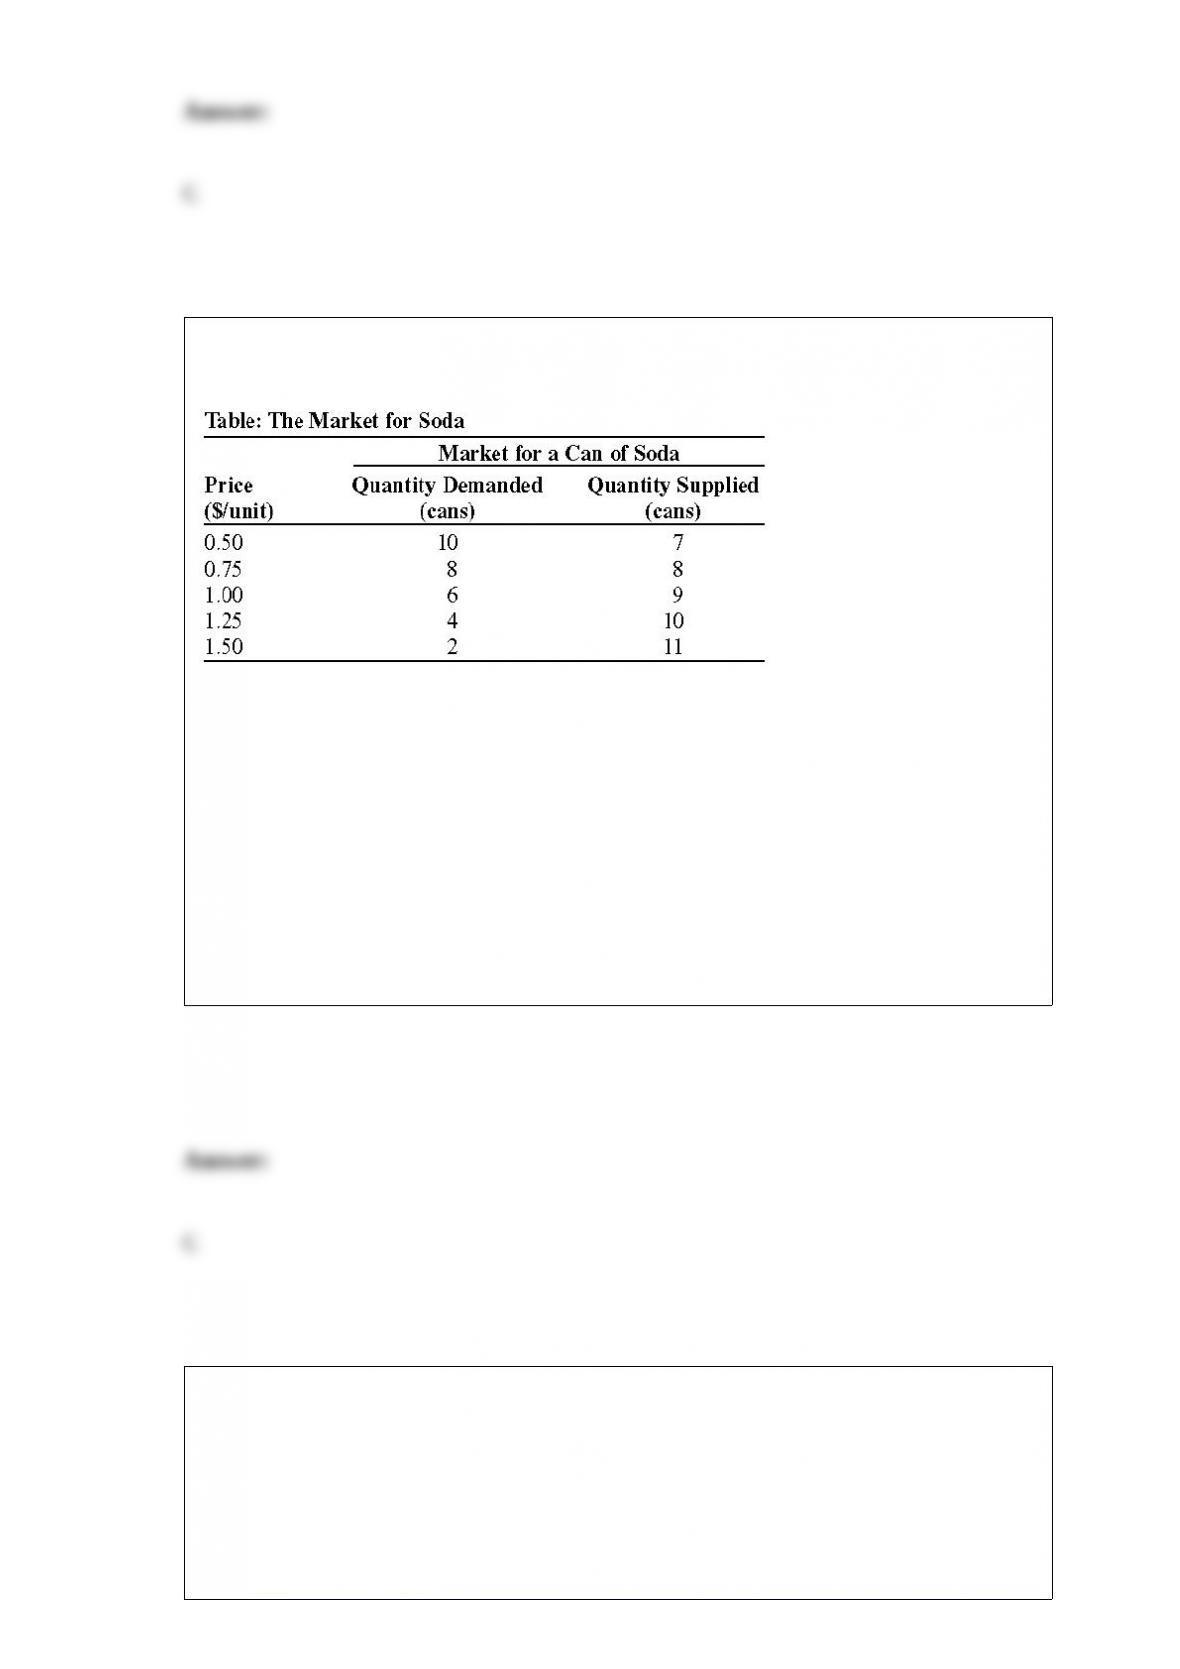
(Table: The Market for Soda) Look at the table The Market for Soda. If the government
imposes a price floor of $1 per can of soda, there will be:
A) a shortage of two cans.
B) a shortage of three cans.
C) a surplus of three cans.
D) equilibrium in the market for soda.
Suppose the equilibrium rent for apartments in Boston is $1,600. If the city of Boston
imposes a price ceiling of $1,200, there will be:
A) an increase in producer surplus for each landlord.
B) a surplus of new apartments in Boston.
C) an increase in consumer surplus for Bostonians who can find apartments for $1,200.
D) an increase in total surplus.
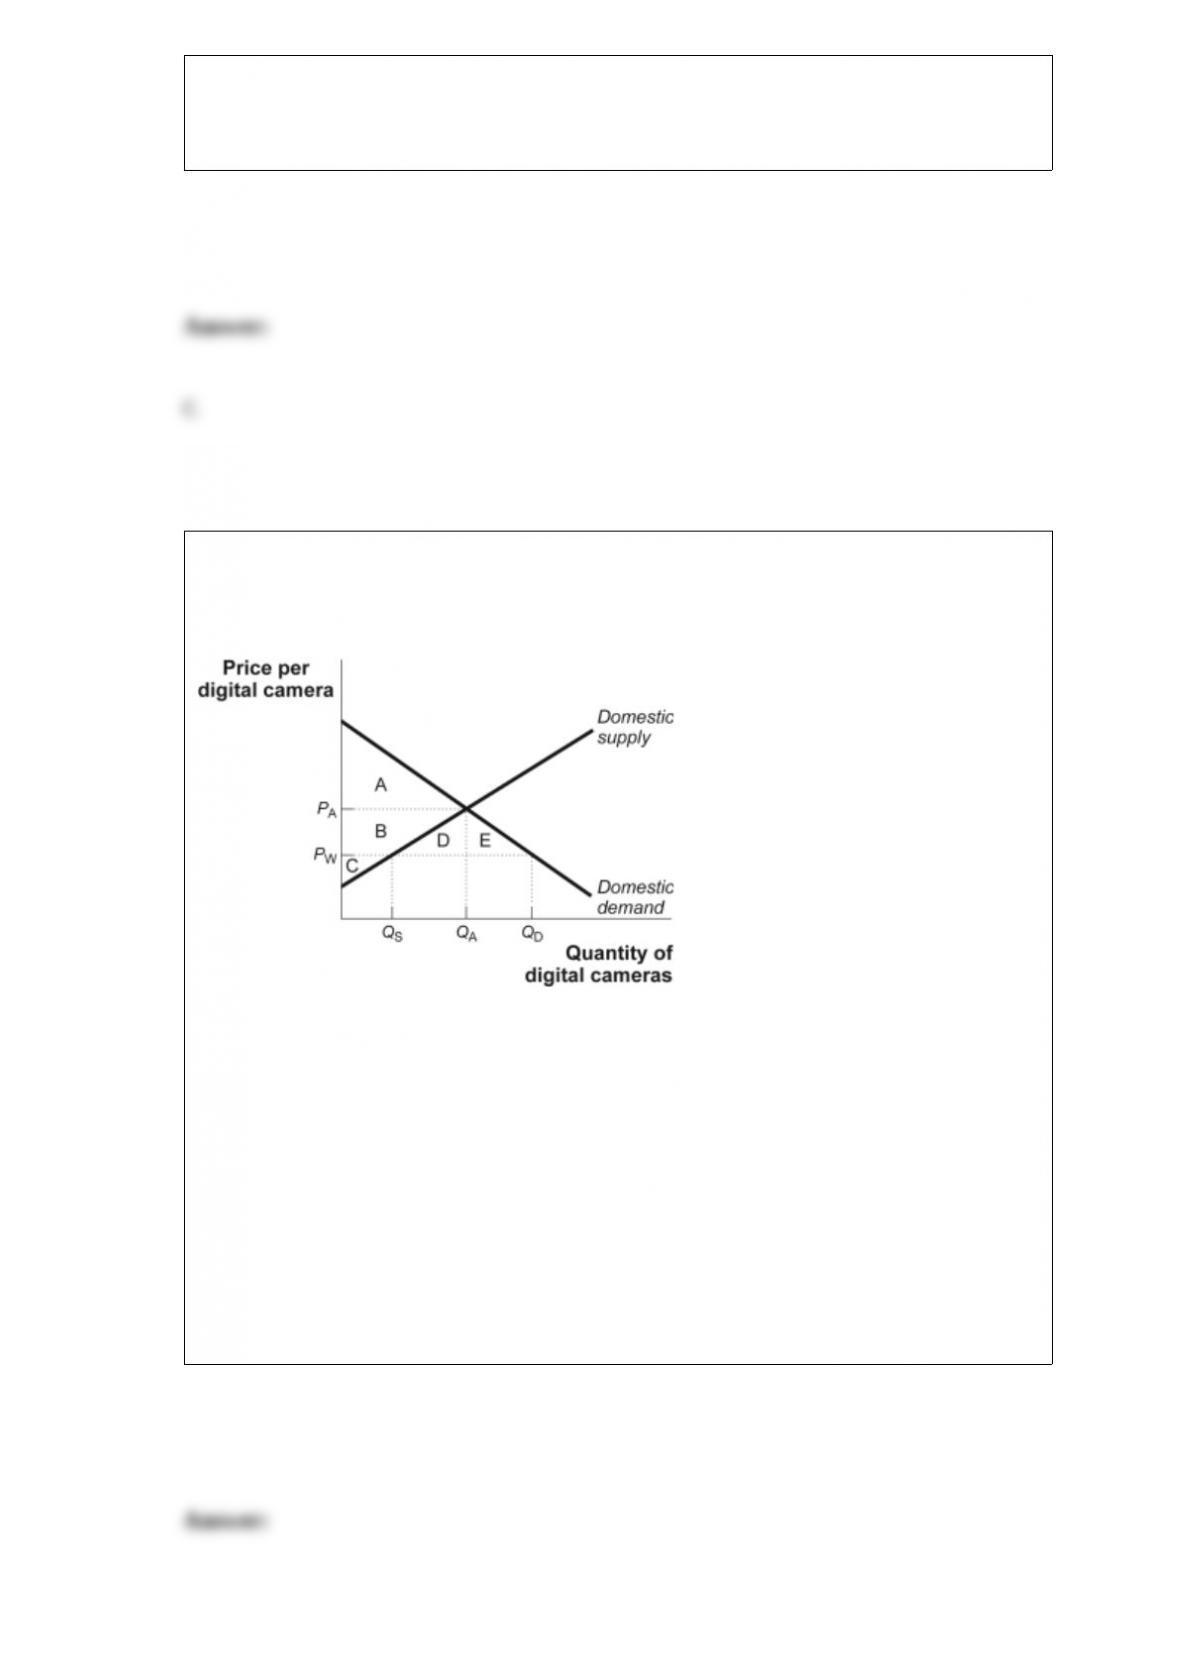
Figure: The Domestic Market for Digital Cameras
(Figure: Domestic Market for Digital Cameras) Look at the figure The Domestic
Market for Digital Cameras. Assume that PA is the autarky price and PW is the world
price. Total surplus after international trade _____ by the area _____.
A) rises; B + D + E
B) falls; C
C) rises; C
D) rises; D + E