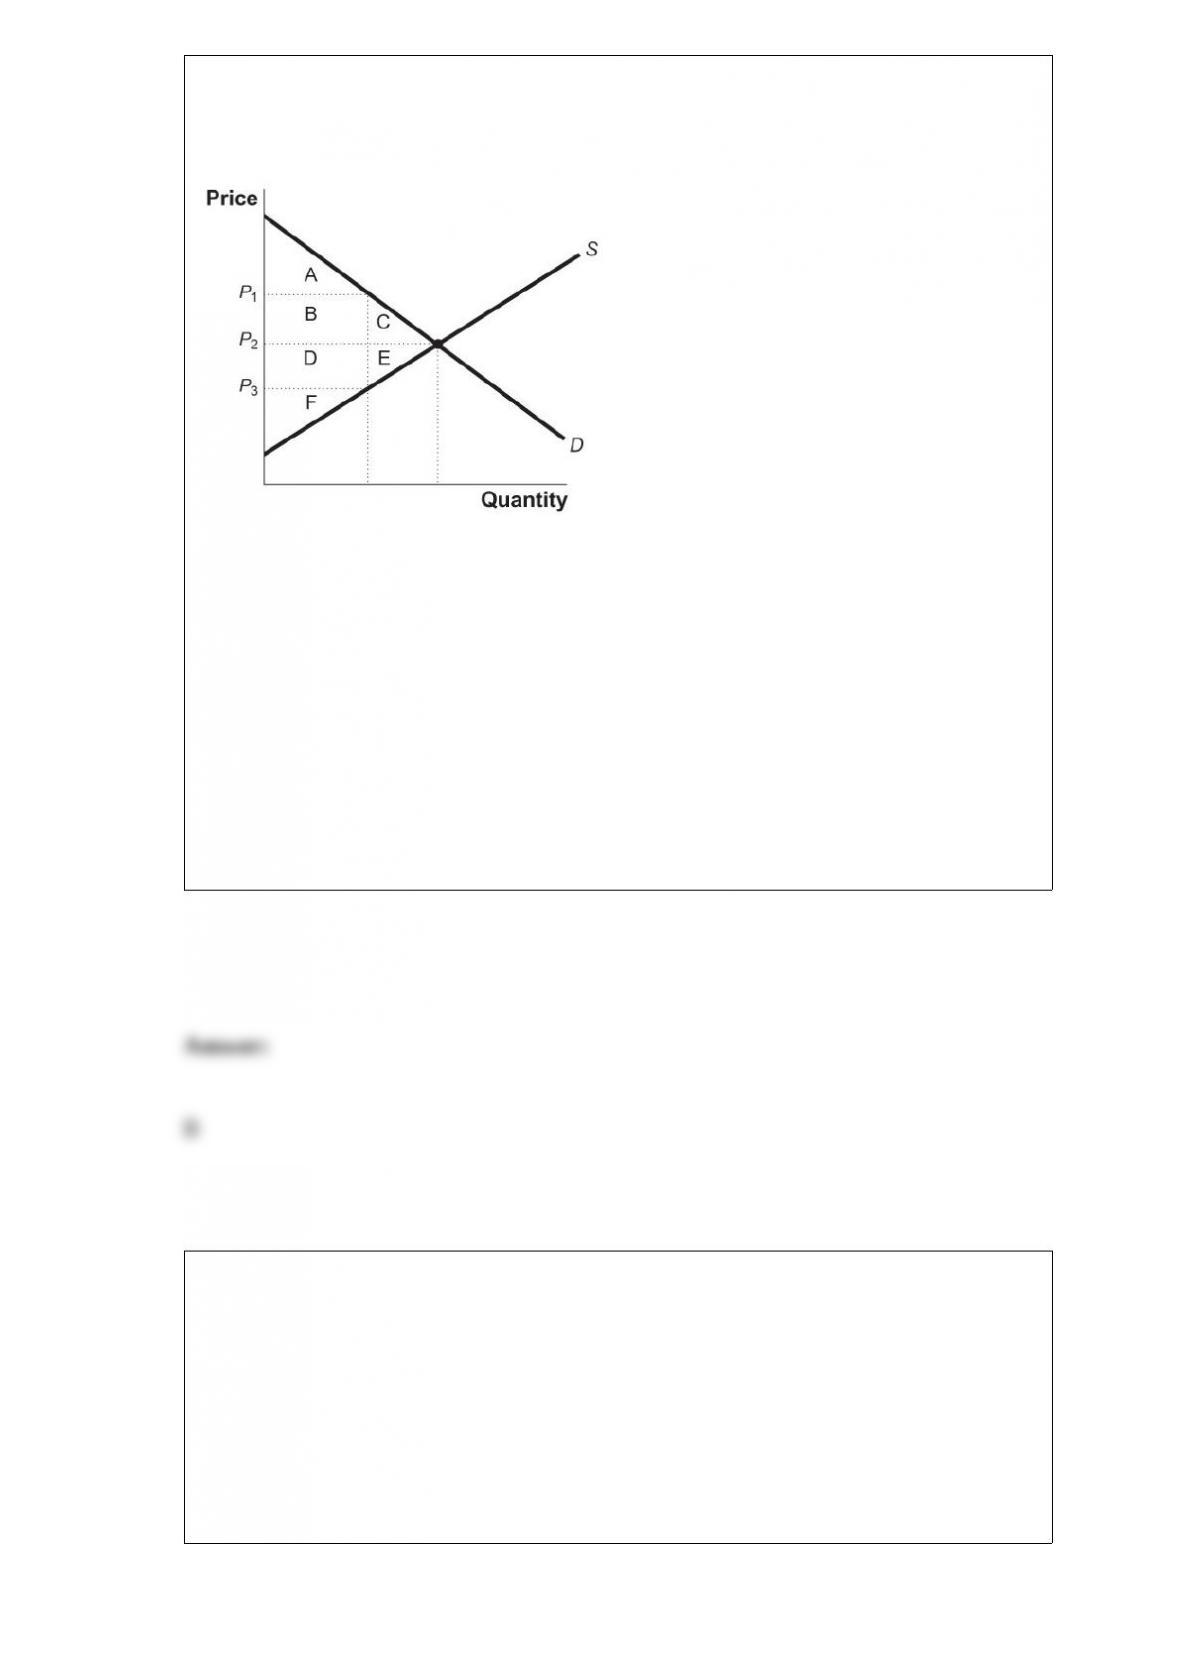
Figure: Gain in Consumer Surplus
(Figure: Gain in Consumer Surplus) Look at the figure Gain in Consumer Surplus.
Identify the area or areas that represent the total change in consumer surplus when the
price falls from P1 to P2.
A) A and B
B) B and C
C) D and E
D) A, B, and C
Insurance companies attempt to minimize adverse selection by:
A) relying on the government to pay for health insurance.
B) screening and employment-based health insurance.
C) relying on the free market to allocate risk efficiently.
D) charging high premiums to young, healthy people.

A firm’s demand curve for labor is:
A) the upward-sloping portion of its value of the marginal product curve.
B) the downward-sloping portion of its marginal product curve.
C) the downward-sloping portion of its value of the marginal product curve.
D) horizontal for the firm in perfect competition.
(Table: Individual Earnings) The table Individual Earnings shows the income of 10
workers.
A) Compute the mean and median income.
B) Draw up a new table that arranges the workers into quintiles from the lowest to the
highest income.
C) Add a column to the table that shows the percentage of total income going to the
workers in each quintile.

In long-run equilibrium in monopolistic competition:
A) price is greater than average total cost.
B) price is equal to average total cost at an output below where average total cost is
minimized.
C) price is equal to average total cost at its minimum.
D) price is equal to average total cost at an output above where average total cost is
minimized.
Table: Price Elasticity
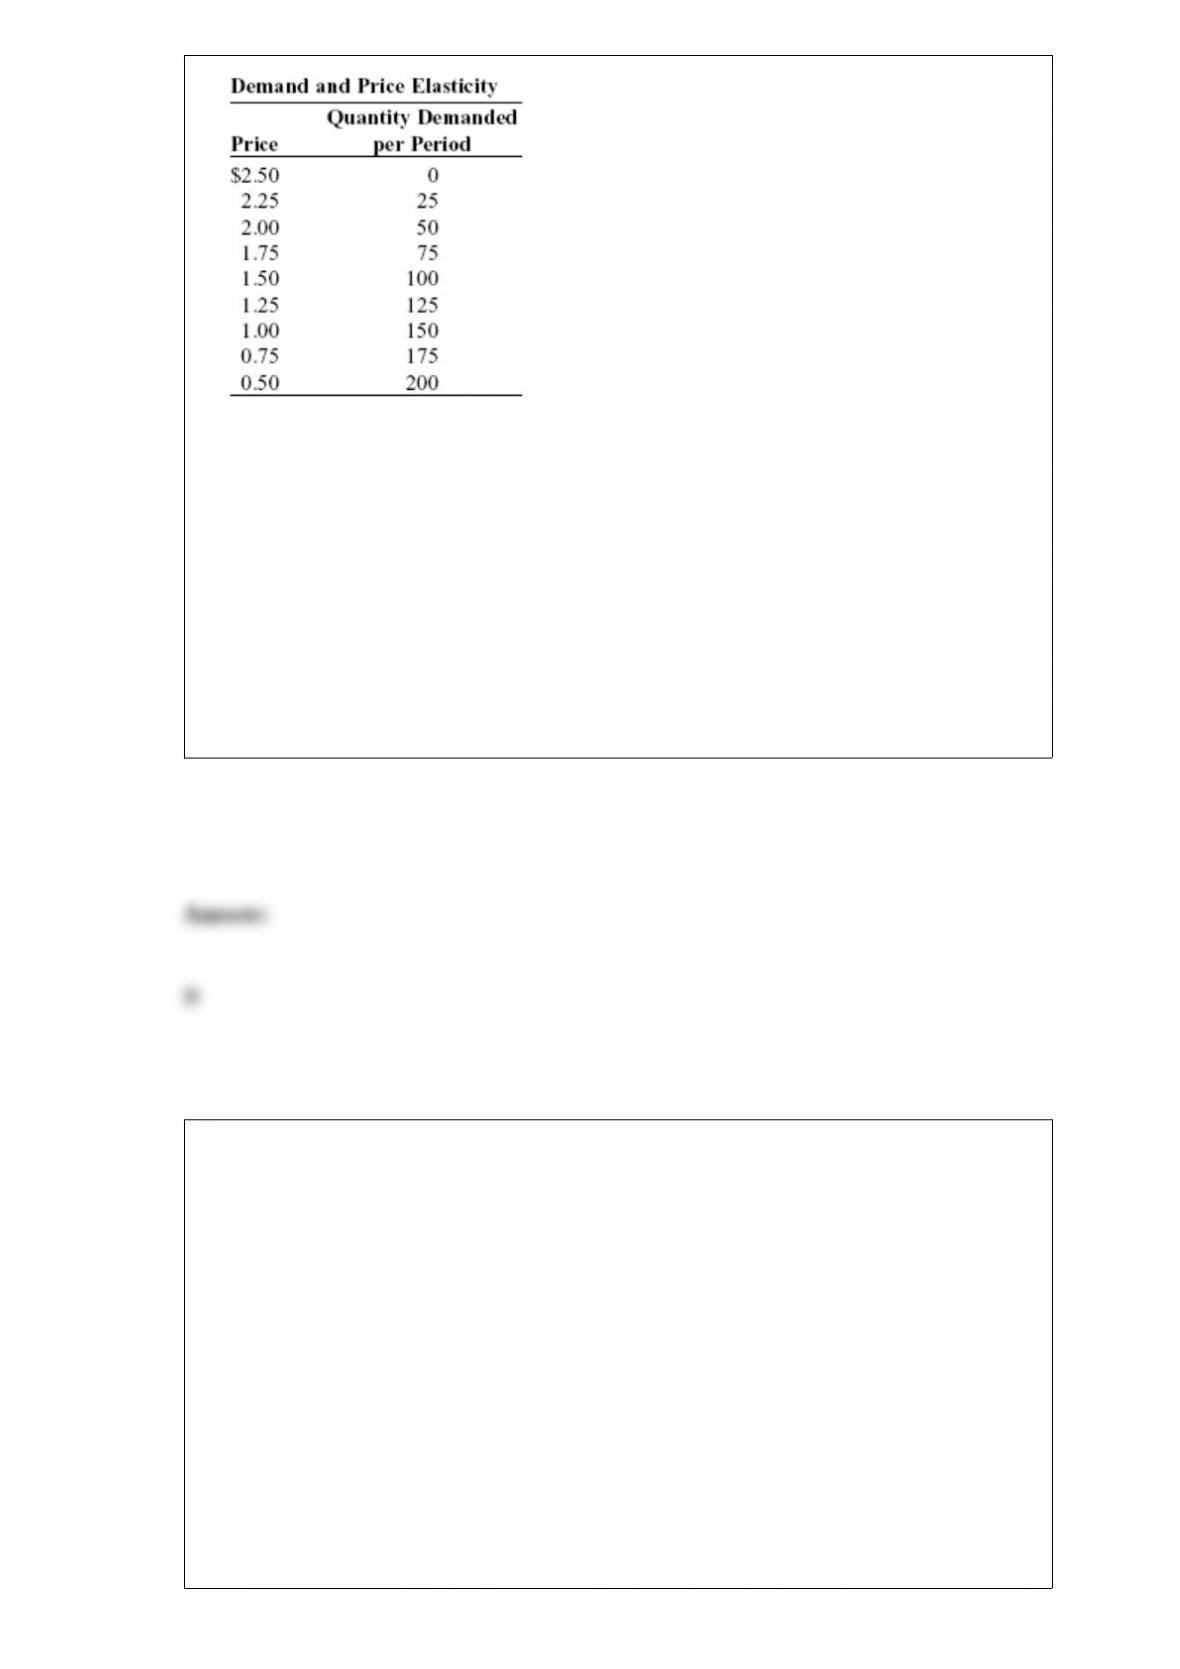
(Table: Price Elasticity) Look at the table Price Elasticity. What is the price elasticity of
demand between $1.25 and $1.00?
A) 0.60
B) 0.82
C) 1.00
D) 1.60
Table: Utility from Oranges and Star Fruit Pounds of Oranges Total Utility from
Oranges Pounds of Star Fruit Total Utility 0 0 0 0 1 24 1 70 2 44 2 130 3 60 3 180 4
72 4 220 5 80 5 250 6 84 6 270 7 84 7 280
(Table: Utility from Oranges and Star Fruit) Look at the table Utility from Oranges and
Star Fruit. Oranges cost $2 per pound and star fruit costs $5 per pound. The table shows
Calvin’s total utility from eating various amounts of oranges and star fruits. If Calvin
has $26, he should eat _____ oranges and _____ pounds of star fruit, and he will have
_____ left over.
Pounds of Oranges Total Utility from Oranges Pounds of Star Fruit Total Utility
0 0 0 0

1 24 1 70
2 44 2 130
3 60 3 180
4 72 4 220
5 80 5 250
6 84 6 270
7 84 7 280
A) no; 5; $1 left over
B) 8; 2; no money
C) 3; 4; no money
D) 4; 5; no money
A scatter diagram shows:
A) how far apart dependent variables are.
B) individual points of data showing both variable values.
C) the slope of a line.
D) the intercept of a curve.

If marginal cost is less than average total cost, then _____ cost is _____.
A) average total; increasing
B) average total; decreasing
C) marginal; necessarily increasing
D) marginal; necessarily decreasing
Assume that a combination of two goods reflects a point of tangency between the
budget line and an indifference curve. In this situation, which of the following is
INCORRECT?
A) Consumer equilibrium has been achieved.
B) All available income has been spent.
C) Utility can be increased by consuming less of both goods.
D) The optimal consumption bundle has been reached.
FICA taxes are considered to be:
A) proportional.

B) progressive.
C) flat.
D) regressive.
When a monopolist practices price discrimination, compared to a single-price
monopolist, consumer surplus will:
A) remain the same.
B) increase.
C) decrease.
D) increase initially, and then return to its original level.
Suppose that each of two prisoners has the independent choice of confessing to a crime
or not confessing to a crime they were both alleged to commit. If neither confesses,
both spend two years in prison; if both confess, both spend three years in prison. If one
confesses and the other does not, the confessor gets off with one year but the other gets
six years. According to game theory, the likely strategy of the prisoners is that:
A) both will confess.
B) neither will confess.

C) one will confess and the other will not.
D) both may or may not confess.
An oligopoly is characterized as an industry in which:
A) there are few firms, each producing a differentiated or similar product.
B) there are many firms, each producing a similar product.
C) all market participants are price takers.
D) only one firm produces a very differentiated product.
Which of the following is an input in the production of croissants?
A) ovens
B) pastry chefs
C) flour
D) dough mixers

To be binding, a price floor must be set:
A) lower than the equilibrium price.
B) higher than the equilibrium price.
C) so that quantity demanded exceeds quantity supplied.
D) lower than the equilibrium price and so that quantity demanded exceeds quantity
supplied.
Trade can be beneficial to an economy because:
A) it results in a more efficient use of the combined resources of some of the trading
countries, even though it reduces efficiency in others.
B) more goods and services can be obtained at lower opportunity cost.
C) it prevents specialization in activities in which countries have a comparative
advantage.
D) it prevents unemployment.

Javon is consuming his optimal utility-maximizing consumption bundle of lobster and
macaroni-and-cheese dinners. Call this bundle A. His income is $100, the price of a
macaroni-and-cheese dinner is $5, and the price of a lobster is $20. Put lobsters on the
vertical axis and put macaroni-and-cheese dinners on the horizontal axis. His income
increases to $500 and the prices of macaroni-and-cheese dinners and lobster remain
constant. With the increase in income, Javon changes his consumption of the two goods
and now maximizes utility at bundle B. If macaroni-and-cheese dinners are an inferior
good for Javon:
A) at bundle B, Javon consumes more macaroni-and-cheese dinners.
B) at bundle B, Javon consumes less lobster.
C) at bundle A and bundle B, the marginal utility of lobster is 5.
D) at bundle B, Javon consumes more lobster.
Gains from trade will result if a country specializes in:
A) all of its goods.
B) the goods in which it has a comparative advantage.
C) goods in which it has an absolute advantage.
D) goods in which it has an absolute and comparative advantage.
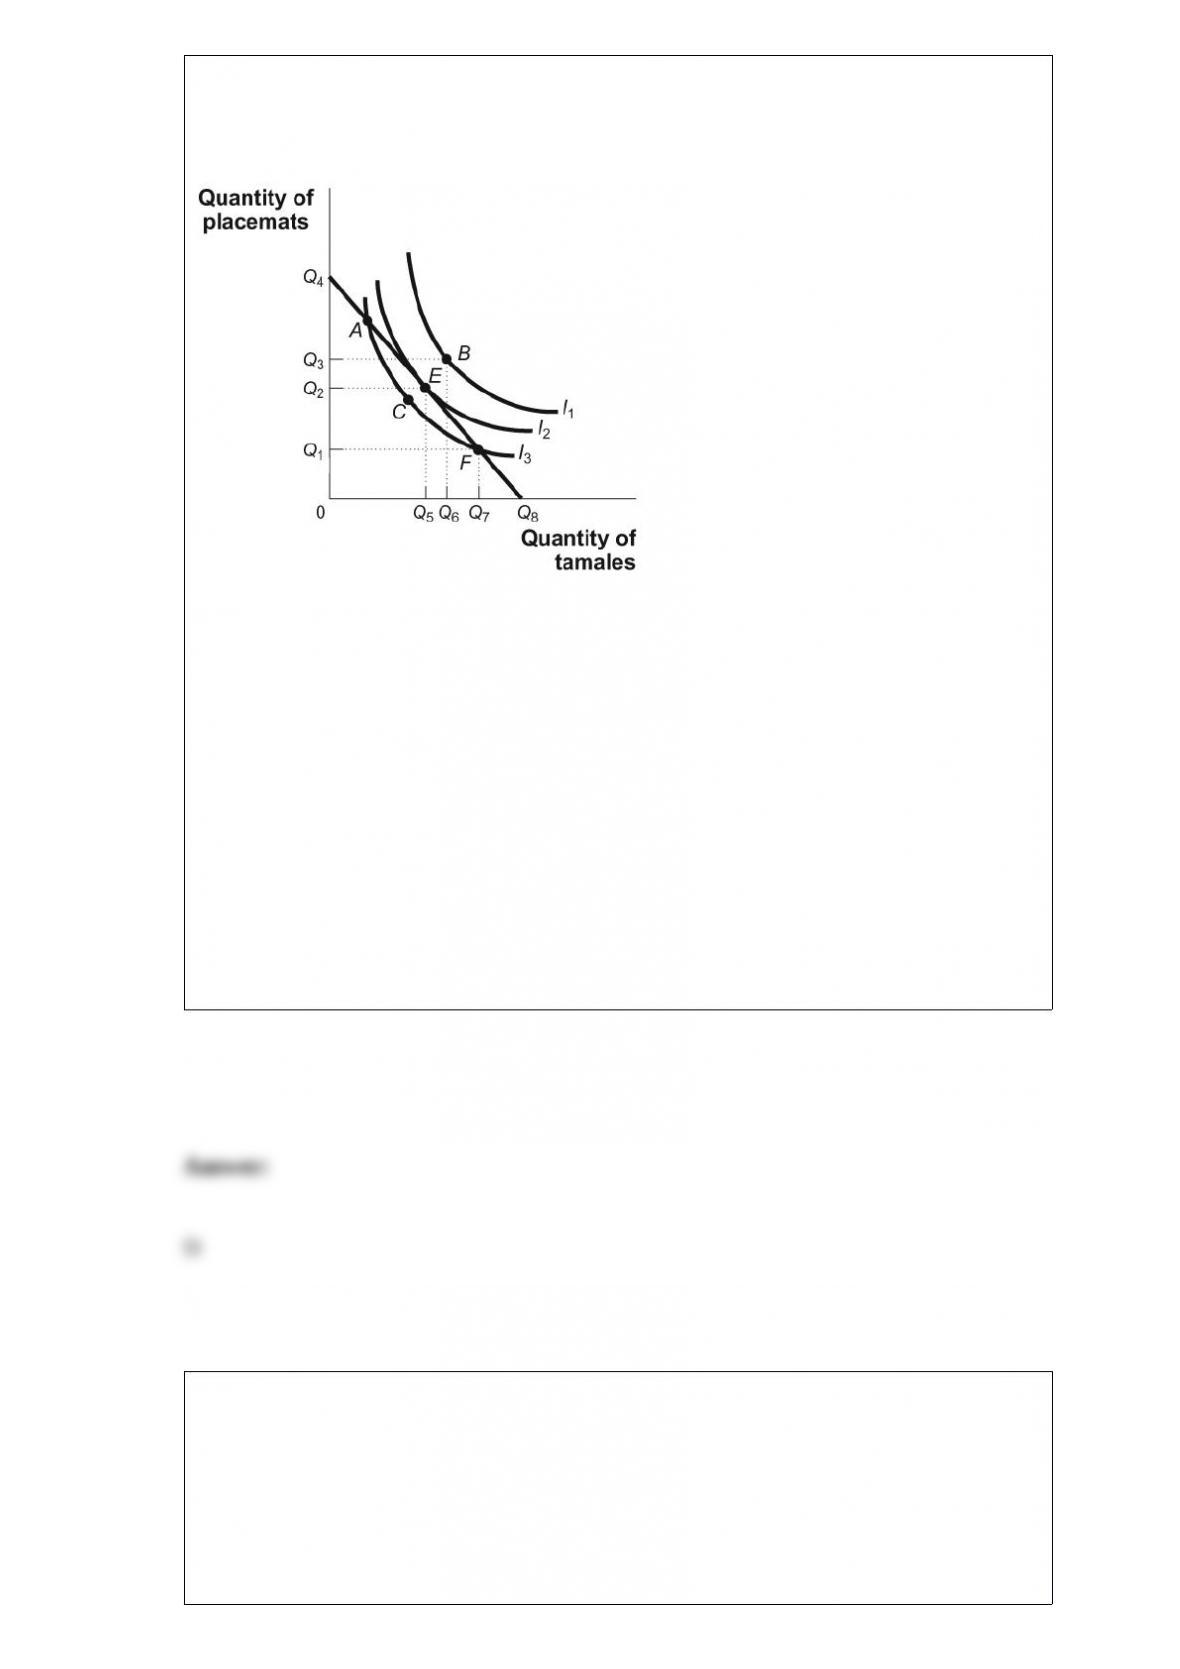
Figure: Consumer Equilibrium III
(Figure: Consumer Equilibrium III) Look at the figure Consumer Equilibrium III.
Given the figure, which of the following statements is TRUE?
A) At the point of utility maximization, the rate at which Kurt is willing to exchange
one good for another is less than the rate at which the goods can be exchanged in the
market.
B) An increase in the prices of tamales and placemats would allow Kurt to attain point
B.
C) At point E, Px = Py.
D) Point E is the point of utility maximization under current budget constraints.
Scenario: Payoff Matrix for Two Firms
The following table provides the payoff matrix for two firms, firm A and firm B. They
are the only two firms in the industry and can either compete or cooperate with each
other, with the following profit results reflecting their actions.
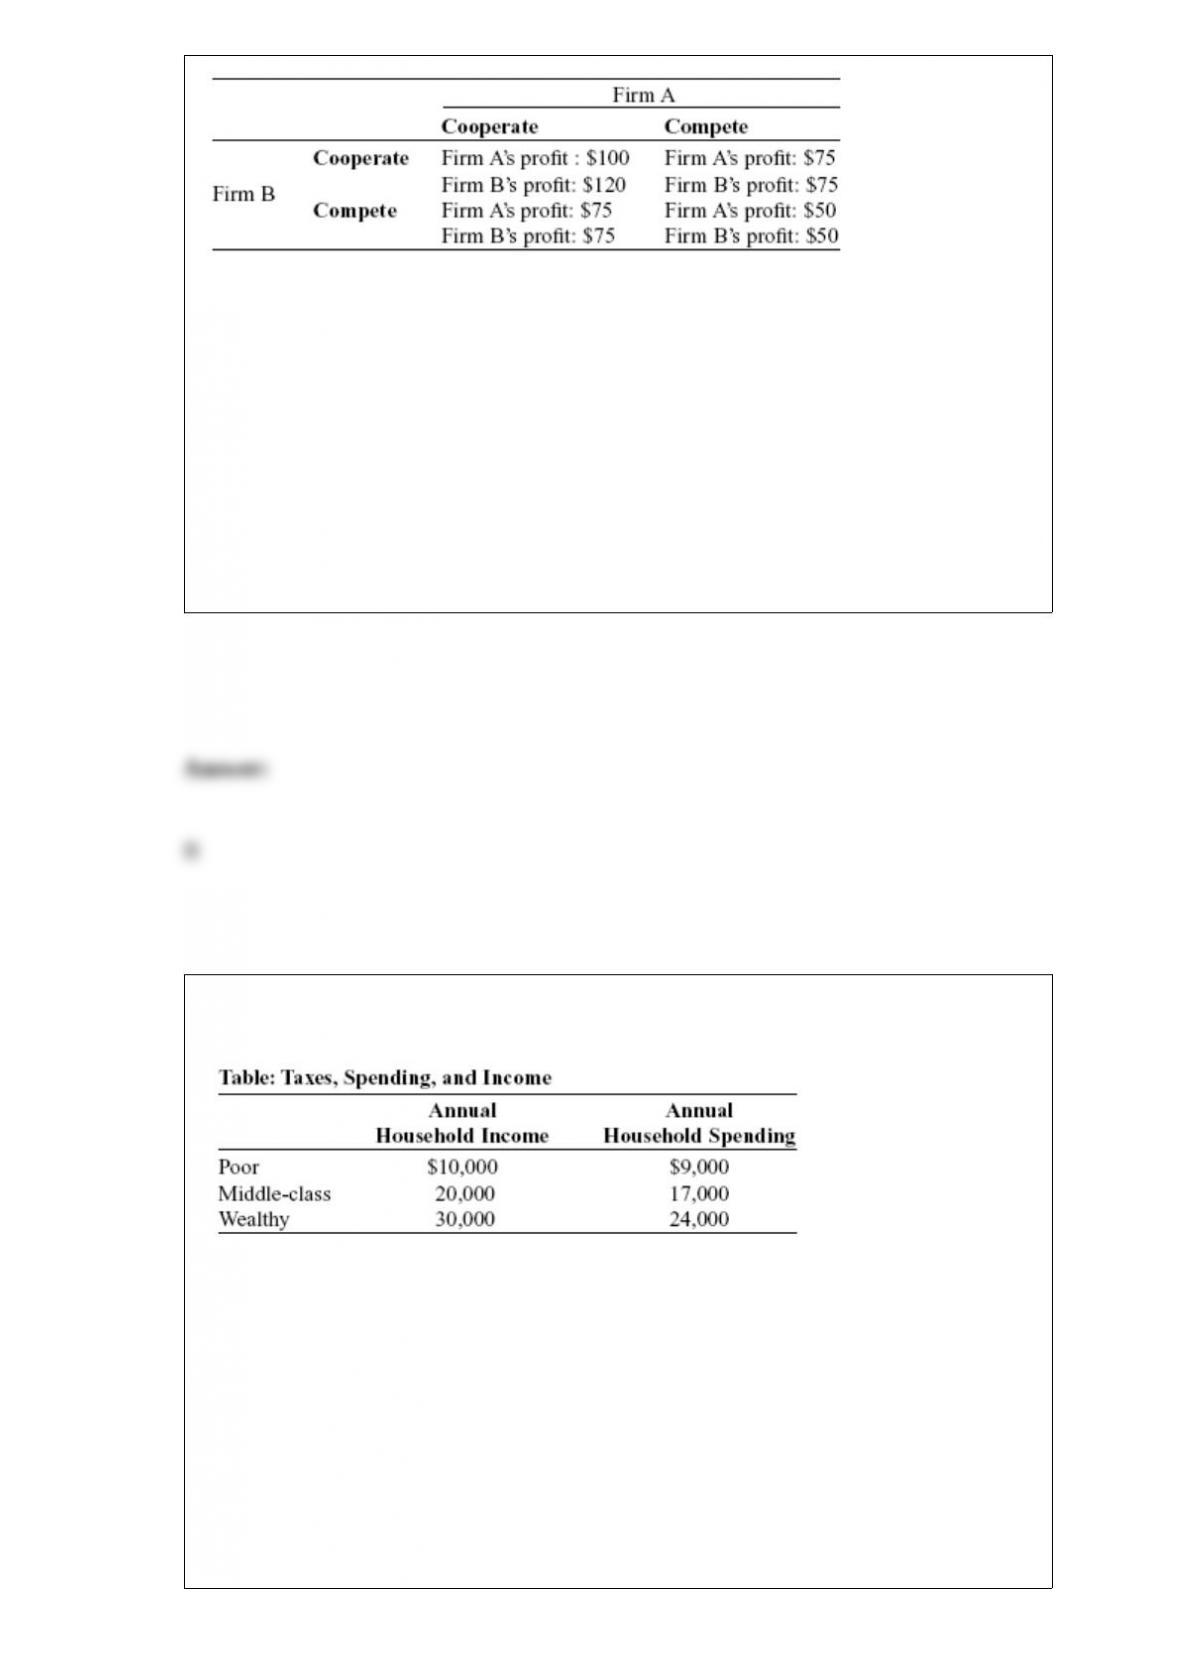
(Scenario: Payoff Matrix for Two Firms) In the scenario Payoff Matrix for Two Firms,
firm B:
A) has a dominant strategy to compete.
B) has a dominant strategy to cooperate.
C) has two dominant strategies.
D) has no dominant strategy.
(Table: Taxes, Spending, and Income) Suppose Governor Meridias decides to initiate a
state income tax. The first $50,000 of household income is tax-free, while any income
above $50,000 is taxed at 10%. The tax rate for a household earning $75,000 is:
A) 10%.
B) 5%.
C) 3.3%.
D) 0%.
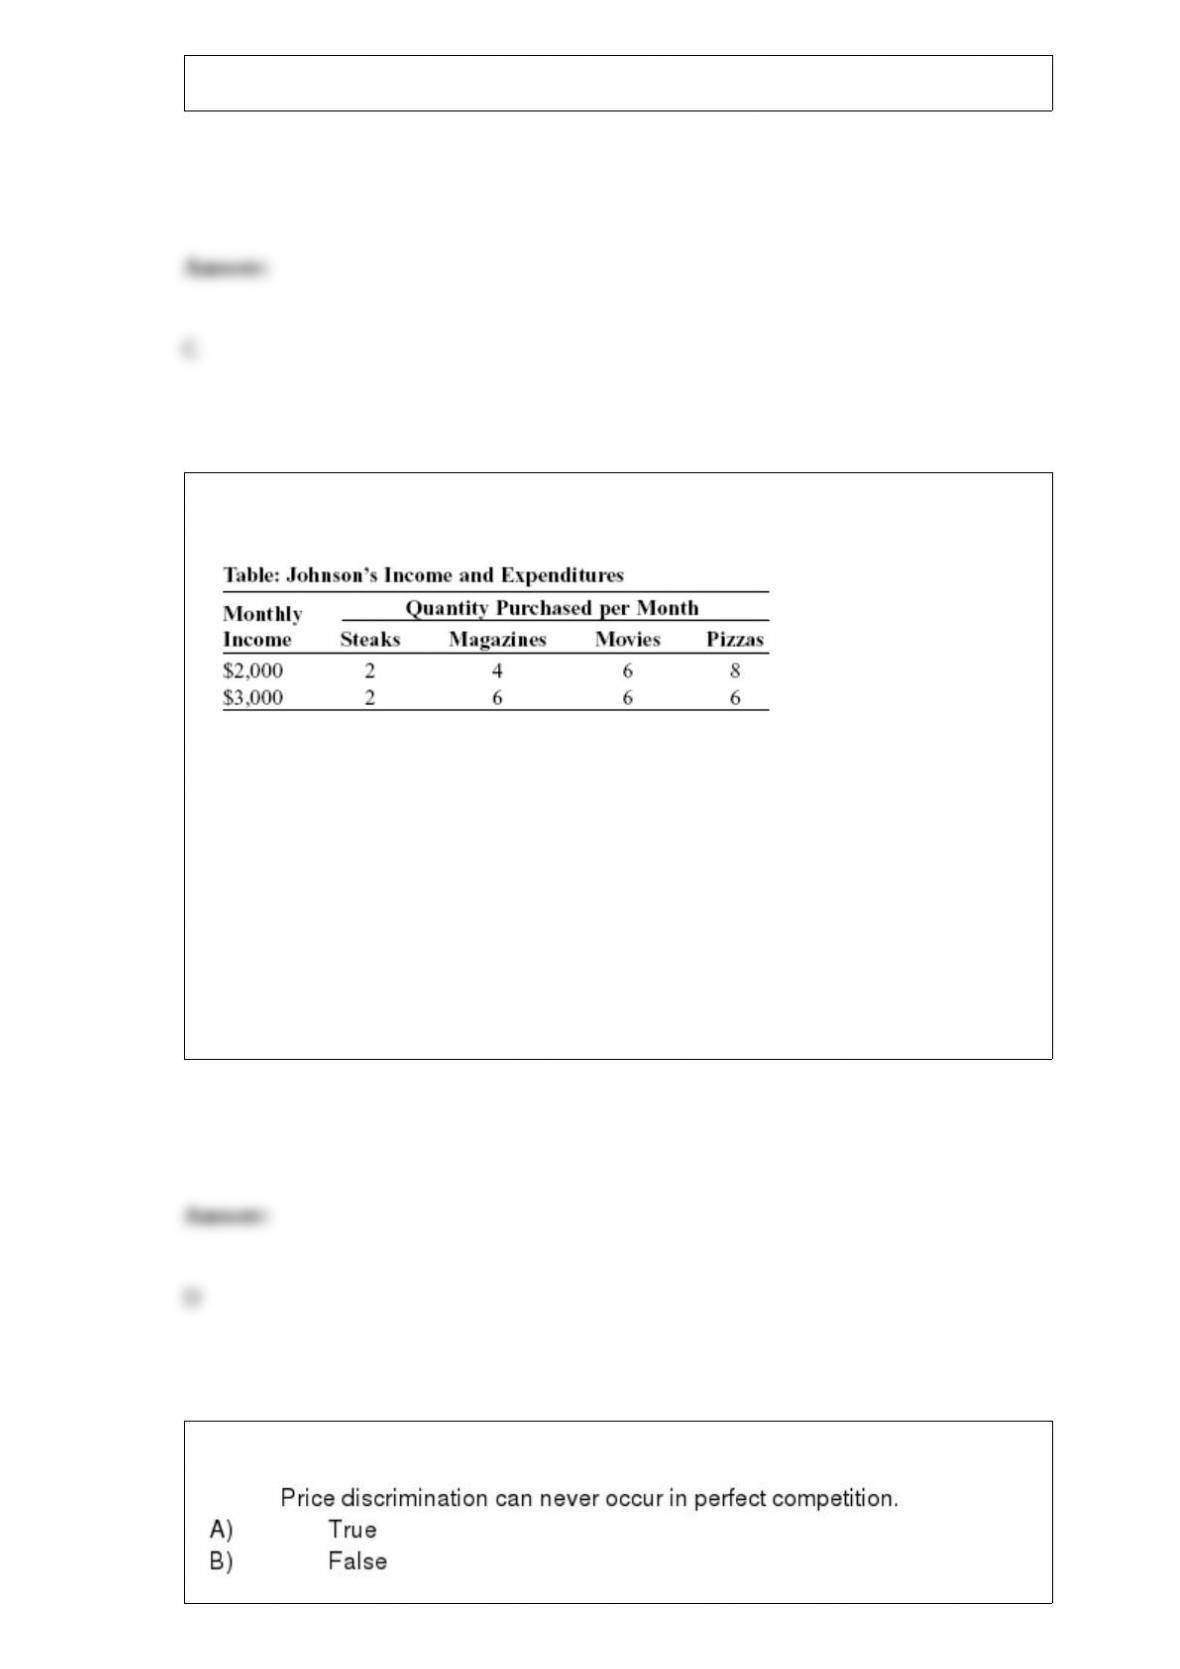
(Table: Johnson’s Income and Expenditures) Look at the table Johnson’s Income and
Expenditures. Johnson’s income elasticity of demand for steaks is:
A) greater than 1.
B) 1.
C) between 0 and 1.
D) 0.
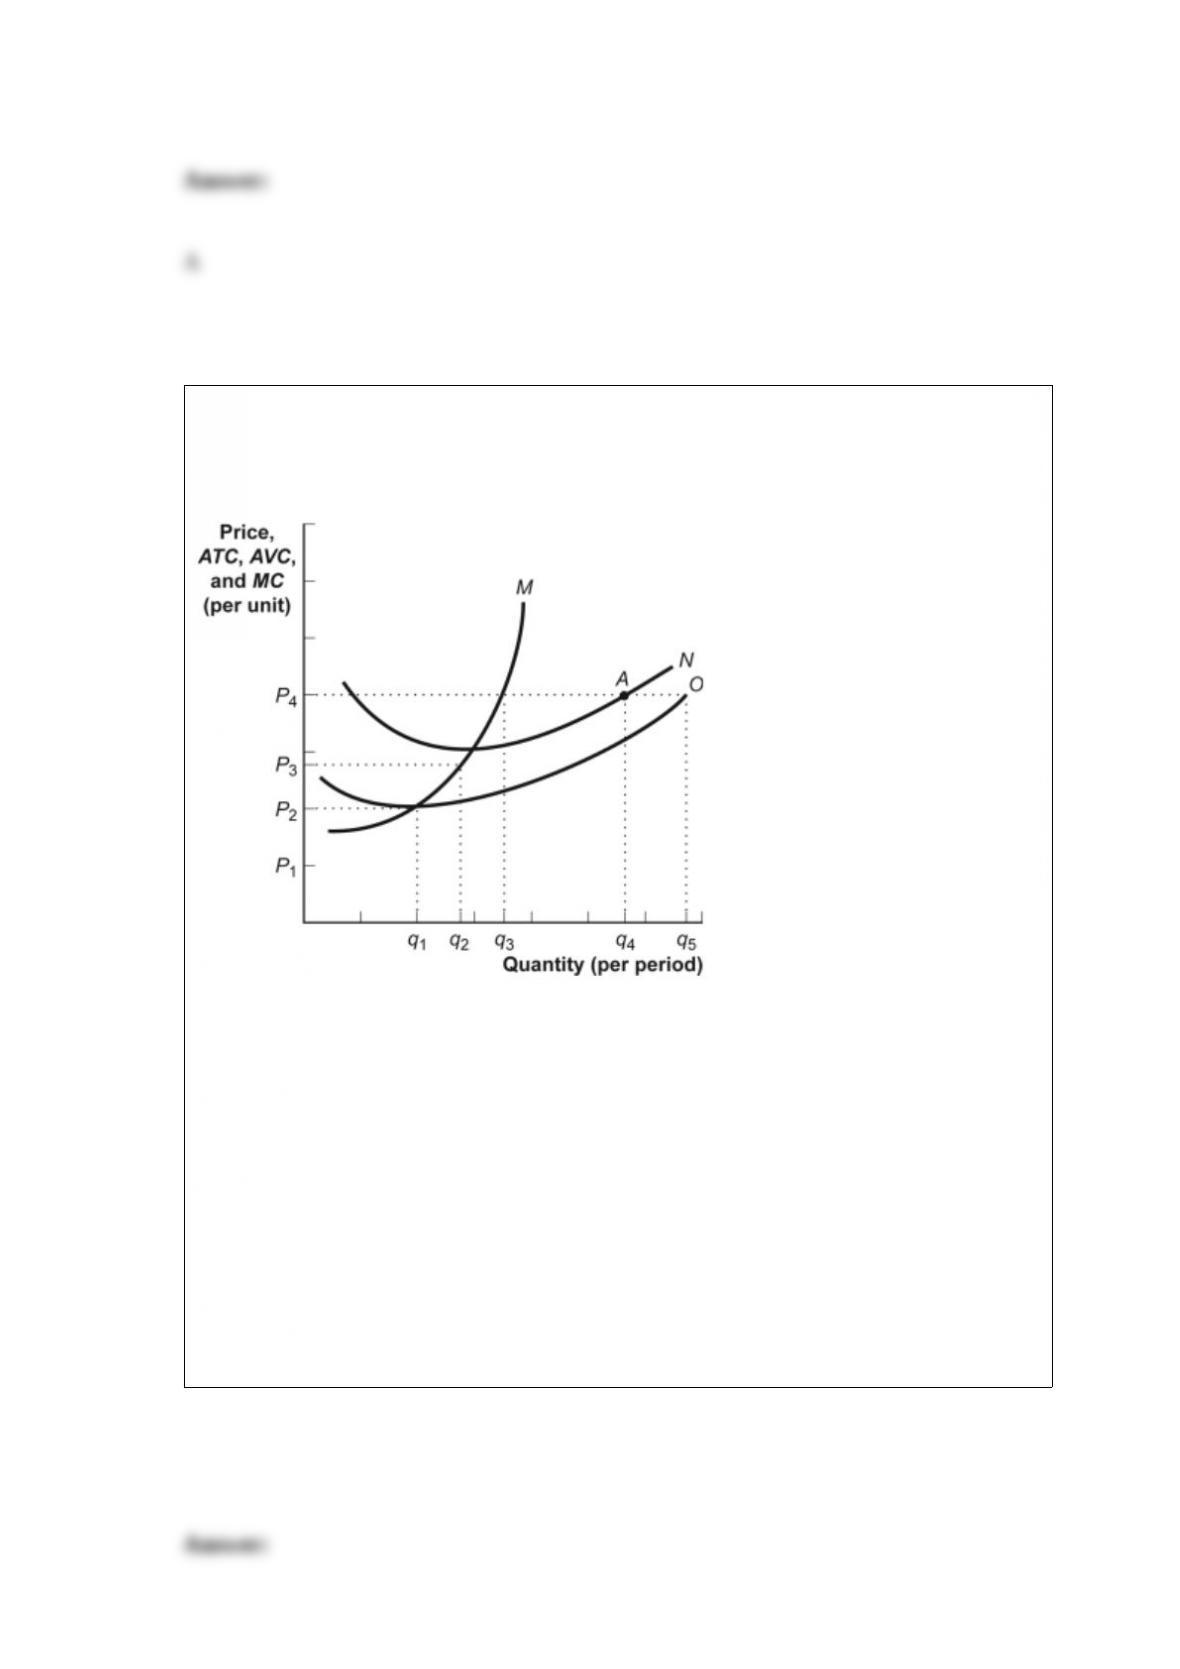
Figure: The Profit-Maximizing Firm in the Short Run
(Figure: The Profit-Maximizing Firm in the Short Run) Look at the figure The
Profit-Maximizing Firm in the Short Run. If the market price is P3, the firm will
produce quantity _____ and _____ in the short run.
A) q2; make a profit
B) q1; break even
C) q2; incur a loss
D) q4; incur a loss
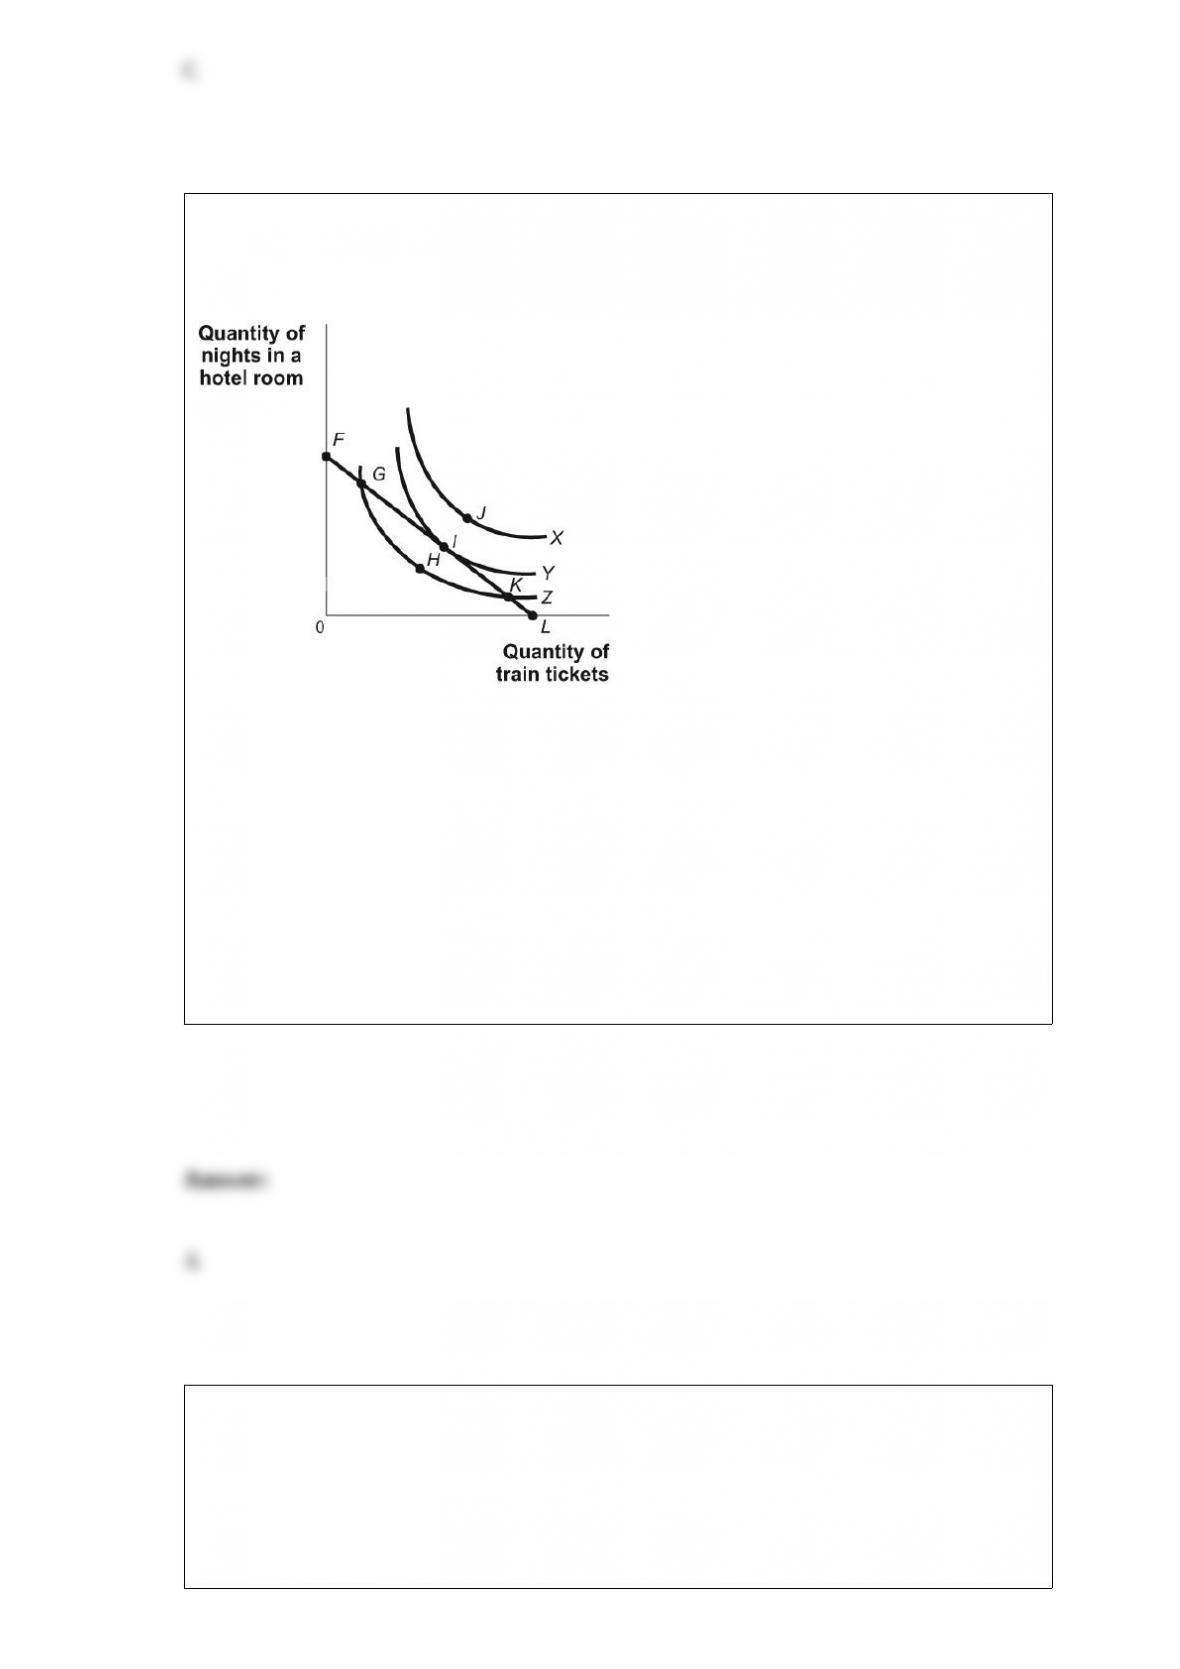
Figure: Consumer Equilibrium IV
(Figure: Consumer Equilibrium IV) Look at the figure Consumer Equilibrium IV. The
highest level of utility shown in the figure is associated with indifference curve:
A) X.
B) Y.
C) Z.
D) Y or Z.
If the median household income in 2010 was $49,445:
A) the average income for a U.S. household was $49,445.
B) poverty rates fell during this period.

C) half of the households in the United States earned less than $49,445, and half earned
more than $49,445.
D) incomes in the United States were rising.
(Table: Workers and Output) Look at the table Workers and Output. After graduation
you achieve your dream of opening an art shop that specializes in selling mud statues.
You pay $10 per day on a loan from your uncle, and regardless of how much you
produce, you pay $10 per day to each of the workers who make the mud statues. The
fixed cost of producing 25 statues is:
A) $10.
B) $20.
C) $25.
D) $35.
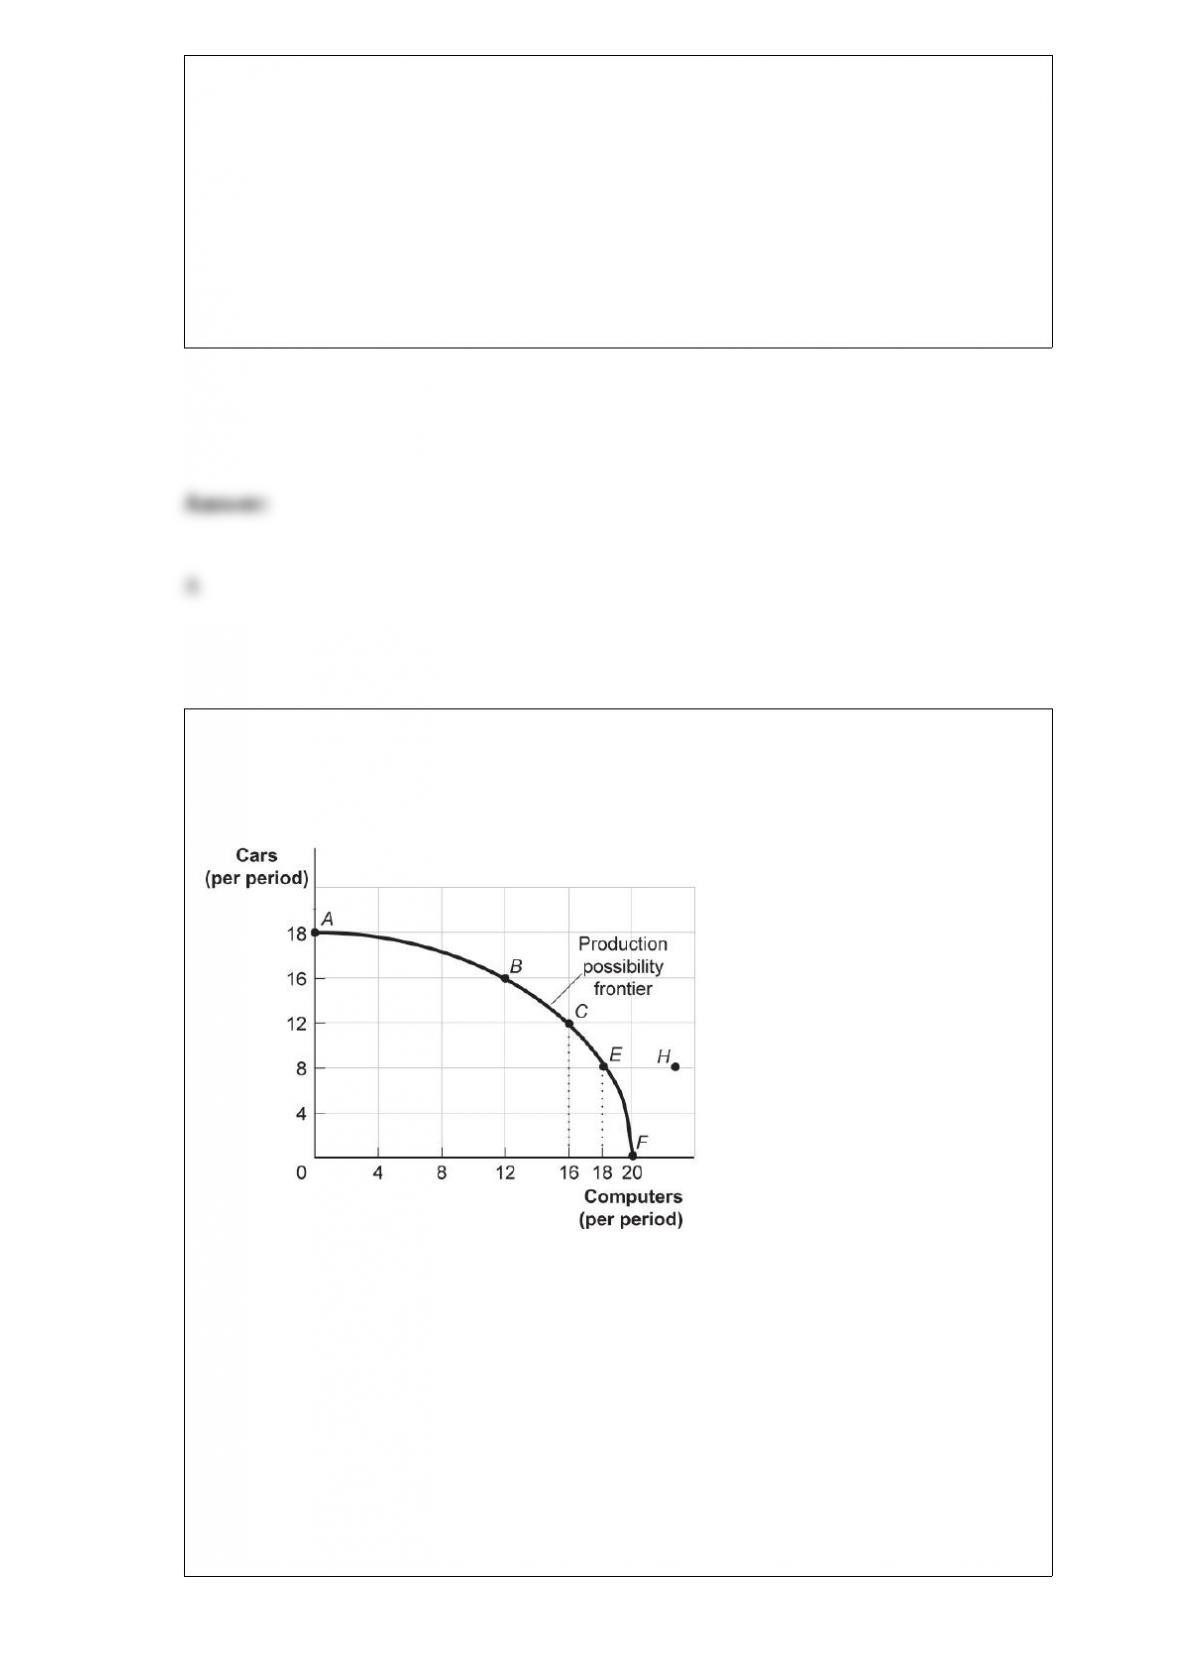
Figure: Production Possibility Frontier
(Figure: Production Possibility
Frontier) Look at the figure Production Possibilities Frontier. A movement from point C
producing 12 cars and 16 computers per period to point B means a _____of _____ cars
and a _____ of _____ computers per period.
A) gain; 4; loss; 4
B) gain; 2; loss; 4
C) gain; 4; loss; 6
D) loss; 2; gain; 4

In the circular-flow diagram households buy _____ in the _____ market.
A) goods and services; product
B) goods and services; factor
C) resources; factor
D) resources; product
A curve that represents combinations of two goods that yield equal levels of satisfaction
is a(n):
A) indifference curve.
B) budget curve.
C) marginal utility curve.
D) price”consumption curve.

If there is a decrease in supply, assuming a positively sloped supply curve and a
negatively sloped demand curve, total surplus:
A) will increase.
B) will decrease.
C) will remain the same.
D) may change, but we can’t tell how.