
A free market system tends to
a. produce a fairly equal distribution of income.
b. pay people exactly what they are worth.
c. produce a relatively unequal distribution of income.
d. pay most people more than they are worth, at the expense of reducing firms’ profits.
Mutually beneficial trade is impossible when different persons have different
preferences about goods and services.
a. True
b. False
America’s prosperity and economic growth is secure for the foreseeable future.
a. True
b. False
A regressive tax is one in which the average tax rate falls as income rises.
a. True
b. False
The distinguishing feature of the land market is that the
a. supply is highly inelastic.
b. supply is highly elastic.
c. demand is highly inelastic.
d. demand is highly elastic.
A ray through the origin always has a slope of one.
a. True
b. False

The average hourly wage (excluding benefits) in the United States is currently
a. $7,50
b. $9,95
c. $15,00
d. $20,00
The fundamental criticism from the efficiency perspective of AFDC and other
antipoverty programs is that
a. they do not help families with unemployed fathers.
b. the benefits are too low.
c. they offer disincentives to earning income.
d. the tax on this income is too low.
A demand schedule’s position is determined partly by the supply of a good.
a. True
b. False
Figure 11-6
The profit-maximizing monopolist in Figure 11-6 will sell its output at
a. P1.
b. P2.
c. P3.
d. P4.

The marginal productivity principle says that a profit-maximizing firm should
a. hire capital until its marginal product is zero.
b. hire labor until another worker costs more to hire than she can earn for the firm.
c. hire the quantities of capital and of labor at which their marginal products are equal.
d. hire capital until its marginal product is negative.
Figure 22-9
In Figure 22-9, Pestoland exports pasta to Pastaland. The equilibrium price of pasta will
be
a. OC
b. OJ
c. OA
d. OK

Rent controls encourage investment in housing because they bring stability to the
market.
a. True
b. False
Which of the following is the most closed economy?
a. the Netherlands
b. the United States
c. Germany
d. Russia
e. Canada
Tax loopholes increase the progressivity of the federal income tax.
a. True
b. False

Figure 22-9
In Figure 22-9, at price OC
a. quantity supplied of pasta exceeds quantity demanded so price will fall.
b. quantity demanded for pasta exceeds quantity supplied so price will rise.
c. exports of pasta equal XY.
d. imports of pasta equal XY.
The demand curve for a firm’s product is also the curve showing
a. total revenue.
b. marginal revenue.
c. average revenue.
d. average profits.
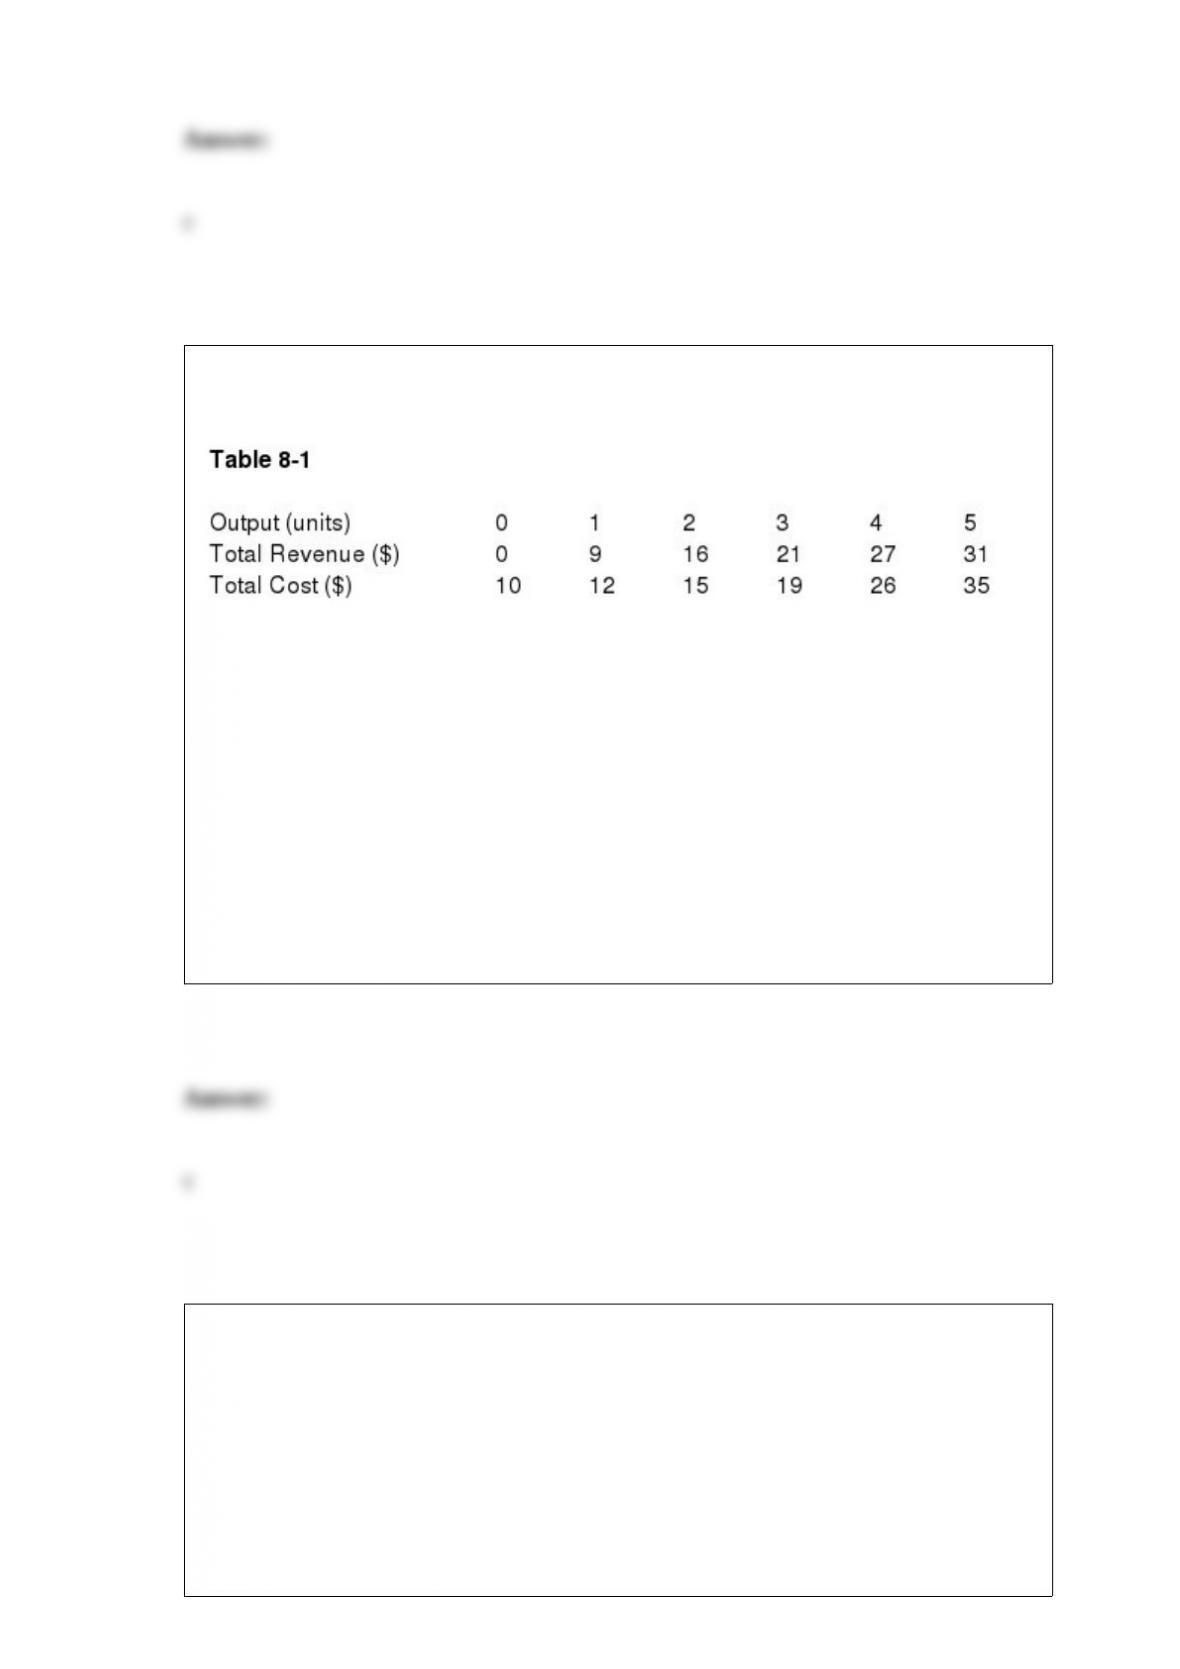
To maximize its profits, the firm described in Table 8-1 should produce ____ unit(s) of
output.
a. 1
b. 2
c. 3
d. 4
A typical supply curve has
a. slope equal to zero.
b. slope equal to infinity.
c. negative slope.
d. positive slope.
e. constant slope.
Figure 5-6
In Figure 5-6, a shift in the budget line from AC to AB indicates
a. the price of wine coolers has risen.
b. income has increased.
c. the price of beer has fallen.
d. the price of wine coolers has fallen.
e. All of the above are correct.
All economic transactions involve only buyers and sellers; no third parties are involved.

a. True
b. False
Which of the following is not a requirement for the existence of monopolistic
competition in a market?
a. numerous small sellers
b. full information about the market among buyers and sellers
c. product homogeneity
d. freedom of entry into the market
One popular definition of economics is the study of
a. how scarcity increases opportunities to meet ends.
b. how markets overcome scarcity.
c. one goal and three tasks.
d. how to use limited means to meet unlimited wants.
e. wants versus needs.

On a traditional supply and demand diagram,
a. price is measured along the horizontal axis and quantity along the vertical axis.
b. price is measured along the vertical axis and quantity along the horizontal axis.
c. quantity demanded is measured along the horizontal axis, quantity supplied is
measured along the vertical axis, and price is indicated on the contour lines.
d. quantity is measured along both axes and price is indicated on the contour lines.