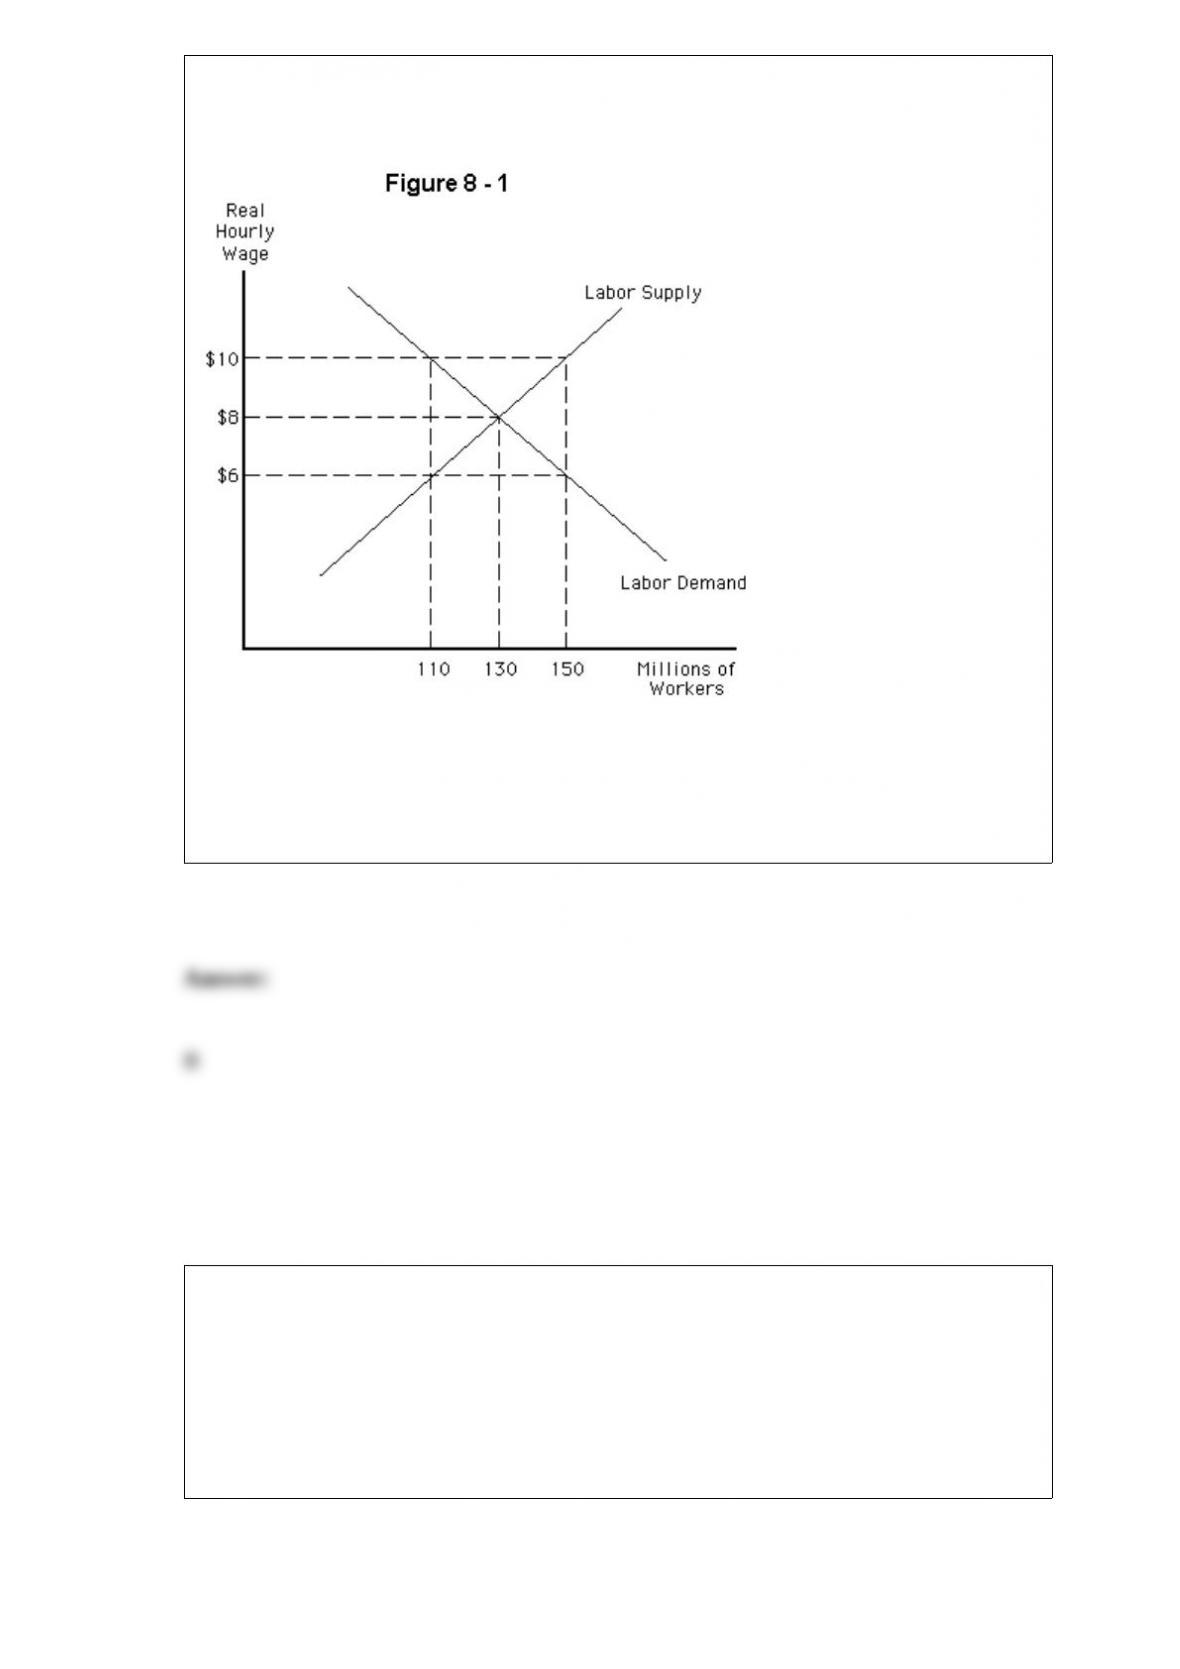
Refer to Figure 8-1. According to the graph, the equilibrium real hourly wage and
quantity of labor employed, respectively, are
a. $10, 110 million workers
b. $8, 130 million workers
c. $8, 150 million workers
d. $6, 150 million workers
e. $6, 130 million workers
Unemployment rates in many continental European countries have been consistently
higher compared to the United States. The difference is mostly
a. due to differing monetary policies
b. cyclical unemployment
c. frictional unemployment
d. structural unemployment
e. seasonal unemployment
The part of consumption that is determined by income is referred to as autonomous
consumption.
Which of the following determines the exchange rate between two currencies in the
long run?
a. Relative interest rates
b. Relative output levels
c. Expectations of future exchange rates
d. Relative price levels
e. Expectations of future interest rates.
Government expenditures are larger than government outlays.

As of December 2008, housing accounted for about ________ of the typical consumer’s
spending.
a. 32 percent.
b. 30 percent.
c. 43 percent.
d. 65 percent.
e. 70 percent.
Which of the following statements about U.S. unemployment is true?
a. All racial groups experience approximately the same rate of unemployment.
b. Black and white teenagers experience equally high rates of unemployment.
c. Blacks as a group experience higher rates of unemployment than do white teenagers.
d. Blacks experience higher rates of unemployment than do Hispanics.
e. White teenagers experience higher rates of unemployment than do any other group in
the population.
In the classical model,
a. markets do not automatically clear.
b. business demand for loanable fund exceeds business planned investment spending.
c. business demand for loanable fund is equal to business planned investment spending.
d. businesses engage in interest-free borrowing.
e. the government’s demand for funds is downward sloping.
A firm is said to have monopoly power
Economists widely agree that the Consumer Price Index (CPI) understates the true U.S.
inflation rate.
A key tool of countercyclical fiscal policy is
a. the interest rate
b. the federal funds rate
c. the tax code
d. the regulatory code
e. Presidential executive orders
Which of the following could cause the market demand curve for hot dogs to shift to
the left?
Say’s Law states that by purchasing goods and services, buyers stimulate firms to
produce goods and services equal to what has been purchased: Demand creates its own
supply.
Which of the following would be classified as private investment spending?
a. A family’s purchase of a new home
b. An automobile producer’s purchase of steel for use in building new cars
c. A paper company’s purchase of timber
d. A household’s purchase of AT&T stock
e. The government’s purchase of a new office building
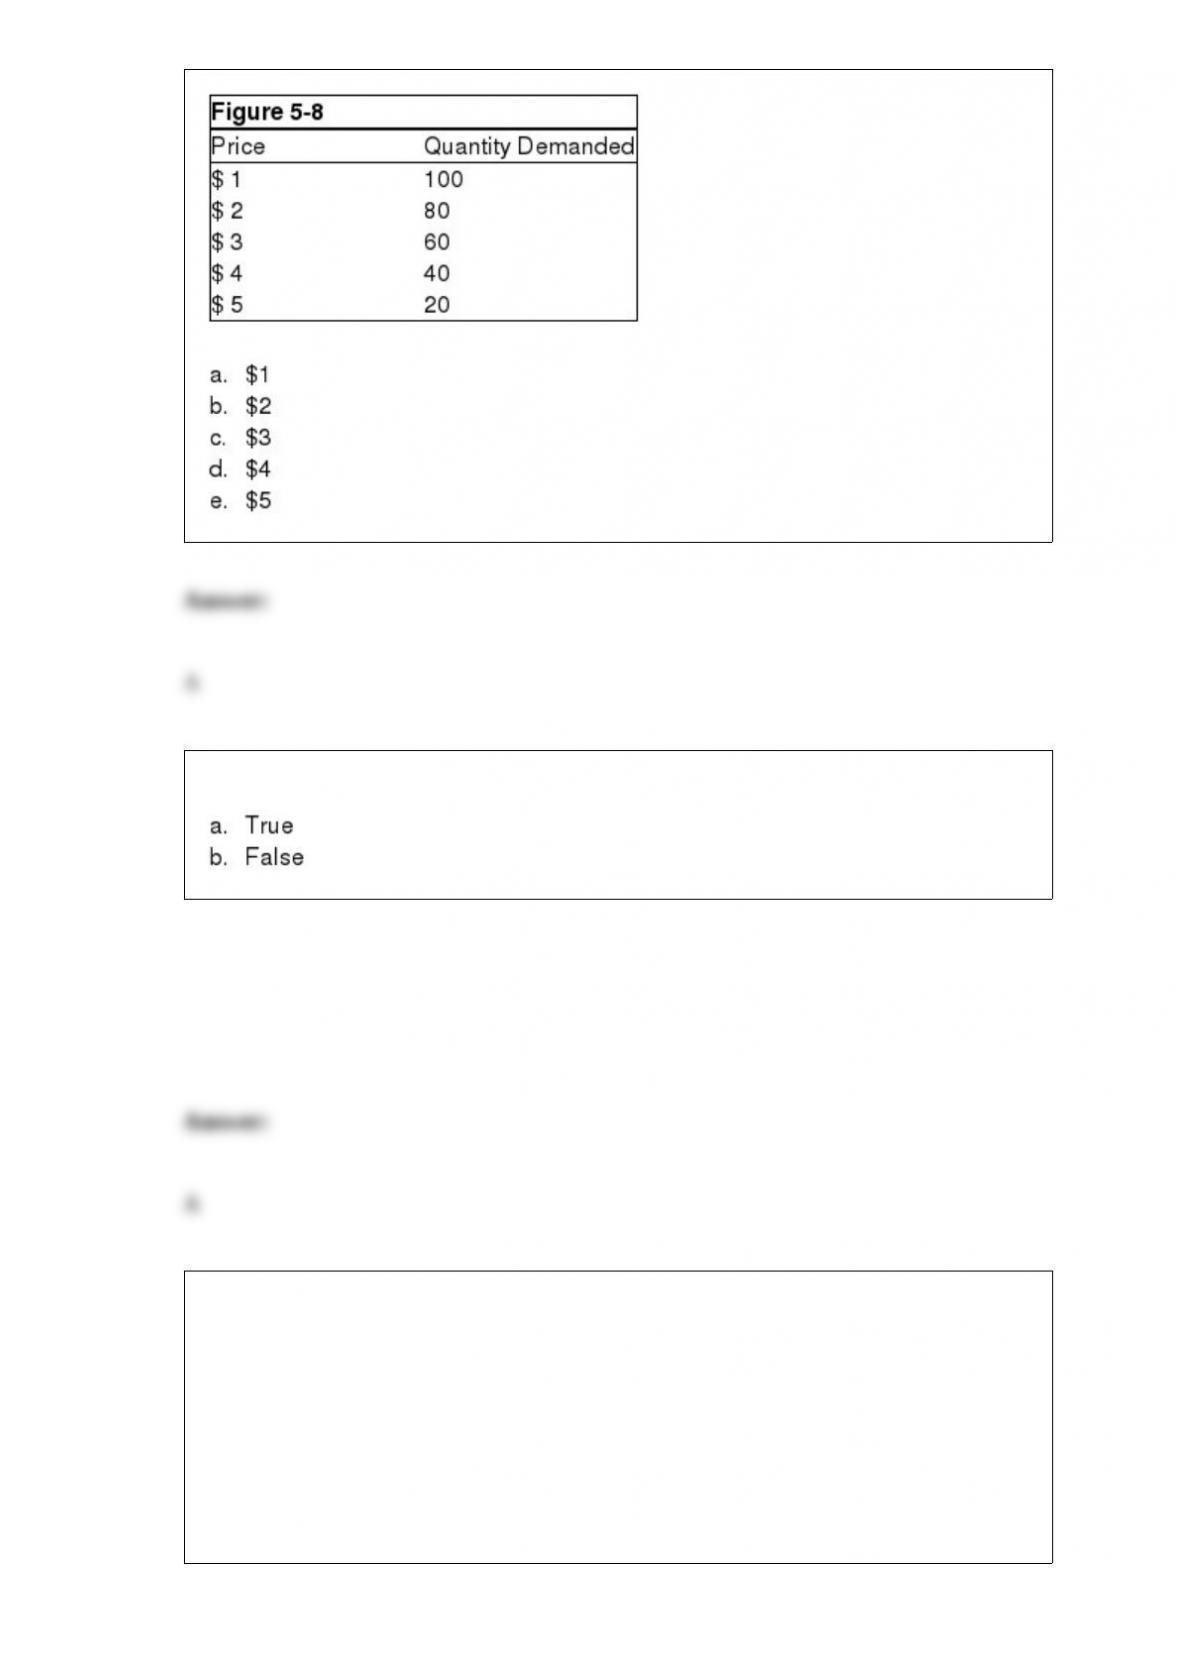
Figure 5-8 shows the demand schedule for hockey pucks. At which price is demand the
least price elastic?
A negative supply shock causes stagflation in the short run.
Dennis is an excellent typist. However, because he has been unable to adapt to his
company’s new computer system, he has lost his job. He is currently seeking another
secretarial position, but it is likely that he will have to acquire new skills to become
employable as a secretary again. Dennis would best be described as
a. frictionally unemployed
b. seasonally unemployed
c. structurally unemployed
d. cyclically unemployed
e. not in the labor force
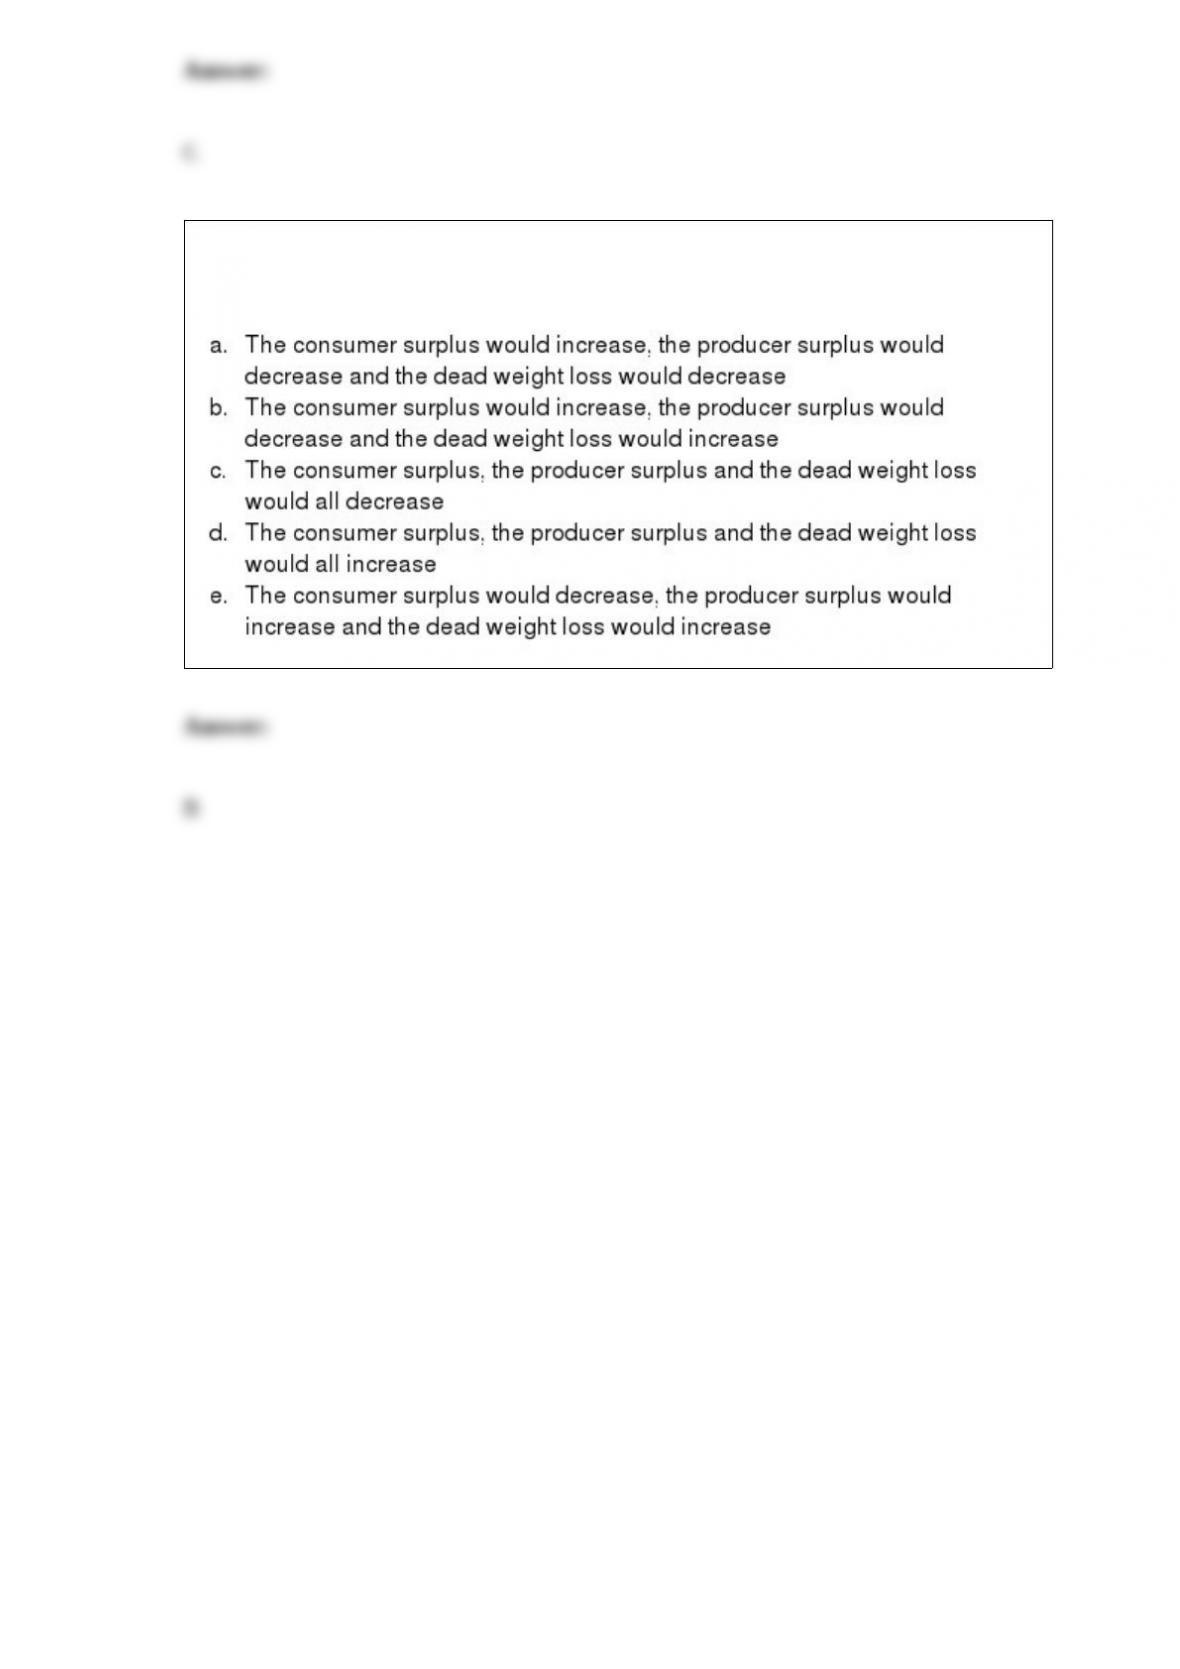
Consider a market with a price ceiling. If the price ceiling is lowered which of the
following would happen?