
The inverse demand curve for a monopolist changes from P = 100 ” 2Q to P = 120 ”
2Q, while the marginal cost of production remains unchanged at a constant $20. What
happens to the profit-maximizing price and quantity following the change in the
demand curve?
A) The price rises from $40 to $60, and the output rises from 20 units to 30 units.
B) The price rises from $60 to $70, and the output rises from 20 units to 25 units.
C) The price rises from $10 to $20, and the output rises from 100 units to 120 units.
D) The price rises from $50 to $60, and the output rises from 10 units to 12 units.
Standard economic models assume that people make decisions based on ______, not
______.
A) altruistic motives; self-interest
B) real variables (i.e., variables adjusted for inflation); nominal variables
C) endowment effects; framing
D) framing; anchoring
Figure 16.4
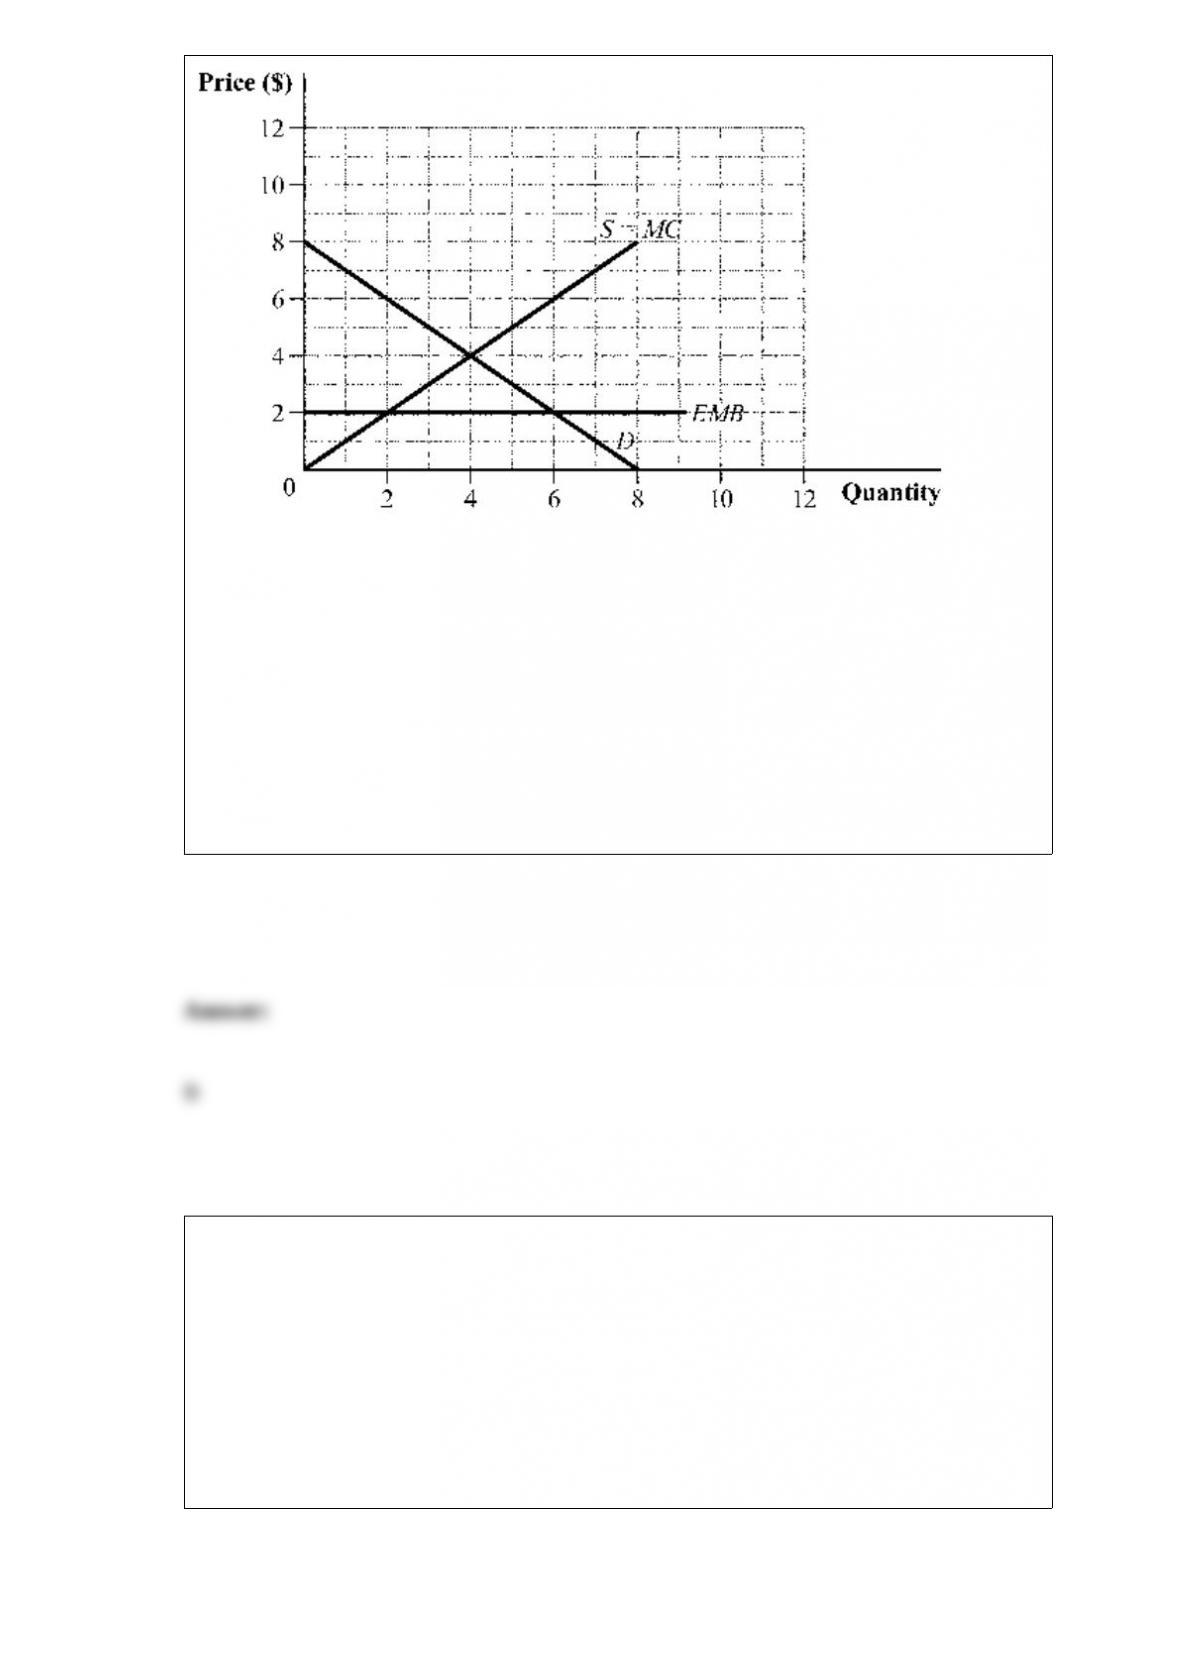
(Figure 16.4) The output level under perfect competition is ______, while the socially
optimal output level is ______.
A) 4; 3
B) 4; 5
C) 2; 4
D) 4; 6
There are no externalities in the market for brim hats; therefore, the:
A) external marginal cost equals the marginal cost.
B) social cost equals the private marginal cost.
C) social benefit equals the external marginal benefit.
D) equilibrium level of output will be too low.

Which of the following statements is TRUE?
I. If TC = $40,000 and FC = $18,000, then VC = $58,000.
II. Because fixed cost does not vary with output, the fixed cost curve is a vertical line.
III. The total cost and variable cost curves always have the same shape and slope.
IV. When output is zero, total cost equals fixed costs.
A) I, II, and III
B) III only
C) II, III, and IV
D) III and IV
Which of the following statements is TRUE?
A) Short-run average total cost curves intersect the long-run average total cost curve at
its minimum point.
B) It is not possible for two short-run average total cost curves to cross.
C) The long-run average total cost curve is derived by tracing out all of the firm’s
short-run average total cost curves.
D) The long-run average total cost curve indicates that it is more costly to produce
output in the long run, especially when input prices are rising because of inflation.

Silky Inc., which sells custom silk ties designed by famous people, faces a demand
curve of Q = 150 ” 0.2P, where Q is measured in hundreds of ties and P is the price per
tie. The marginal cost of production is given by MC = 5Q. What is Silky’s
profit-maximizing output level? (Hint: Add two zeros to the number you get.)
A) 25,000
B) 5,000
C) 450
D) 6,000
Suppose a firm faces the inverse demand curve P = 100 ” Q. Marginal cost is constant
at $10.
a. Calculate producer surplus and the deadweight loss under monopoly pricing.
b. Suppose the firm uses block pricing, selling the first 45 units at $55 per unit, the next
20 units at $35 per unit, and the next 20 units at $15 per unit. Calculate producer
surplus and the deadweight loss under block pricing.
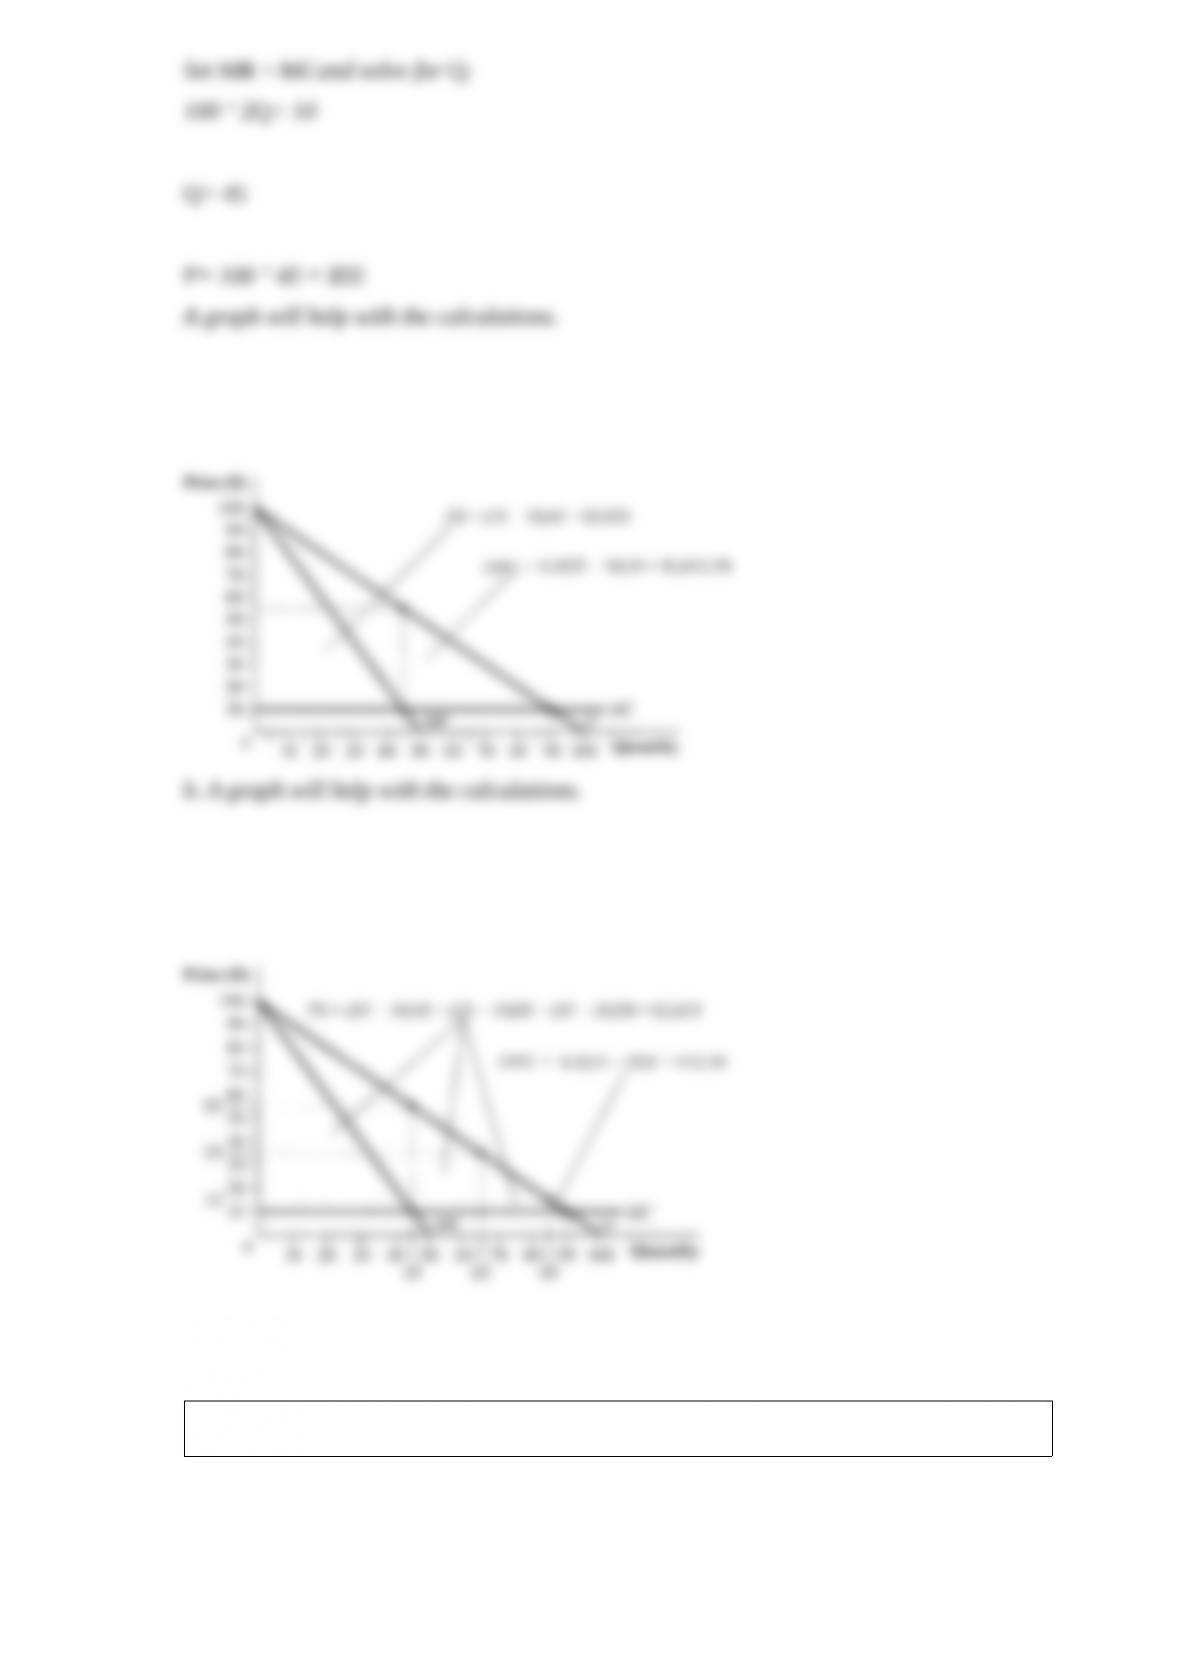
Figure 5.28
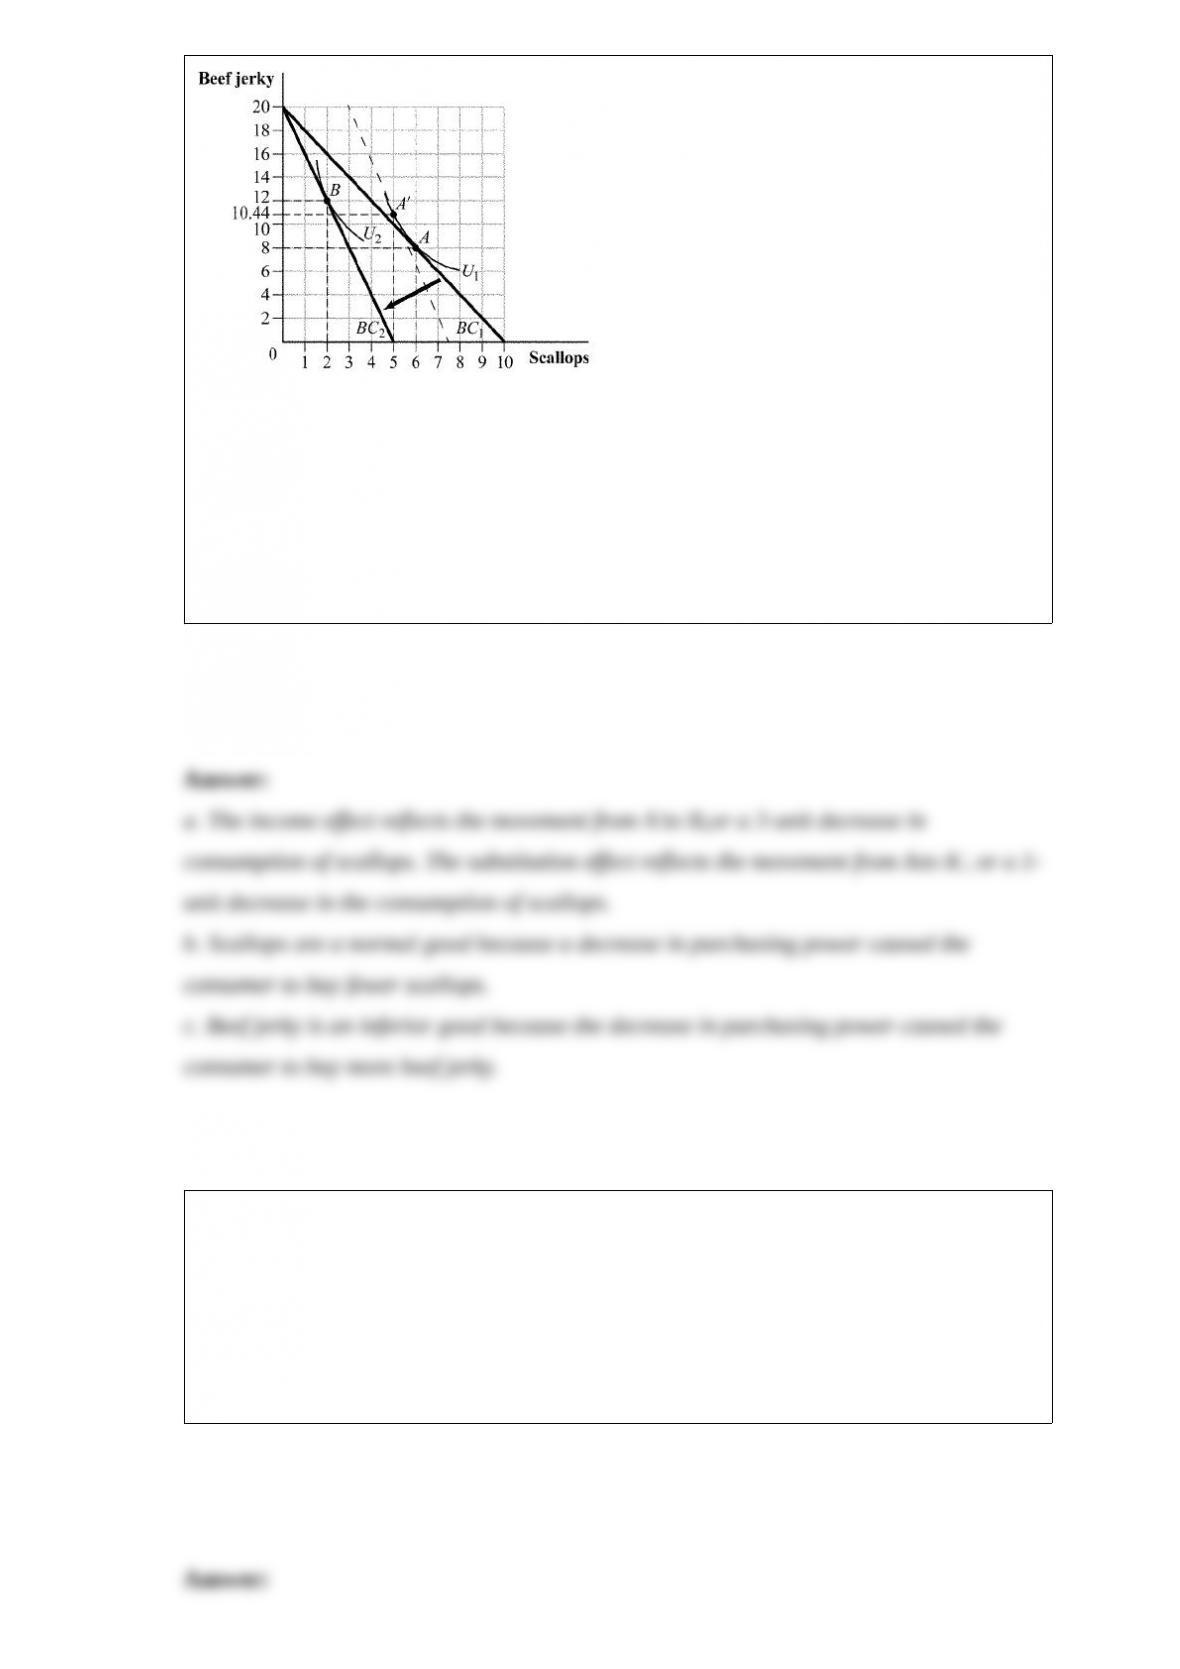
(Figure 5.28) Answer the following questions.
a. What is the size of the income effect and substitution effect of the price change?
b. Are scallops a normal good or an inferior good?
c. Is beef jerky a normal good or an inferior good?
Explain how the following types of barriers to entry create market power.
a. product differentiation
b. switching costs
c. government regulation
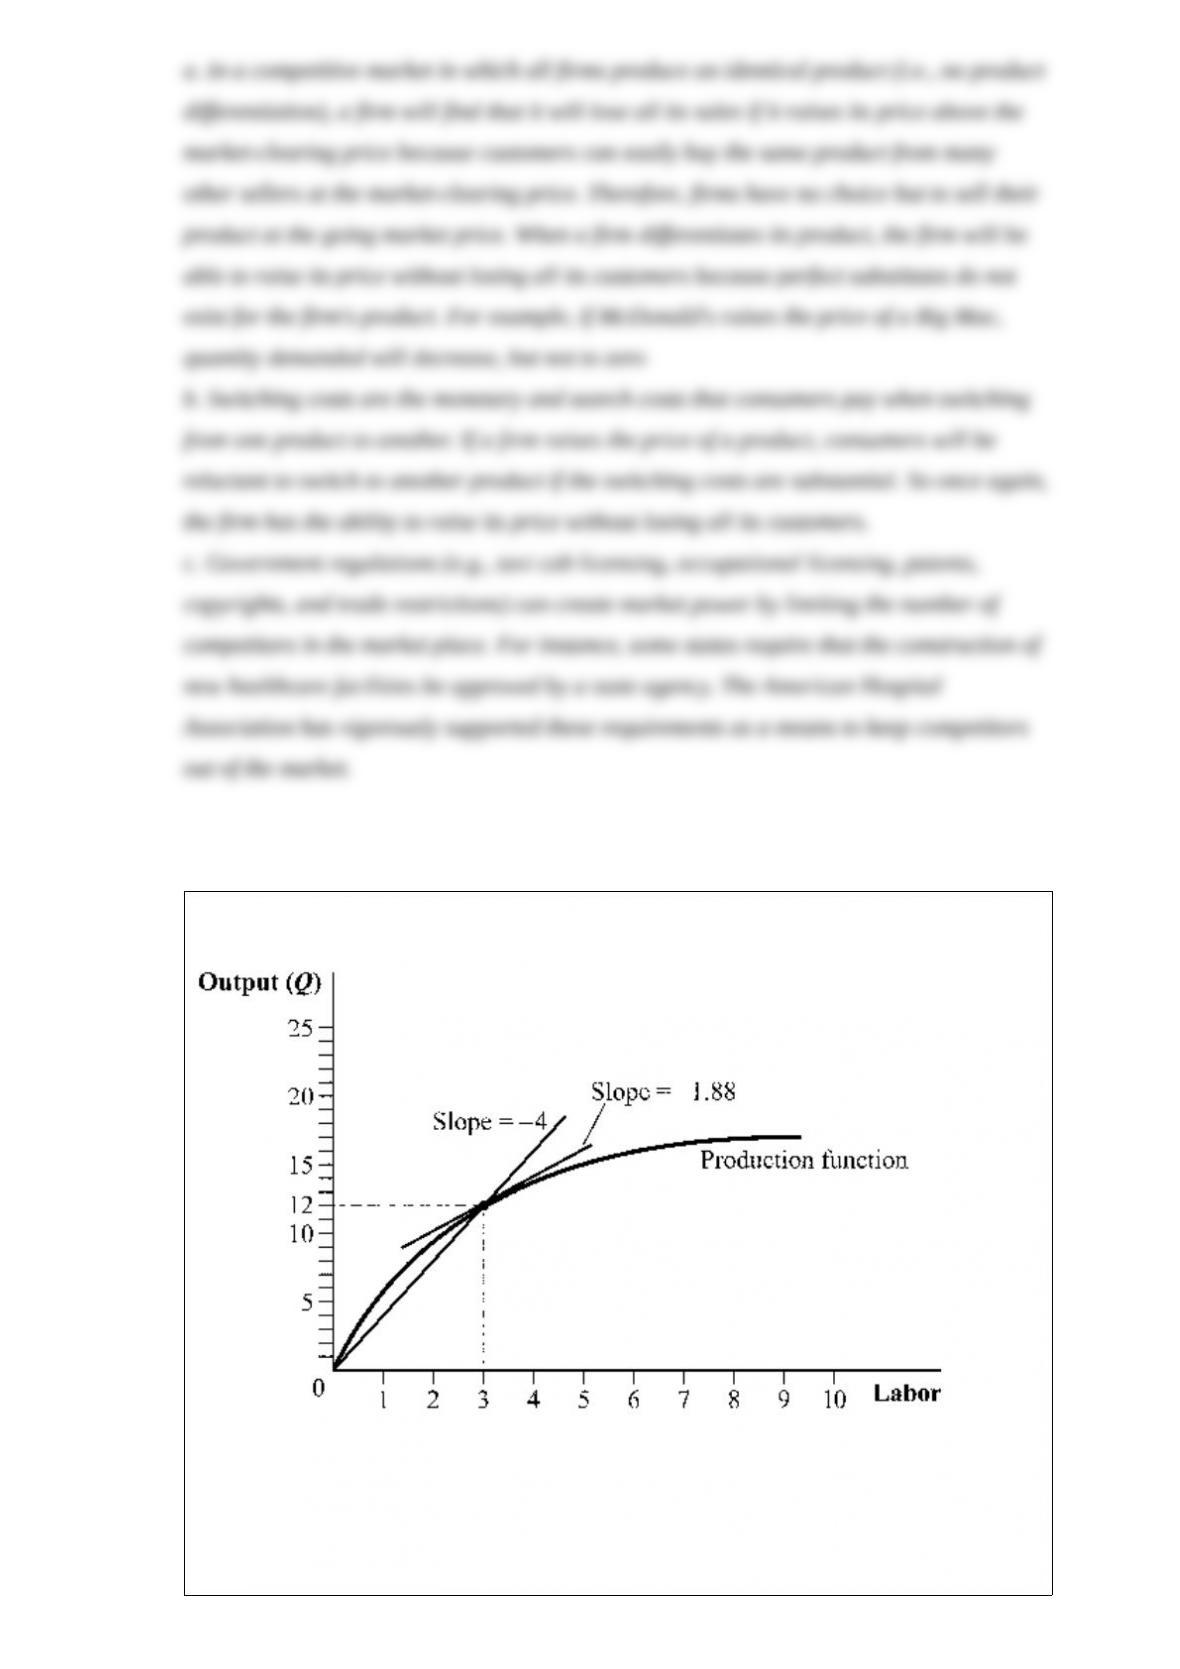
Figure 6.2
(Figure 6.2) Which of the following statements is TRUE?
I. This production function exhibits diminishing marginal product. II. At L = 3, MPL =
1.88 and APL = 4. III. At L = 6, APL > MPL. IV. At L = 3, MPL = 4 and APL = 1.88.

I. This production function exhibits diminishing marginal product.
II. At L = 3, MPL = 1.88 and APL = 4.
III. At L = 6, APL > MPL.
IV. At L = 3, MPL = 4 and APL = 1.88.
A) II and III
B) I, II, and III
C) I, III, and IV
D) I and II
The market for soybeans is characterized by = 18 ” Ps and = Ps” 5Pc, where Qs
is the quantity of soybeans in millions of bushels, Ps is the price per bushel of soybeans,
and Pcis the price per bushel of corn. The market for corn is characterized by = 18 “
Pc and = Pc ” 5Ps, where Qc is the quantity of corn in millions of bushels. In general
equilibrium, what is the equilibrium quantity of corn and soybeans?
A) Equilibrium quantity of corn = 6 million and equilibrium quantity of soybeans = 6
million.
B) Equilibrium quantity of corn = 9 million and equilibrium quantity of soybeans = 9
million.
C) Equilibrium quantity of corn = 6.5 million and equilibrium quantity of soybeans = 5
million.
D) Equilibrium quantity of corn = 16 million and equilibrium quantity of soybeans = 16
million.
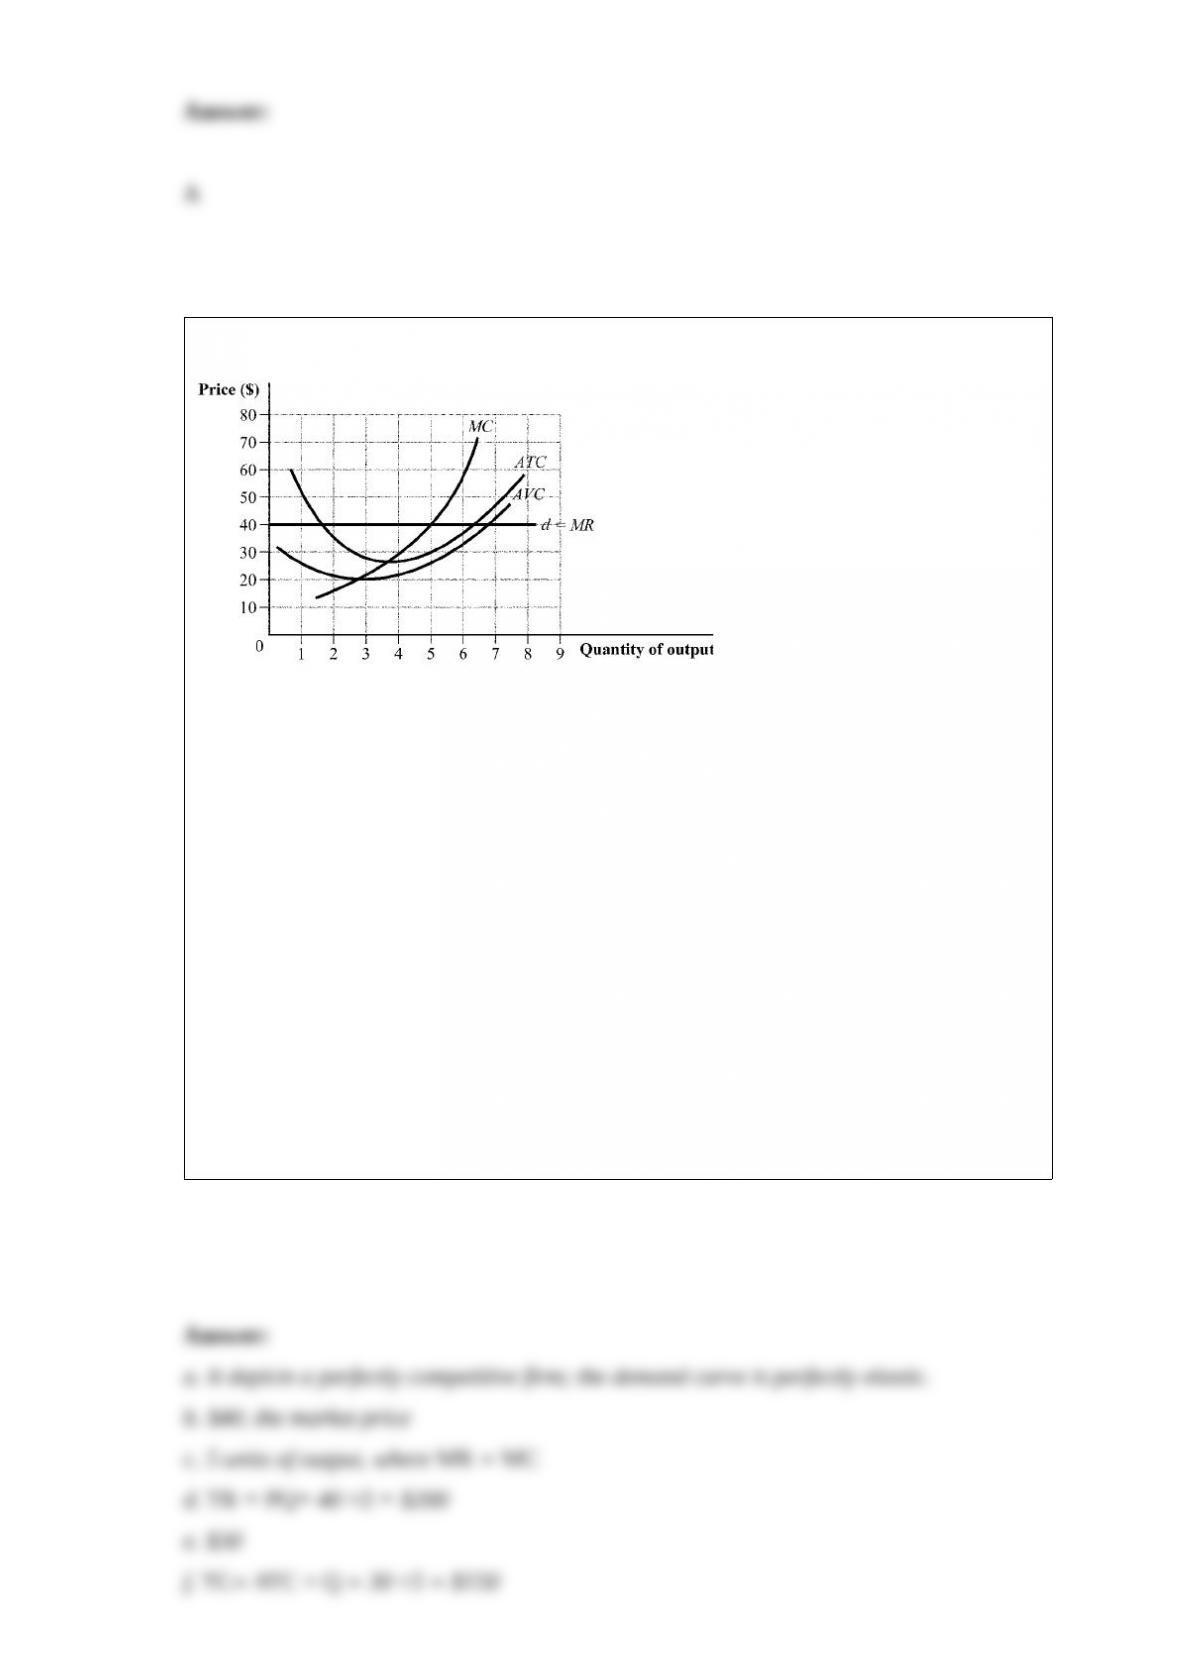
Figure 8.21
(Figure 8.21) Answer each of the following questions.
a. What type of firm is depicted in the figure?
b. If the firm would produce and sell an additional unit of output, by how much would
its total revenue change?
c. What is the firm’s profit-maximizing output level?
d. What is the firm’s total revenue at the profit-maximizing quantity?
e. What is the firm’s average total cost at the profit-maximizing quantity?
f. What is the firm’s total cost at the profit-maximizing quantity?
g. What is the firm’s maximum profit?
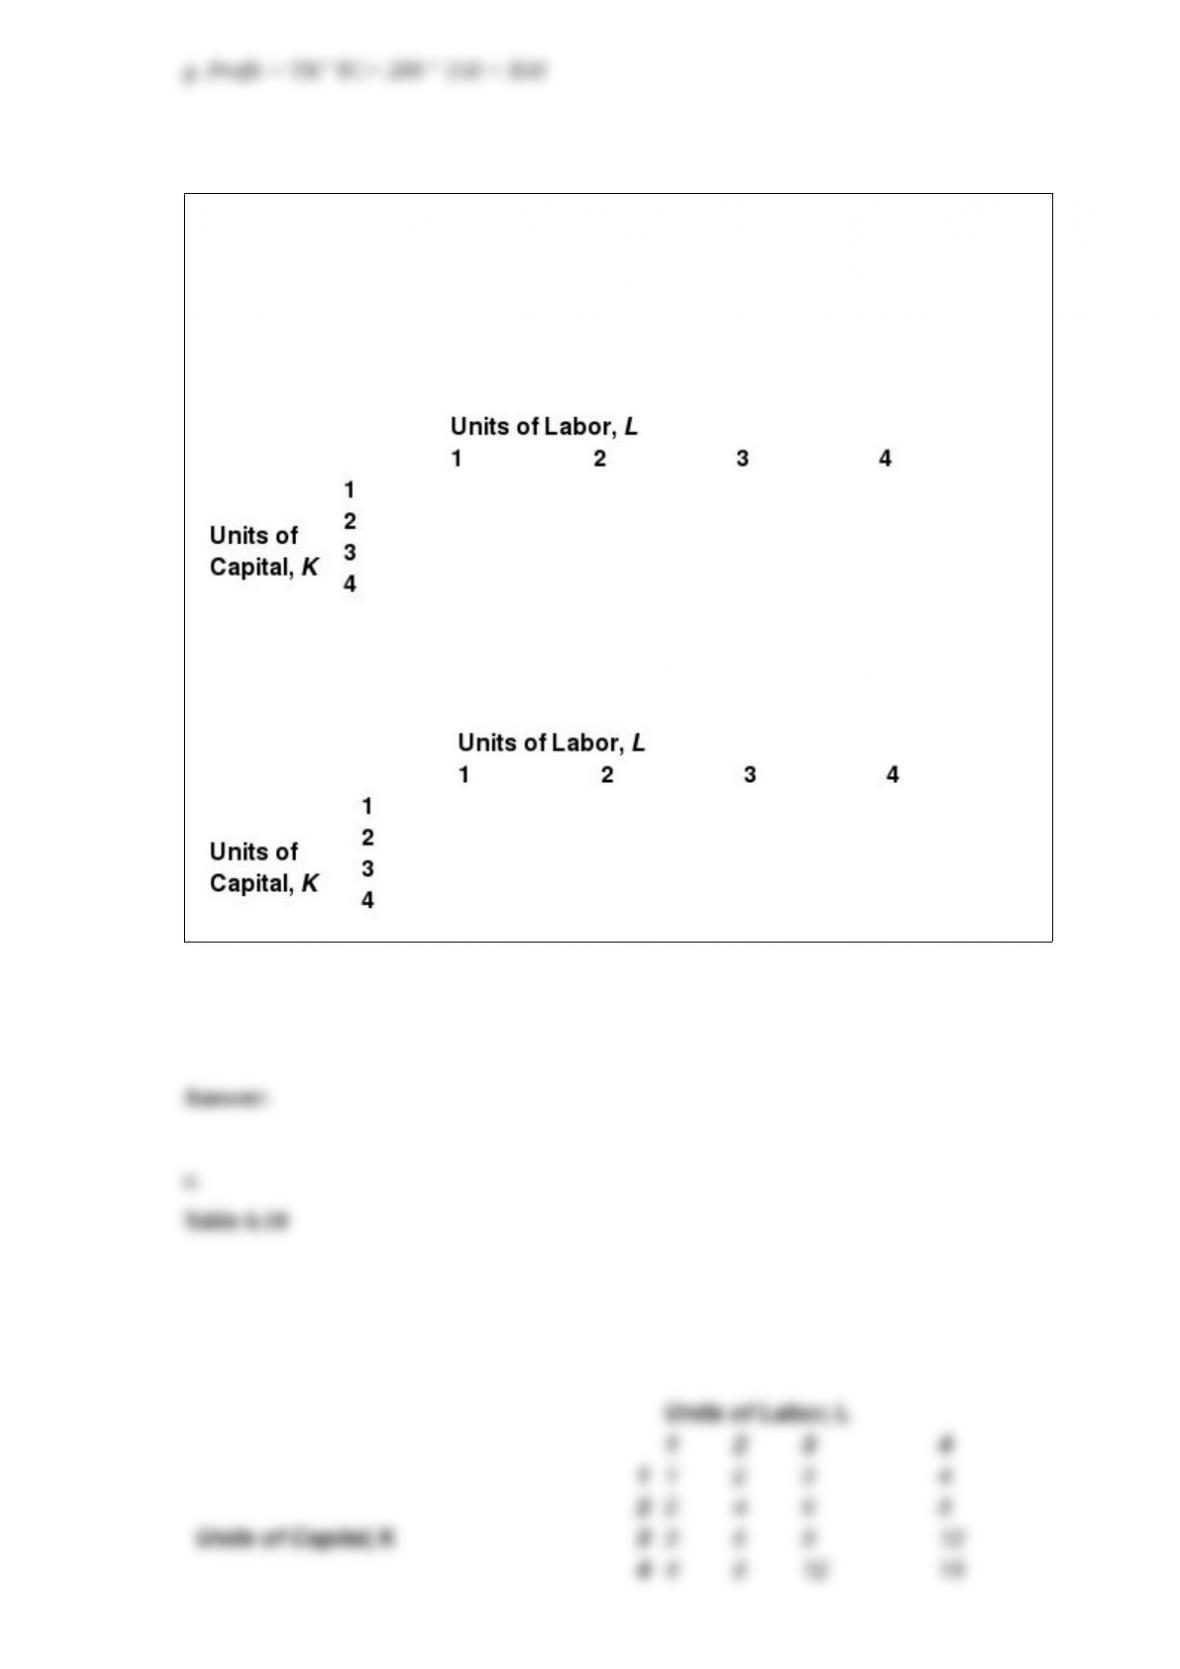
Answer the following questions.
a.Complete the following table by filling in the missing output values. Assume the
production function is given by Q = KL, where Q is units of output, K is units of capital,
and L is units of labor.
Table 6.8
b.If total factor productivity increases by 50%, write the equation for the new
production function and complete the following table.
Table 6.9
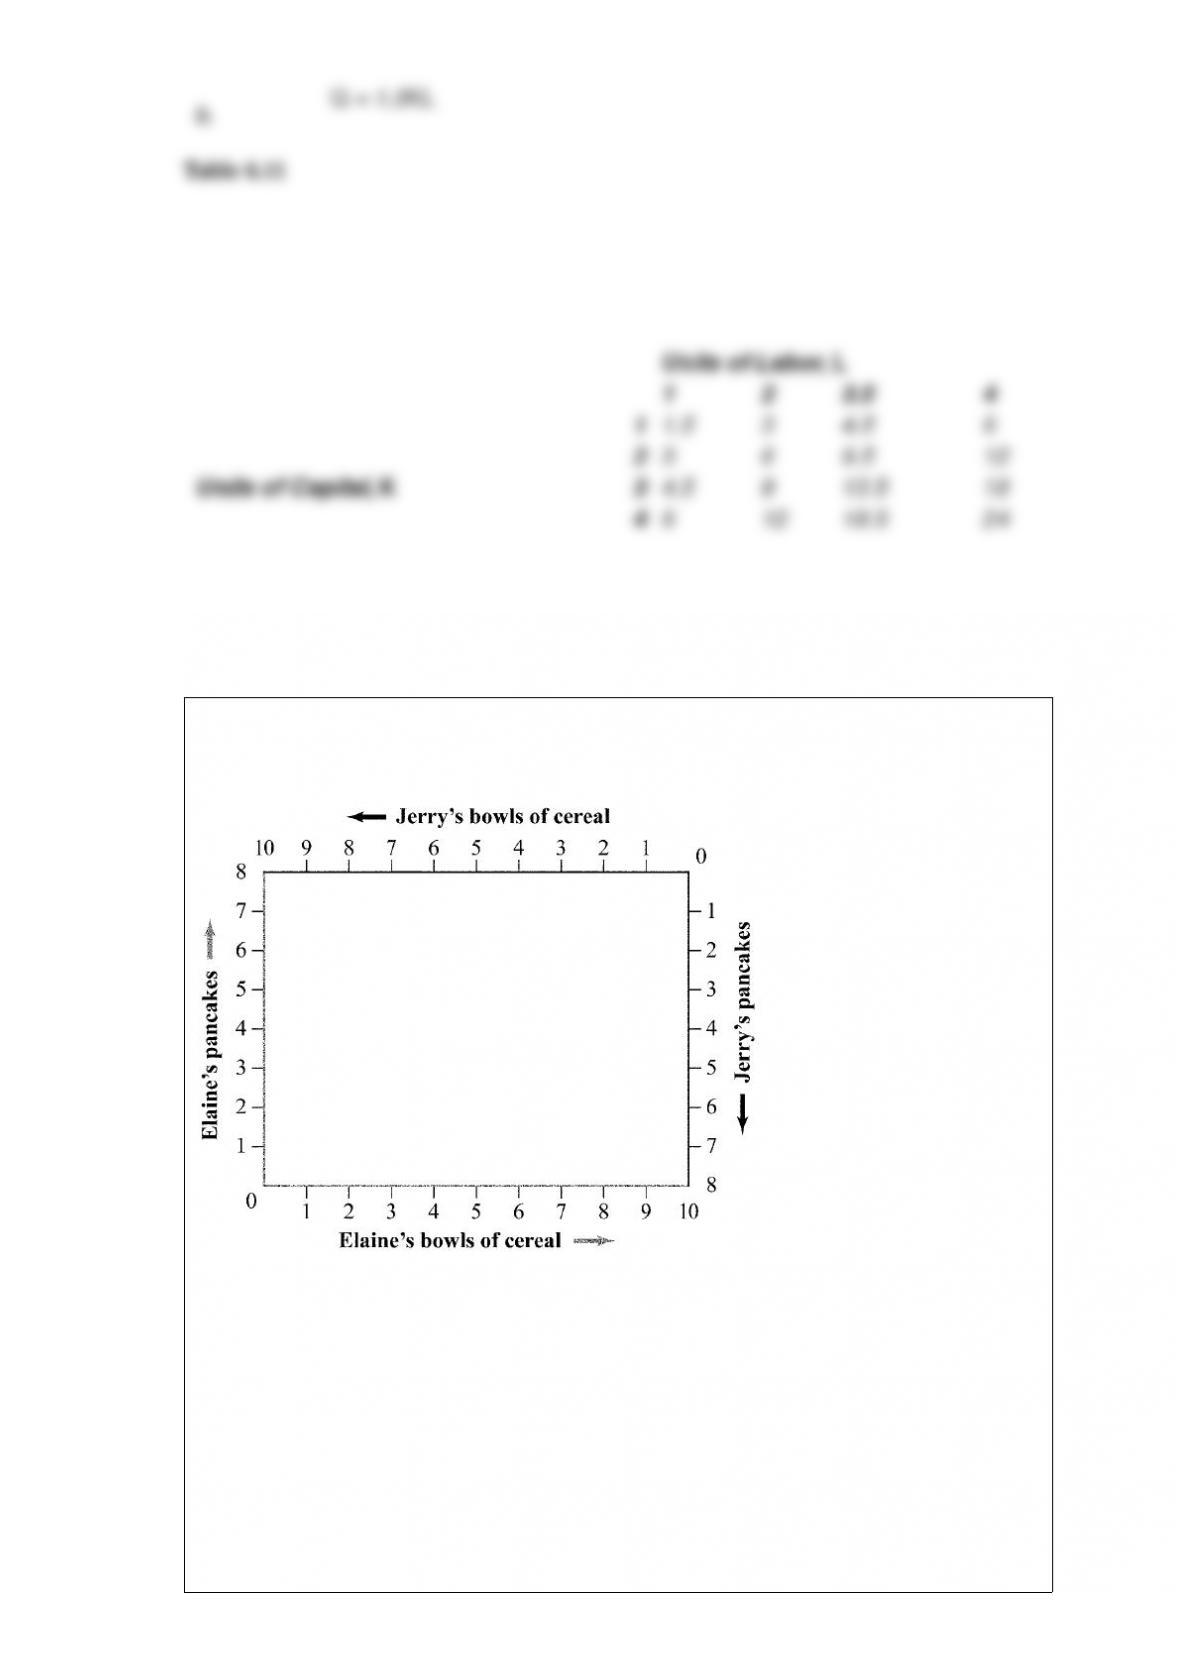
Figure 14.1
(Figure 14.1) The market prices for cereal and pancakes are $2 and $1, respectively.
Pareto efficiency requires that the marginal rate of substitution of cereal for pancakes:
A) equals 2 for Elaine and 1/2 for Jerry.
B) equals 1/2 for Elaine and 2 for Jerry.
C) equals 2 for Elaine and 2 for Jerry.
D) equals 2 for Elaine and 1 for Jerry.

Which of the following statements is TRUE regarding collusion, Bertrand (identical
products), and Cournot competition?
I. Prices are highest in collusion, next highest in Cournot, and lowest in Bertrand.
II. Output is highest in Bertrand, next highest in Cournot, and lowest in collusion.
III. Profit is highest in Bertrand, next highest in Cournot, and lowest in collusion.
A) I and II
B) III only
C) I only
D) II only
Suppose that the supply of a good is given by Q = “50 + 5P, where Q is the quantity
supplied and P is the price measured in dollars per unit. This equation indicates that the
quantity supplied increases by:
A) 5 units for every dollar increase in price.
B) 45 units for every dollar increase in price.
C) 50 units for every dollar increase in price.
D) 55 units for every dollar increase in price.

If the inverse demand curve for a good is given by P = 100 ” 4Q, the price elasticity of
demand is elastic at a price of ______ and inelastic at a price of ______.
A) $40; $60
B) $60; $50
C) $55; $35
D) $35; $30
The perfectly competitive firm’s short-run supply curve is:
A) the portion of its marginal cost curve that lies above average variable cost.
B) the portion of its marginal cost curve that lies above average total cost.
C) its average variable cost curve that lies above marginal revenue.
D) its average total cost curve that lies above marginal revenue.
Suppose that each firm that operates in an industry has a total cost curve given by TC =
7,000 + 50Q. In this industry, the lowest average total cost of producing 1,000 units of
output occurs when:
A) two firms each produce 500 units of output.
B) one firm produces all 1,000 units of output.
C) four firms each produce 250 units of output.
D) ten firms each produce 100 units of output.
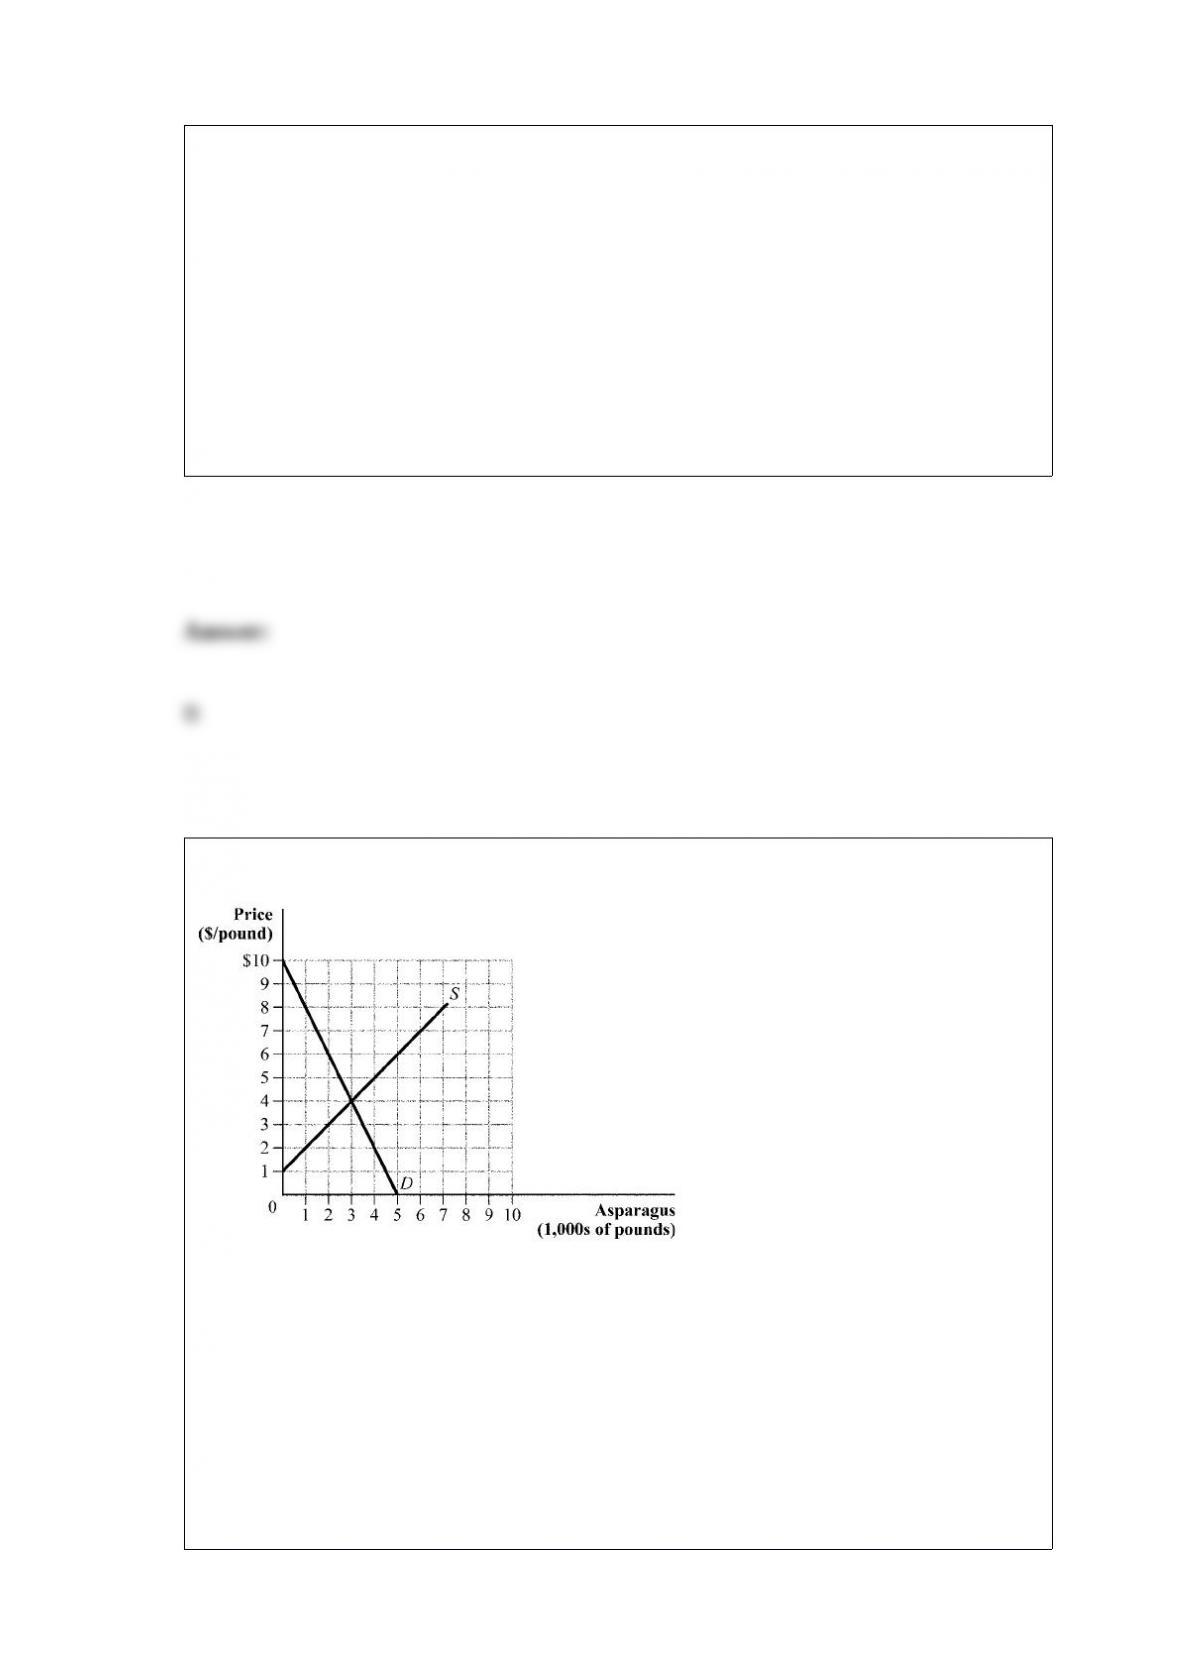
Figure 2.4
(Figure 2.4) At a price of $2, there is an excess:
A) supply of 4,000 pounds.
B) supply of 3,000 pounds.
C) demand of 3,000 pounds.
D) demand of 1,000 pounds.

On some days Gus makes his own salad for lunch, preferring to use either iceberg or
romaine lettuce, topped off with lots of fresh tomatoes. The cross-price elasticity of
demand for iceberg lettuce with respect to romaine lettuce is ______, and the
cross-price elasticity of demand for iceberg lettuce with respect to tomatoes is ______.
A) positive; negative
B) negative; positive
C) zero; positive
D) negative; zero
An infomercial is selling a thigh toner for either $99 or three monthly payments of $39
(in which the first payment occurs immediately and remaining payments occur at the
end of the next two months).
a. Calculate the net present value of the three-month installment plan at a discount rate
of 1% per month. Which payment option makes the consumer better off?
b. Calculate the net present value of the three-month installment plan, using hyperbolic
discounting. Assume that the monthly discount rate of 1% is discounted an additional
40%. Which payment option makes the consumer better off?

A tradable permit system:
A) requires that each firm reduce its pollution by the same amount.
B) is difficult to implement because regulators do not know the marginal abatement
costs of every company.
C) achieves a given amount of pollution reduction at the least cost because firms with
lowest marginal abatement costs do the majority of the pollution reduction.
D) increases pollution because the government gives firms permits that grant them the
right to pollute.
Which of the following statements is TRUE?
I. A firm with market power maximizes profit by producing the output level where P
=MC or MR = MC.
II. If marginal revenue exceeds marginal cost, the firm should expand output to increase
profits.
III. If a firm had no costs of production, the firm should continue producing output until
marginal revenue falls to zero.
A) I only
B) II and III
C) II only

D) I, II, and III
What are the general equilibrium effects between labor markets and housing markets
following an increase in labor demand?
A) As workers’ wages increase, more people move into an area and drive up housing
prices. The rising housing prices will slow the migration of workers to an area.
B) An increase in labor demand will cause a larger wage reduction in areas with an
elastic housing supply than with an inelastic housing supply.
C) An increase in labor demand will cause a larger wage increase in areas with an
elastic housing supply than with an inelastic housing supply.
D) An increase in labor demand will cause a larger employment increase in areas with
an inelastic housing supply than with an elastic housing supply.
Which of the following statements is TRUE?
I. The Rawlsian social welfare function computes society’s welfare by calculating the
difference in utility between the top 10% and bottom 10% of income earners.
II. Economists strictly use the Rawlsian social welfare function to evaluate market
performance.
III. The Rawlsian utility function only considers the utility of the least-well-off person.

A) II and III
B) I, II, and III
C) II only
D) III only
Suppose that Fizzy Soda and Townie Soda each have to choose whether to advertise
their soft drinks. In a Nash equilibrium, both firms choose to advertise and earn weekly
profits of $80,000. Which of the following statements is TRUE?
I. Neither firm has incentive to change its advertising strategy, given the strategy choice
of its rival.
II. If Townie Soda decided to stop advertising, its profits would fall below $80,000.
III. If both firms stopped advertising, it is possible that each firm could earn profits
greater than $80,000.
A) I only
B) II and III
C) I, II, and III
D) I and II

Two firms that are engaged in Stackelberg competition face the market inverse demand
curve P = 100 ” 2Q, where Q is the total market output comprised of Firm 1’s output,
q1, and Firm 2’s output, q2. Each firm produces the product at a constant marginal cost
of $22. If Firm 2’s reaction function is q2 = 22 ” 0.5q1, what is Firm 1’s (the
first-mover’s) inverse demand curve?
A) P = 88 ” 2q1
B) P = 56 ” q1
C) P = 100 ” 2(q2 ” 22 + 0.05q1)
D) P = 88 ” 1.5q1
Between 1974 and 1982, the famous RAND health insurance study randomly assigned
almost 8,000 people to various health insurance plans. To examine how insurance
affects the demand for medical care, some of the insurance plans had little
out-of-pocket expenses, while others had significant copays and deductibles. This
insurance study is an example of a:
A) lab experiment.
B) field experiment.
C) natural experiment.
D) free-rider experiment.