1)
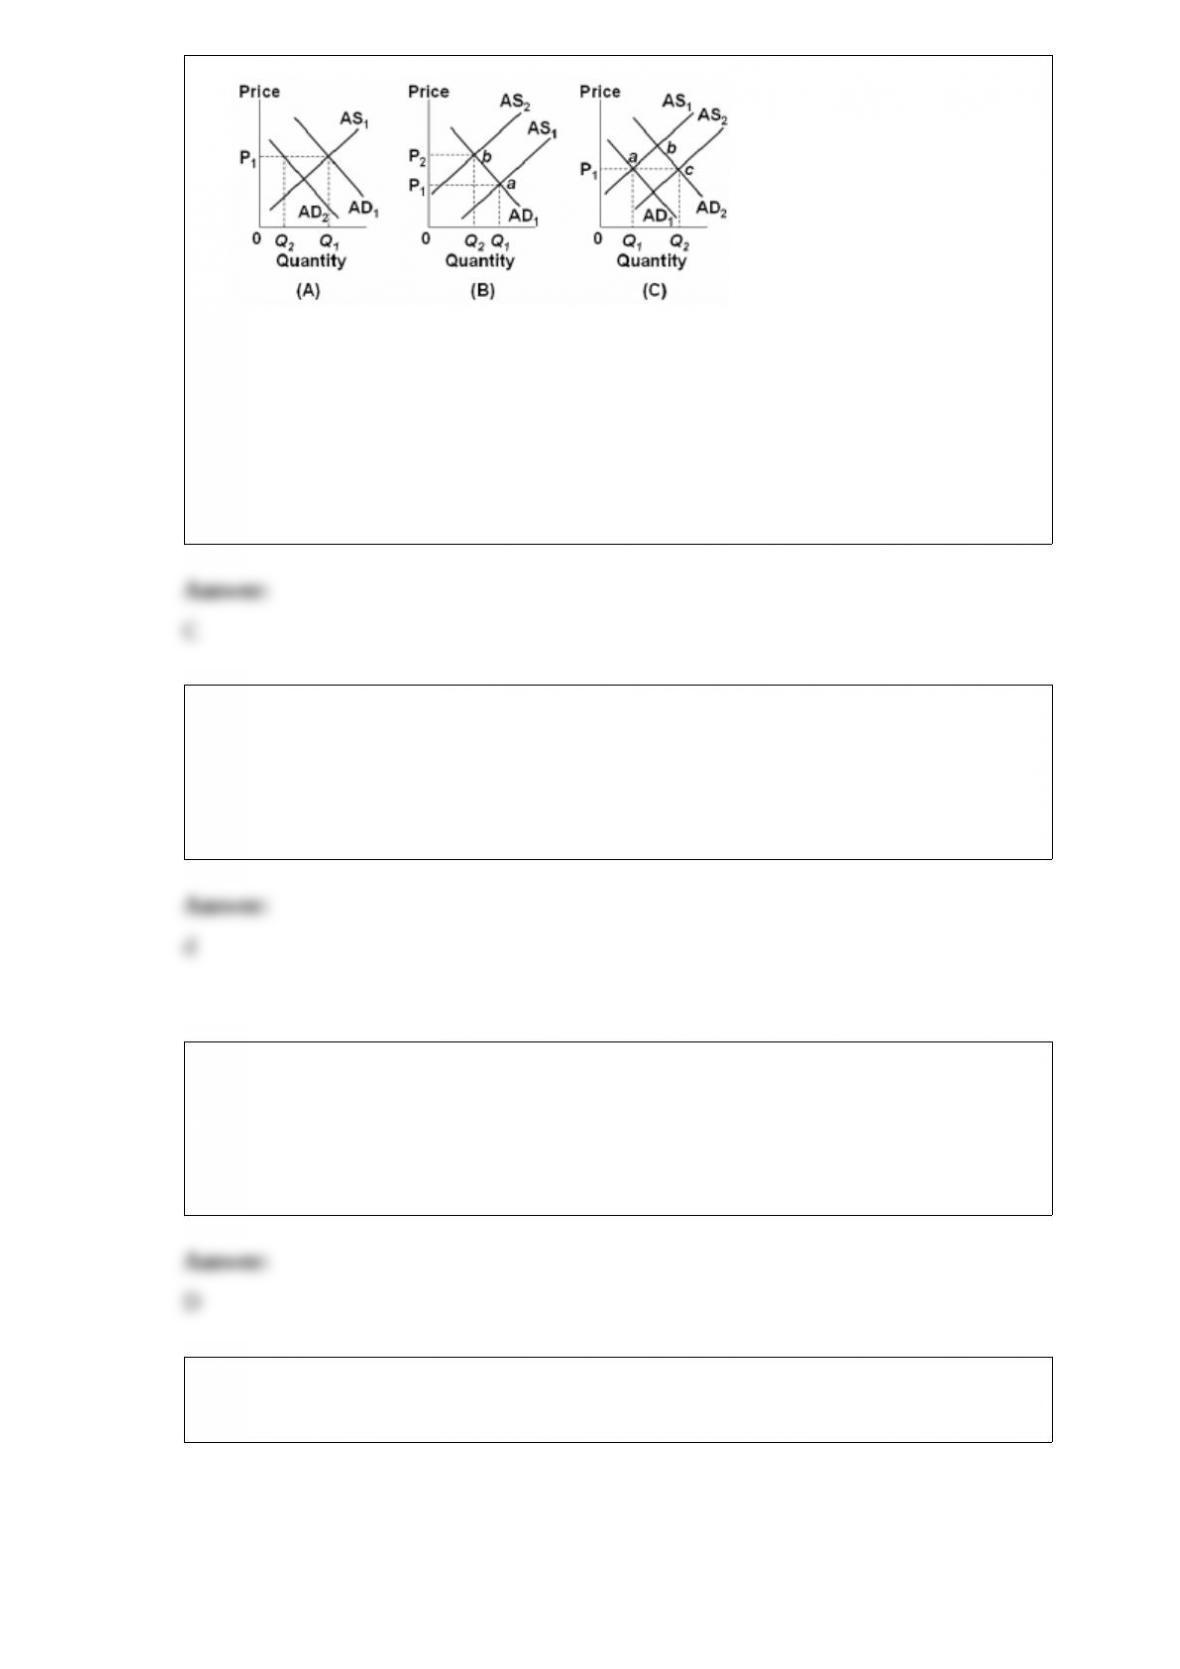
Refer to the above diagrams, in which AD1 and AS1are the “before” curves and AD2
and AS2 are the “after” curves. Growth, full-employment and price stability is depicted
by:
A.panel (A) only.
B.panel (B) only.
C.panel (C) only.
D.panels (B) and (C).
2) marginal utility:
a.is equal to total utility divided by the number of units consumed.
b.is equal to total utility if the demand curve is linear.
c.increases as more of a product is consumed.
d.diminishes as more of a product is consumed.
3) The paper money used in the United States is:
A.National Bank Notes.
B.Treasury Notes.
C.United States Notes.
D.Federal Reserve Notes.
4) answer the next question(s) on the basis of the following data. all figures are in
billions of dollars.
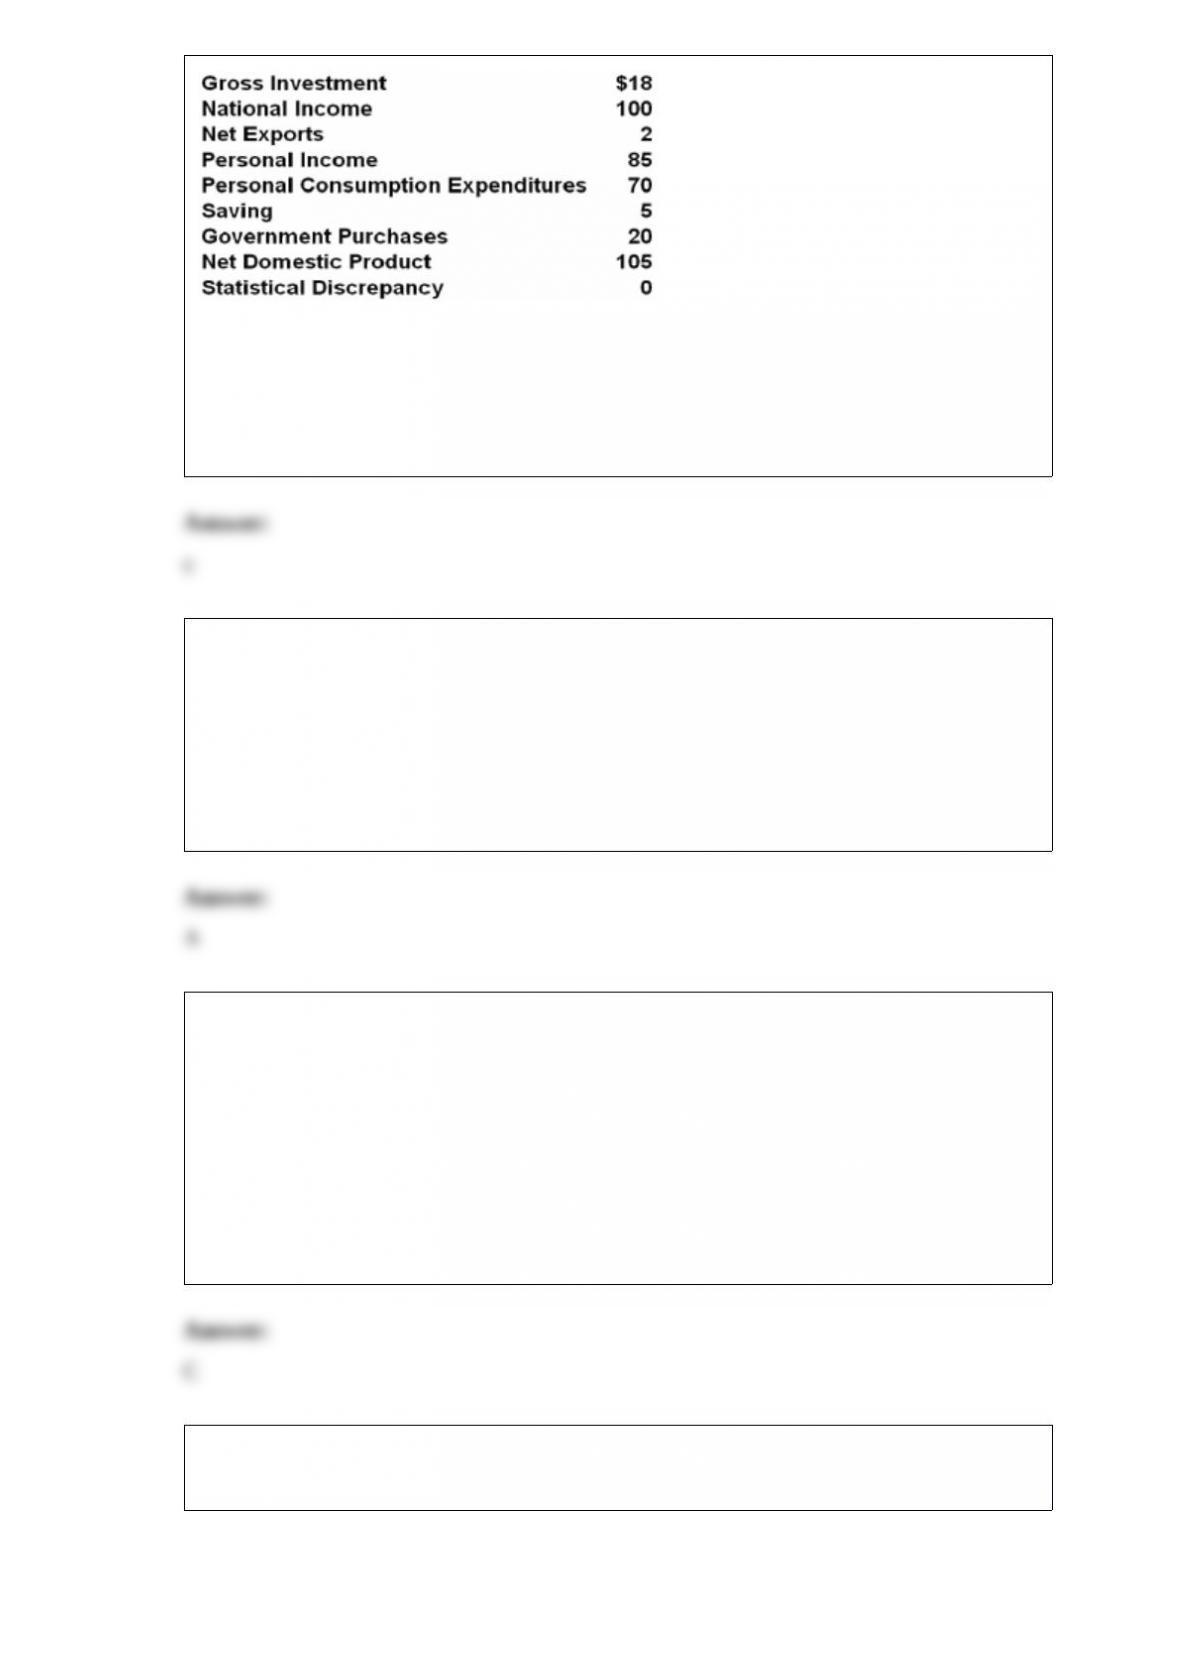
the gross domestic product for the above economy is:
a.$100.
b.$95.
c.$110.
d.$107.
5) A balance-of-payments deficit occurs:
A.when a nation must make an inpayment of official reserves to its capital and financial
account.
B.whenever a nation has a goods and services deficit.
C.whenever a nation has a goods and services surplus.
D.when a nation must make an outpayment of official reserves from its capital and
financial account.
6) A farmer who has fixed amounts of land and capital finds that total product is 24 for
the first worker hired; 32 when two workers are hired; 37 when three are hired; and 40
when four are hired. The farmer’s product sells for $3 per unit and the wage rate is $13
per worker.
Refer to the above information. How many workers should the farmer hire?
A.1
B.2
C.3
D.4
7) The following production possibilities data for two countries, Alpha and Beta, which
have populations of equal size.
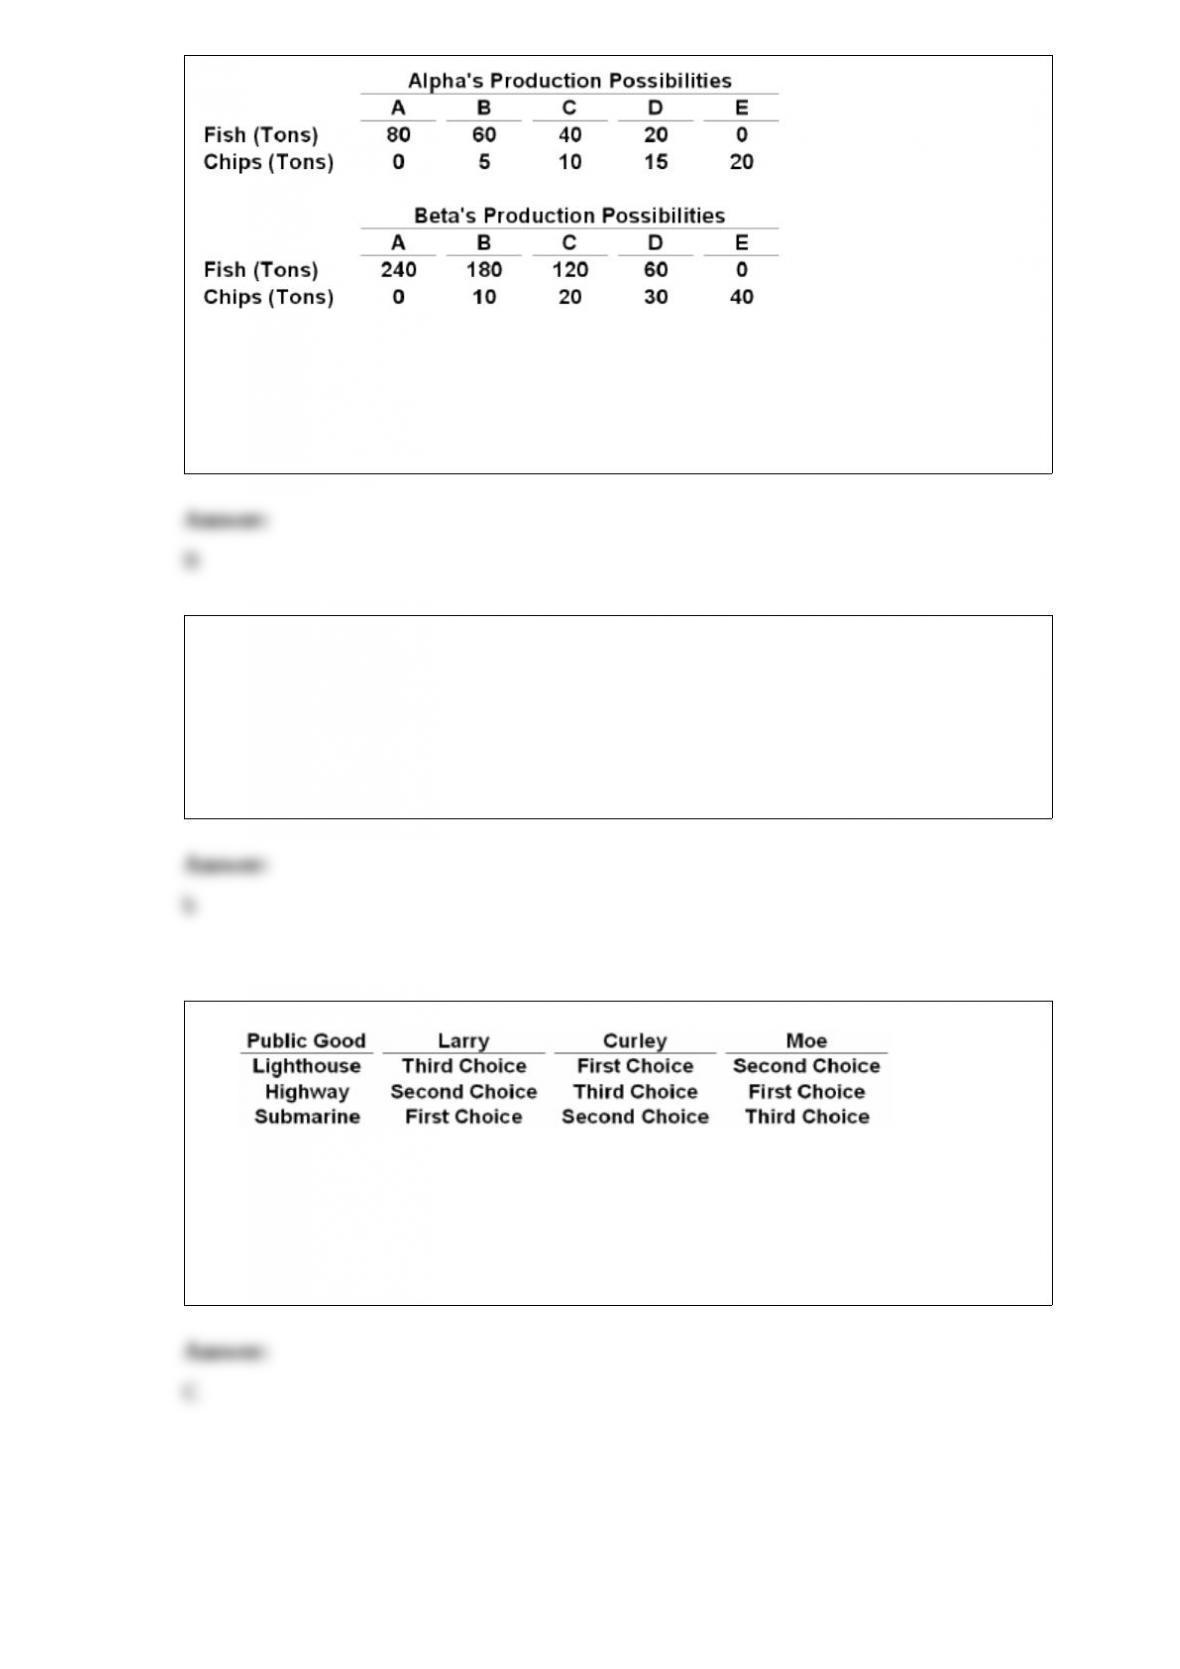
Refer to the above data. The domestic opportunity cost of:
A.producing a ton of chips in Alpha is 1/5 of a ton of fish.
B.producing a ton of chips in Beta is 6 tons of fish.
C.catching a ton of fish in Alpha is 5 tons of chips.
D.catching a ton of fish in Beta is 6 tons of chips.
8) since the signing of the north american free trade agreement (nafta) in 1993:
a.total employment in the united states has slightly declined.
b.total employment in the united states has greatly increased.
c.mexican exports to the united states have declined.
d.productivity growth in canada, mexico, and the united states has stagnated.
9)
The information contained in the above table illustrates:
A.political logrolling.
B.the median-voter model.
C.the paradox of voting.
D.the Coase theorem.
10)
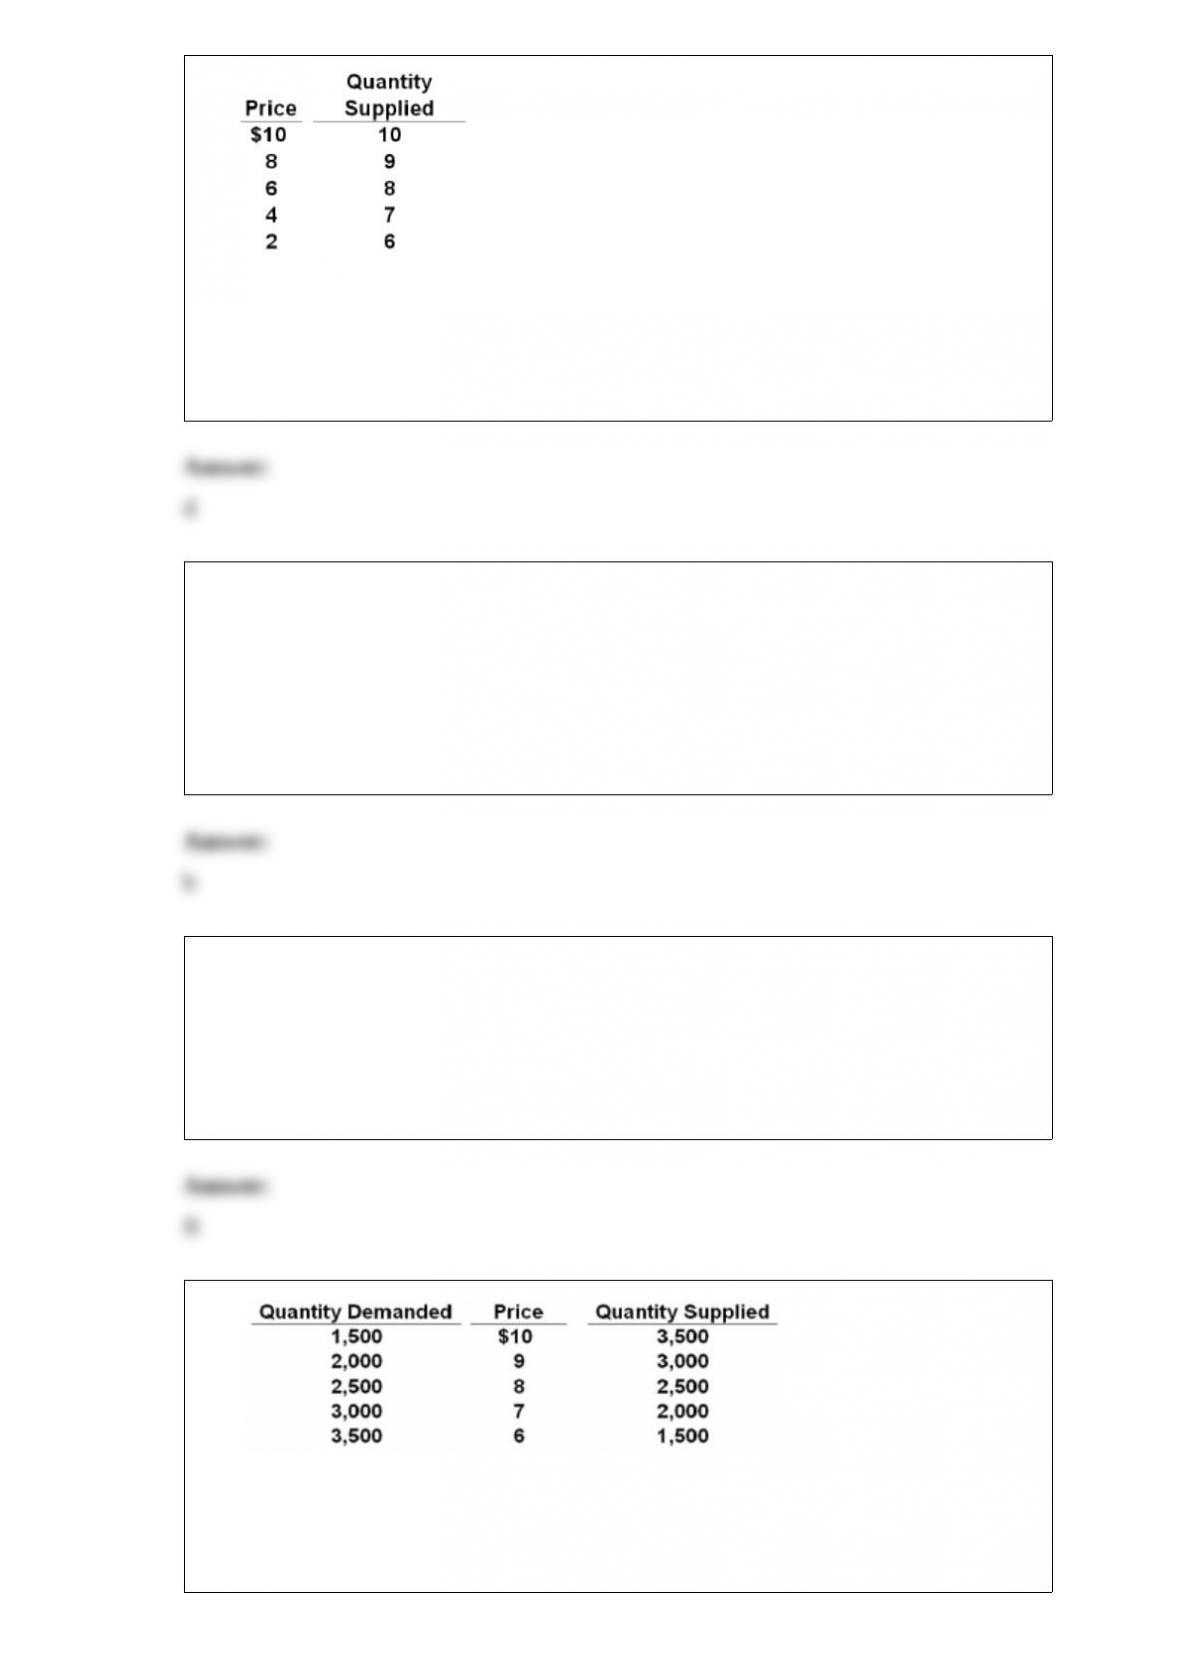
refer to the above table. over the $6-$4 price range, supply is:
a.perfectly elastic.
b.elastic.
c.perfectly inelastic.
d.inelastic.
11) suppose that a 20 percent increase in the price of normal good y causes a 10 percent
decline in the quantity demanded of normal good x. the coefficient of cross elasticity of
demand is:
a.negative and therefore these goods are substitutes.
b.negative and therefore these goods are complements.
c.positive and therefore these goods are substitutes.
d.positive and therefore these goods are complements.
12) A minority person is prohibited from entering certain high paying occupations. This
illustrates:
A.human-capital discrimination.
B.the crowding model.
C.the taste-for-discrimination model.
D.statistical discrimination.
13)
Refer to the above data. If government levies a per unit excise tax of $1 on suppliers of
this product, equilibrium price and quantity will be:
A.$9 and 3,000.
B.$7.50 and 2,250.
C.$8.50 and 2,250.
D.$7 and 3,000.
14) in comparing gdp data over a period of years, a difference between nominal and real
gdp may arise because:
a.of changes in trade deficits and surpluses.
b.the length of the workweek has declined historically.
c.the price level may change over time.
d.depreciation may be greater or smaller than gross investment.
15)
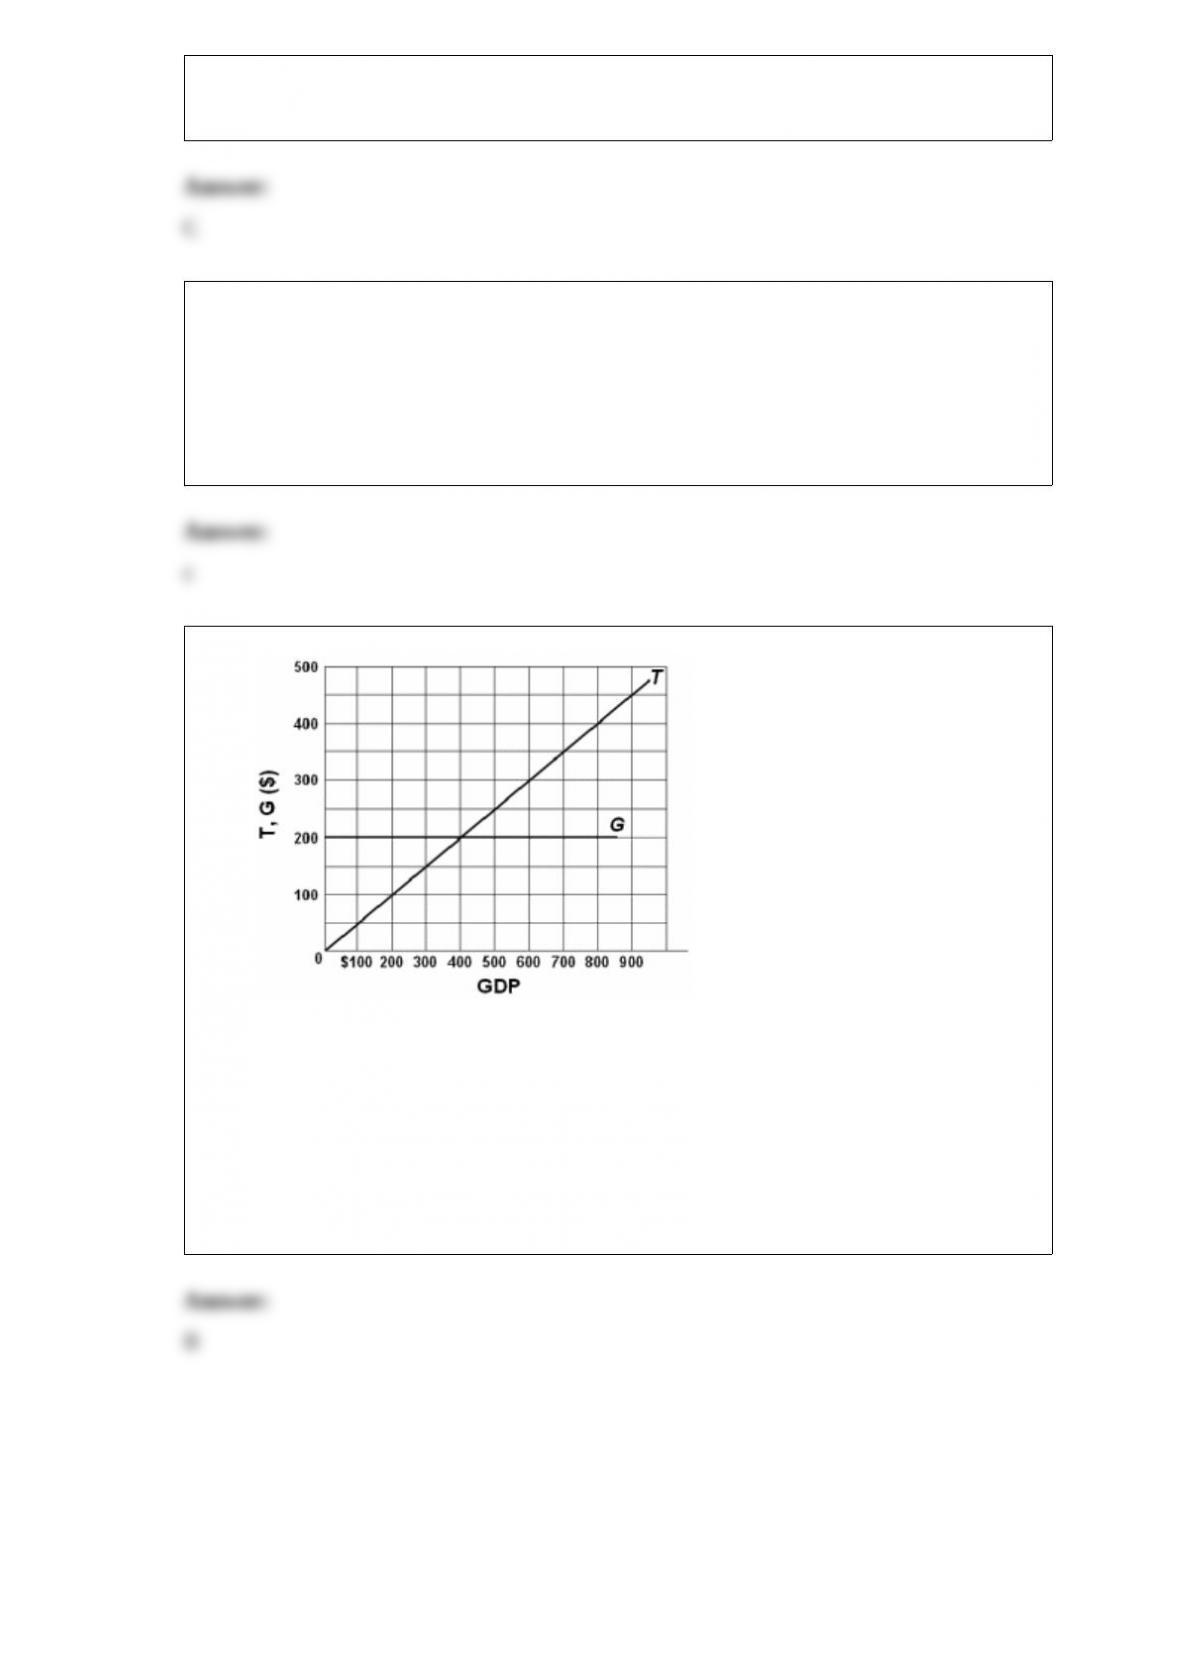
Refer to the above diagram in which T is tax revenues and G is government
expenditures. All figures are in billions. In this economy:
A.tax revenues and government spending both vary directly with GDP.
B.tax revenues vary directly with GDP, but government spending is independent of
GDP.
C.tax revenues and government spending both vary inversely with GDP.
D.government spending varies directly with GDP, but tax revenues are independent of
GDP.
16)
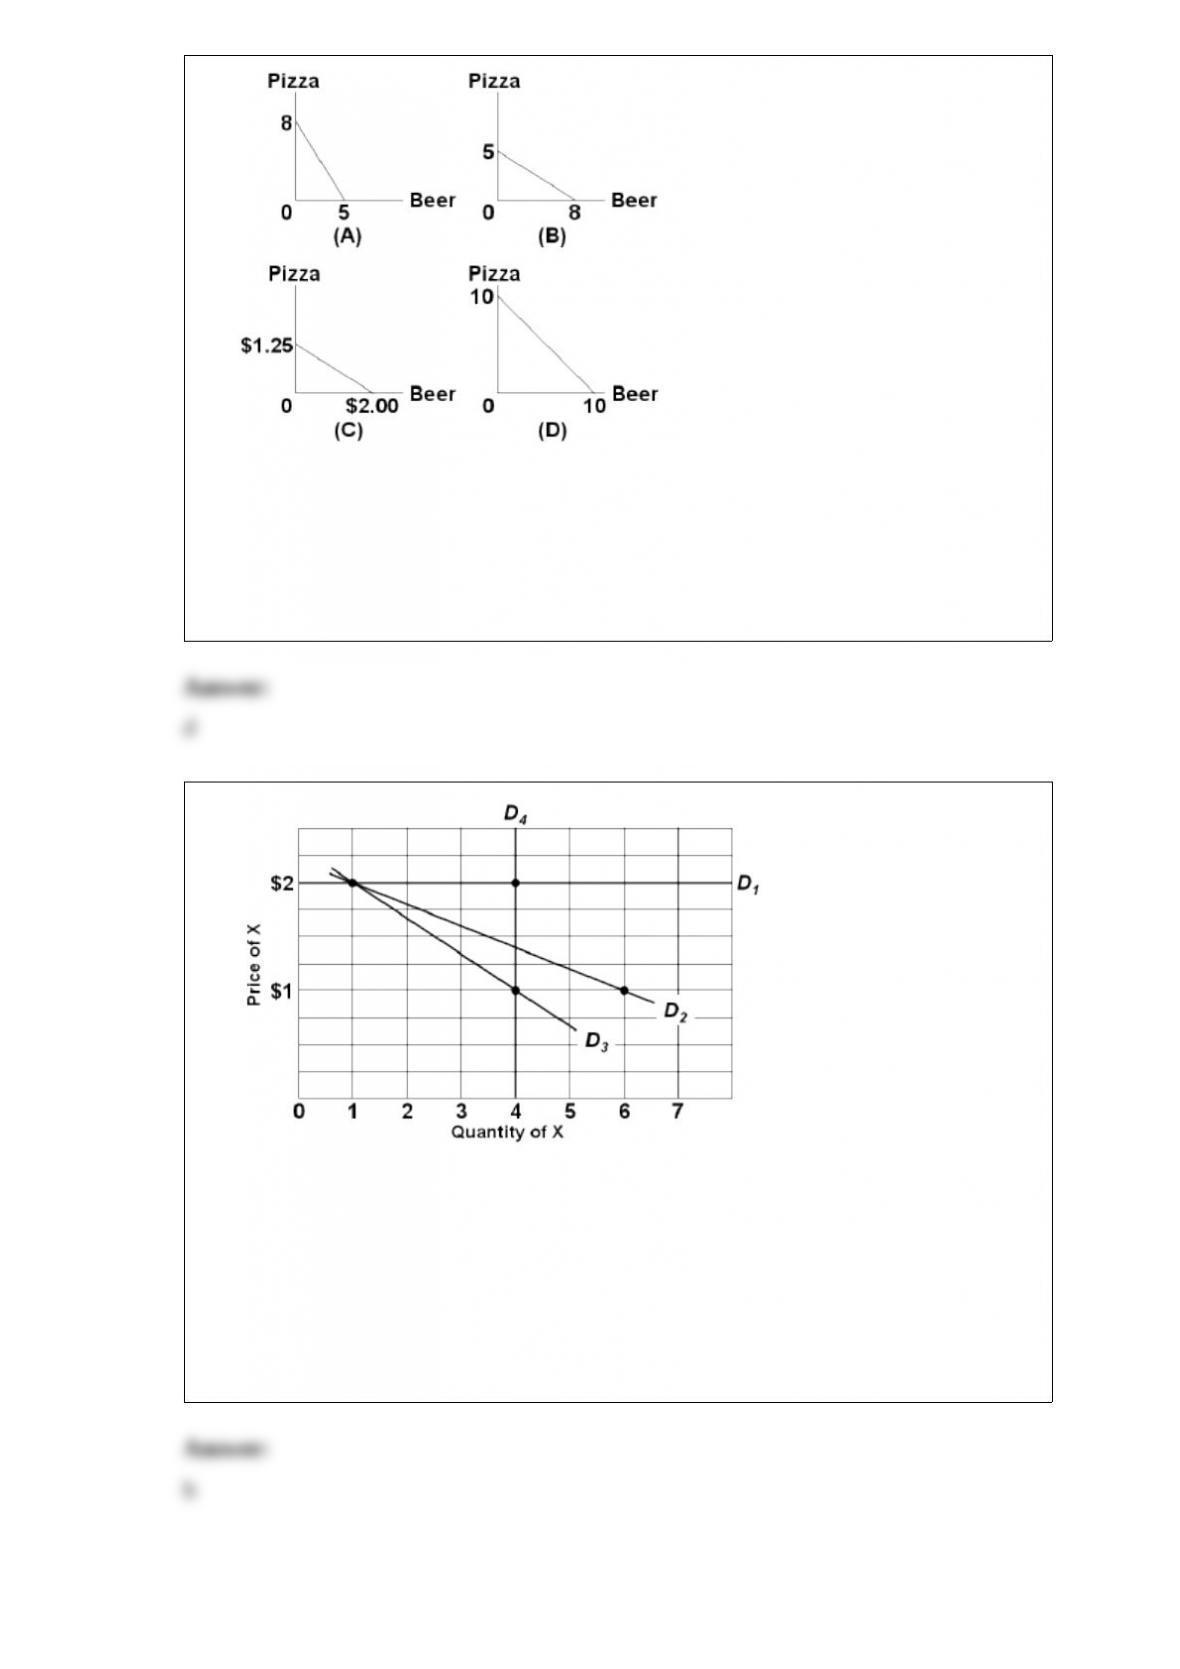
refer to the above graphs. assume that pizza is measured in slices and beer in pints. in
which of the graphs is the opportunity cost of a pint of beer equal to one slice of pizza?
a.graph a
b.graph b
c.graph c
d.graph d
17)
refer to the above table and graph. suppose that the price of x falls from $2 to $1, while
the price of y remains at $4. which of the following represents the demand curve for x if
the consumer has money income of $10 to spend on x and y?
a.d1
b.d2
c.d3
d.d4
18)
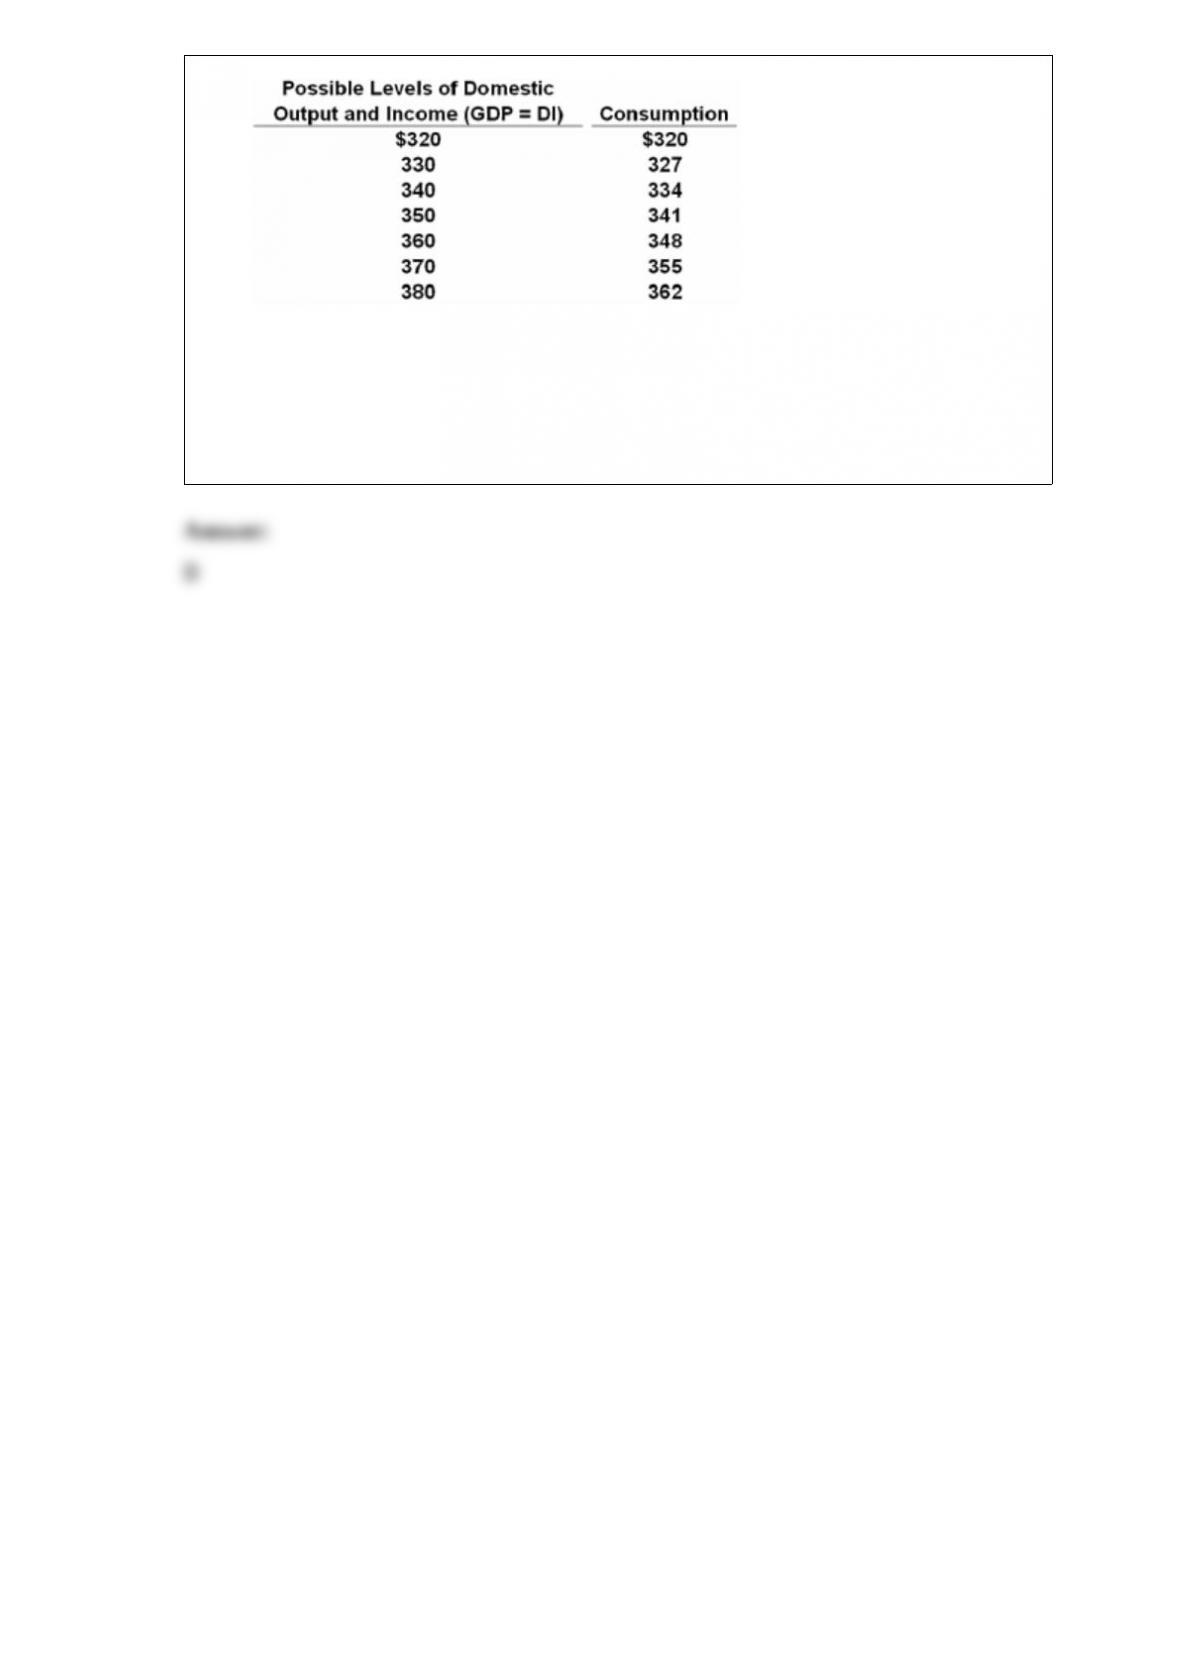
Refer to the above data. The MPS is:
A.7/10.
B.3/10.
C.2/5.
D.3/5.