
1) The outer loop of the circular-flow diagram represents the flows of dollars in the
economy. Which of the following does not appear on the outer loop?
a.wages
b.income
c.capital
d.rent
2) Discrimination is usually not a profit-maximizing strategy.
a.True
b.False
3) If firms in an oligopoly agree to produce according to the monopoly outcome, they
will produce the same level of output as they would produce in a Nash equilibrium.
a.True
b.False
4) During the last few decades in the United States, health officials have argued that
eating too much beef might be harmful to human health. As a result, there has been a
significant decrease in the amount of beef produced. Which of the following best
explains the decrease in production?
a.Beef producers, concerned about the health of their customers, decided to produce
relatively less beef.
b.Government officials, concerned about consumer health, ordered beef producers to
produce relatively less beef.
c.Individual consumers, concerned about their own health, decreased their demand for
beef, which lowered the equilibrium price of beef, making it less attractive to produce.
d.Anti-beef protesters have made it difficult for both buyers and sellers of beef to meet
in the marketplace.
5) Refer to Figure 9-16. The area C + D + E + F represents
a.the decrease in consumer surplus caused by the tariff.
b.the decrease in total surplus caused by the tariff.
c.the deadweight loss of the tariff minus government revenue raised by the tariff.
d.the deadweight loss of the tariff plus government revenue raised by the tariff.
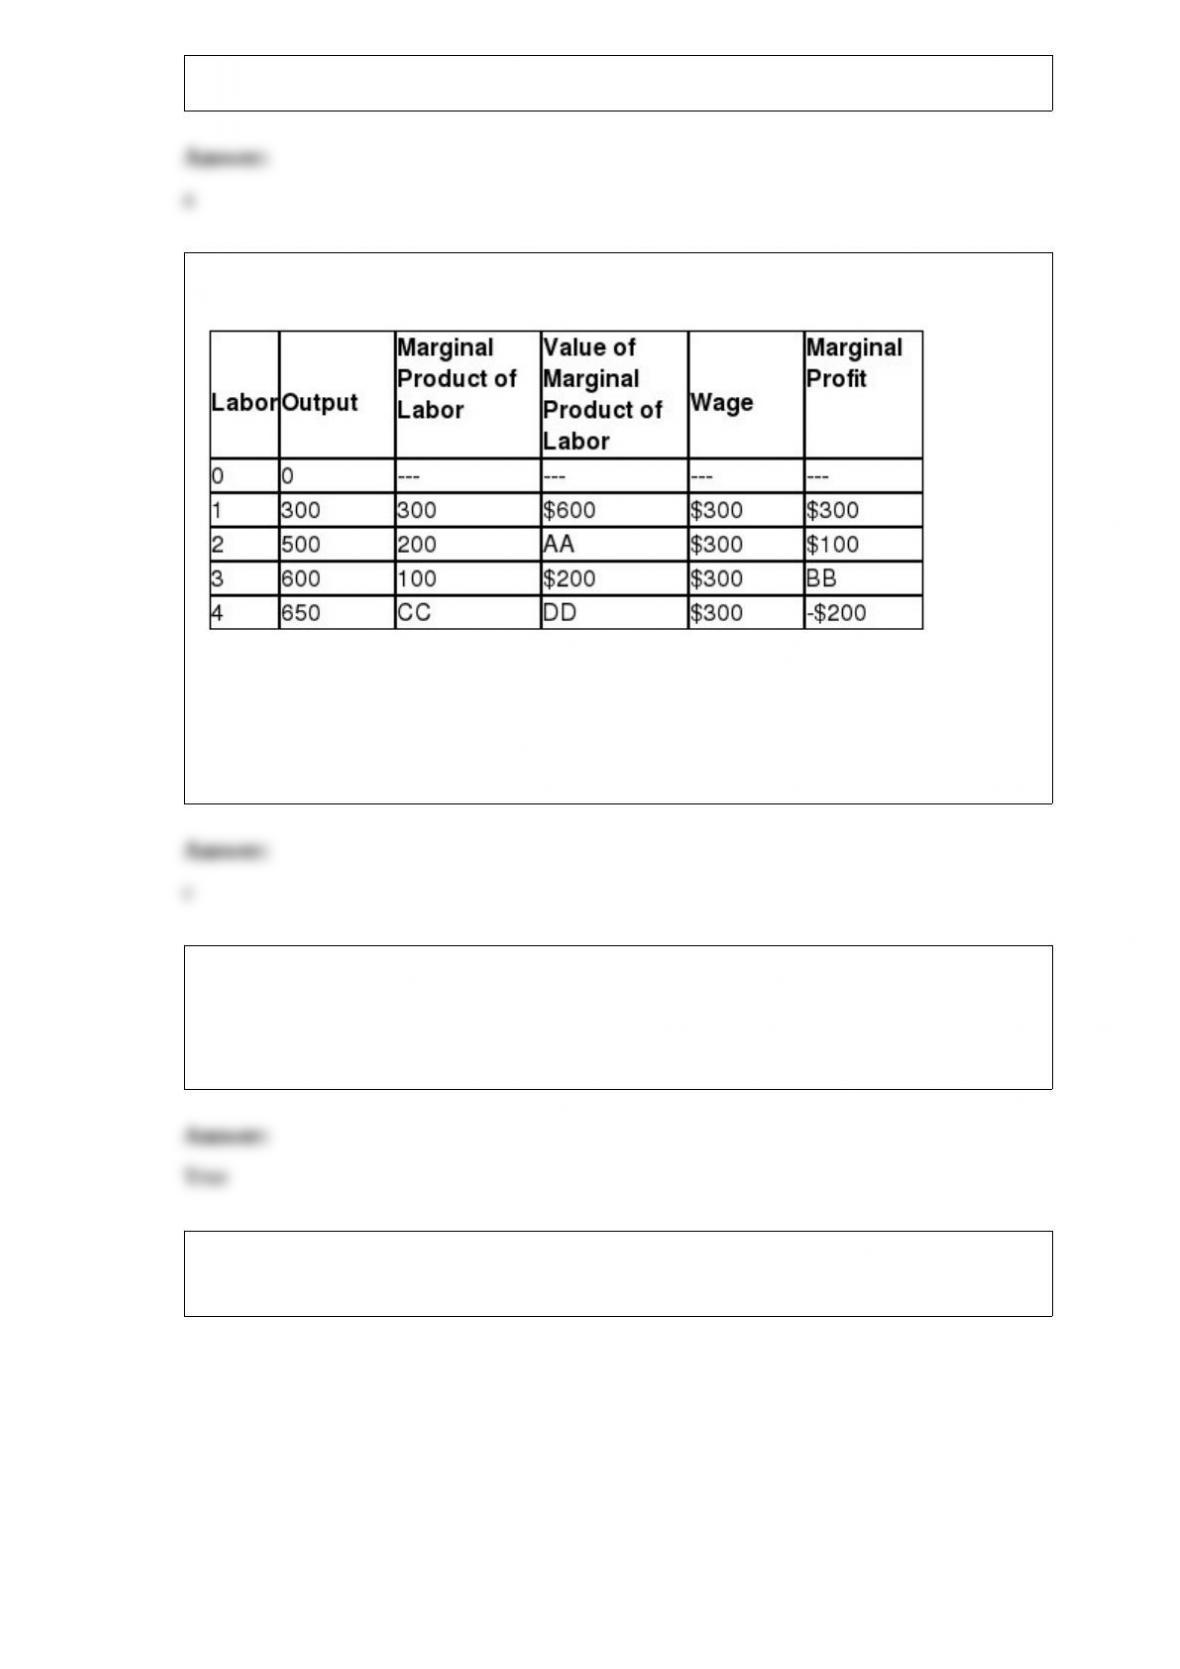
6) Table 18-6
Refer to Table 18-6. What is the value for the cell labeled DD?
a.-$100
b.$300
c.$100
d.$50
7) If we observe that when the price of chocolate increases by 10%, quantity demanded
falls by 5%, then the demand for chocolate is price inelastic.
a.True
b.False
8) The graph below represents the various combinations of ham and cheese (in pounds)
that the nation of Bonovia could produce in a given month.
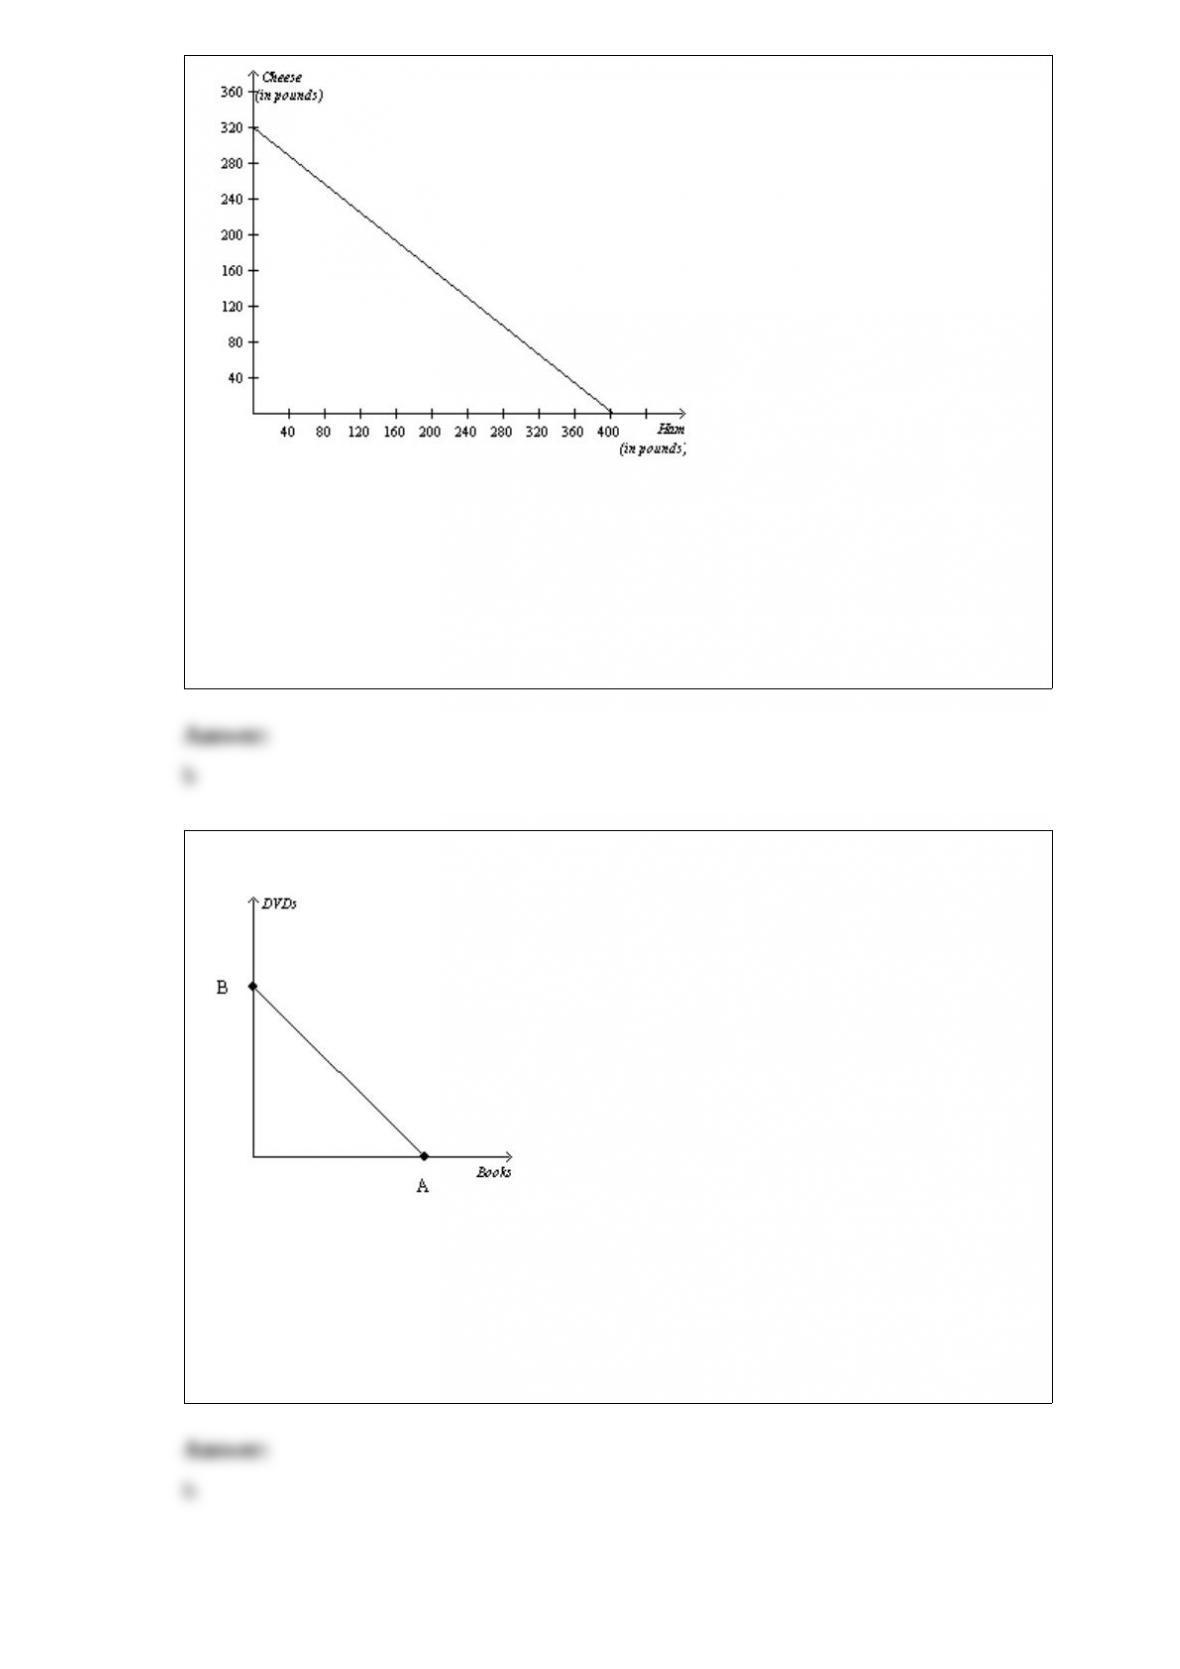
In the nation of Cropitia, the opportunity cost of a pound of cheese is 1.5 pounds of
ham. Bonovia and Cropitia both can gain from trading with one another if one pound of
cheese trades for
a.1.0 pound of ham.
b.1.4 pounds of ham.
c.2.1 pounds of ham.
d.All of the above are correct.
9) Figure 21-7
Refer to Figure 21-7. Suppose a consumer has $200 in income, the price of a book is
$5, and the price of a DVD is $10. What is the value of B?
a.40
b.20
c.10
d.2
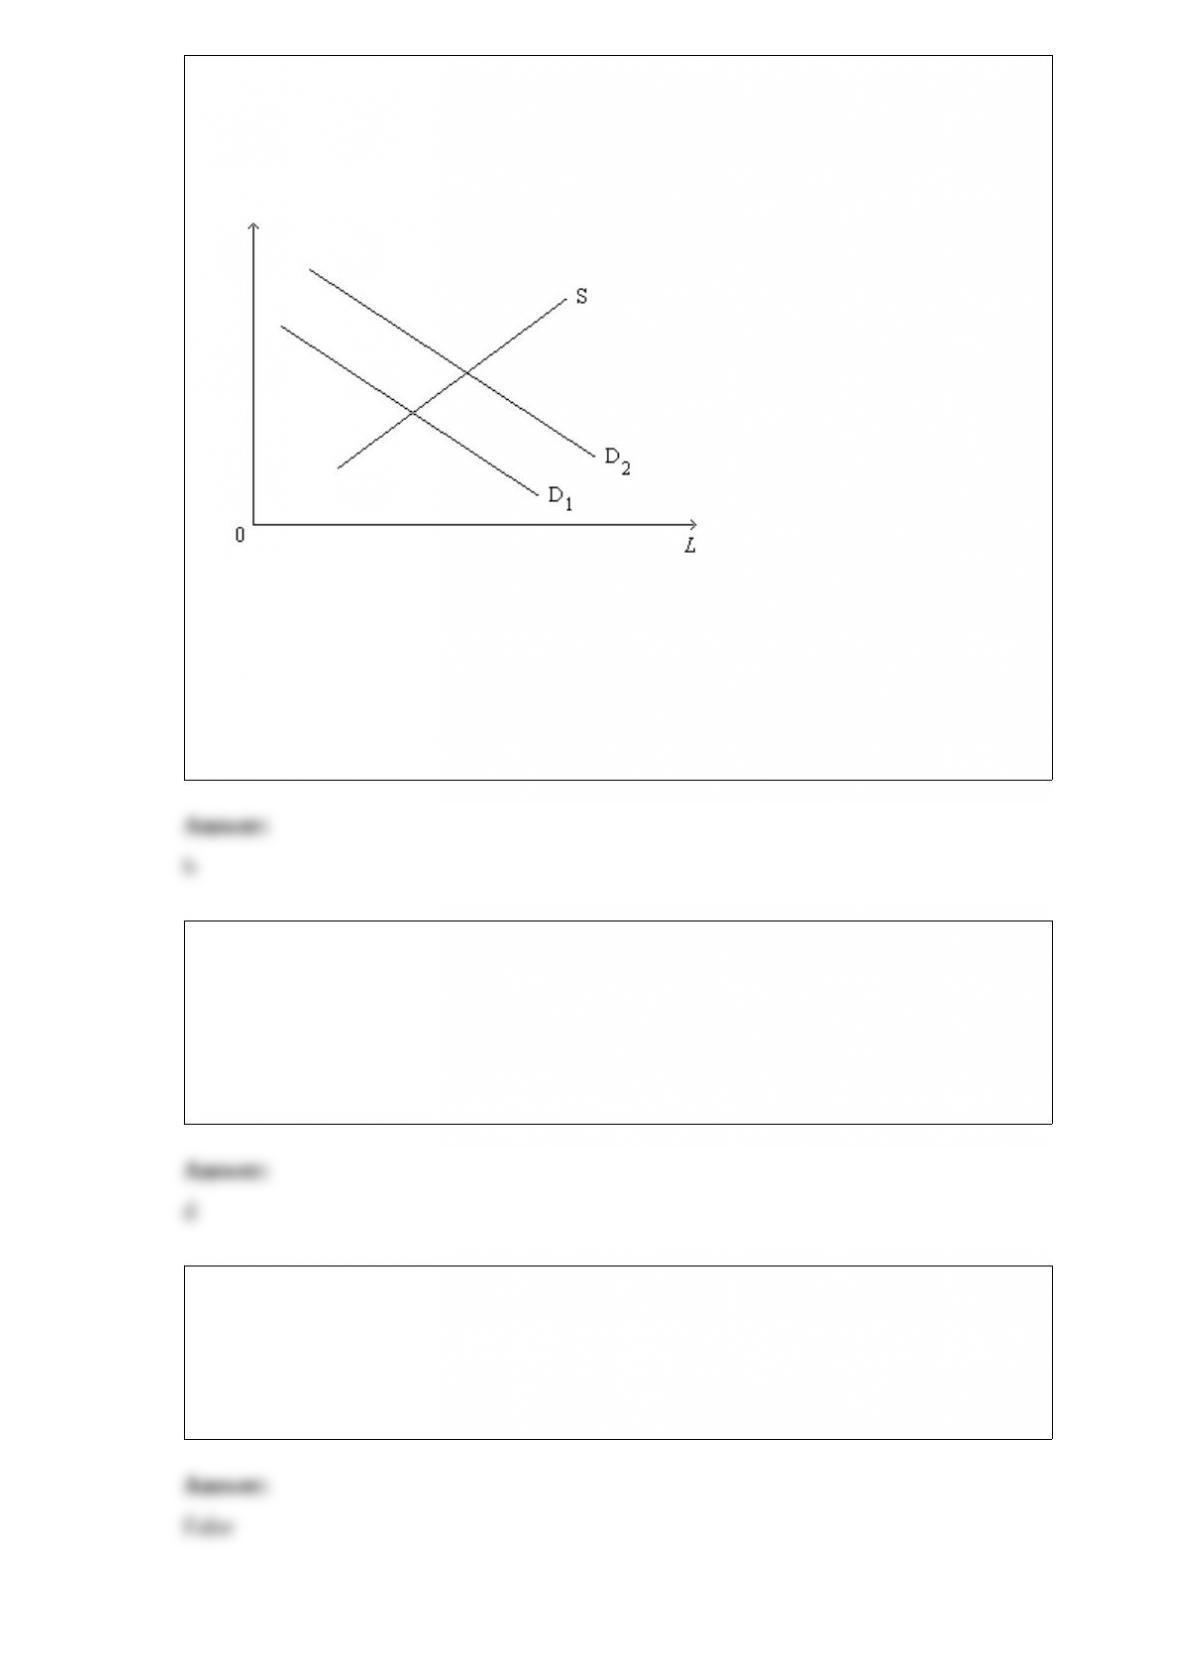
10) Figure 18-8
This figure below shows the labor market for automobile workers. The curve labeled S
is the labor supply curve, and the curves labeled D1 and D2 are the labor demand
curves. On the horizontal axis, L represents the quantity of labor in the market.
Refer to Figure 18-8. Which of the following is a possible explanation of the shift of
the labor-demand curve from D1 to D2?
a.The wage earned by automobile workers increased.
b.The price of automobiles increased.
c.The opportunity cost of leisure, as perceived by automobile workers, decreased.
d.Large segments of the population changed their tastes regarding leisure versus work.
11) Which of the following is least likely to be the reason women are underrepresented
in the economics profession?
a.labor market discrimination
b.the choice of women to select other occupations
c.cultural bias in primary and secondary education
d.the inability of women to solve problems in economics
12) If Argentina exports oranges to the rest of the world, Argentina’s producers of
oranges are worse off, and Argentina’s consumers of oranges are better off, as a result of
trade.
a.True
b.False