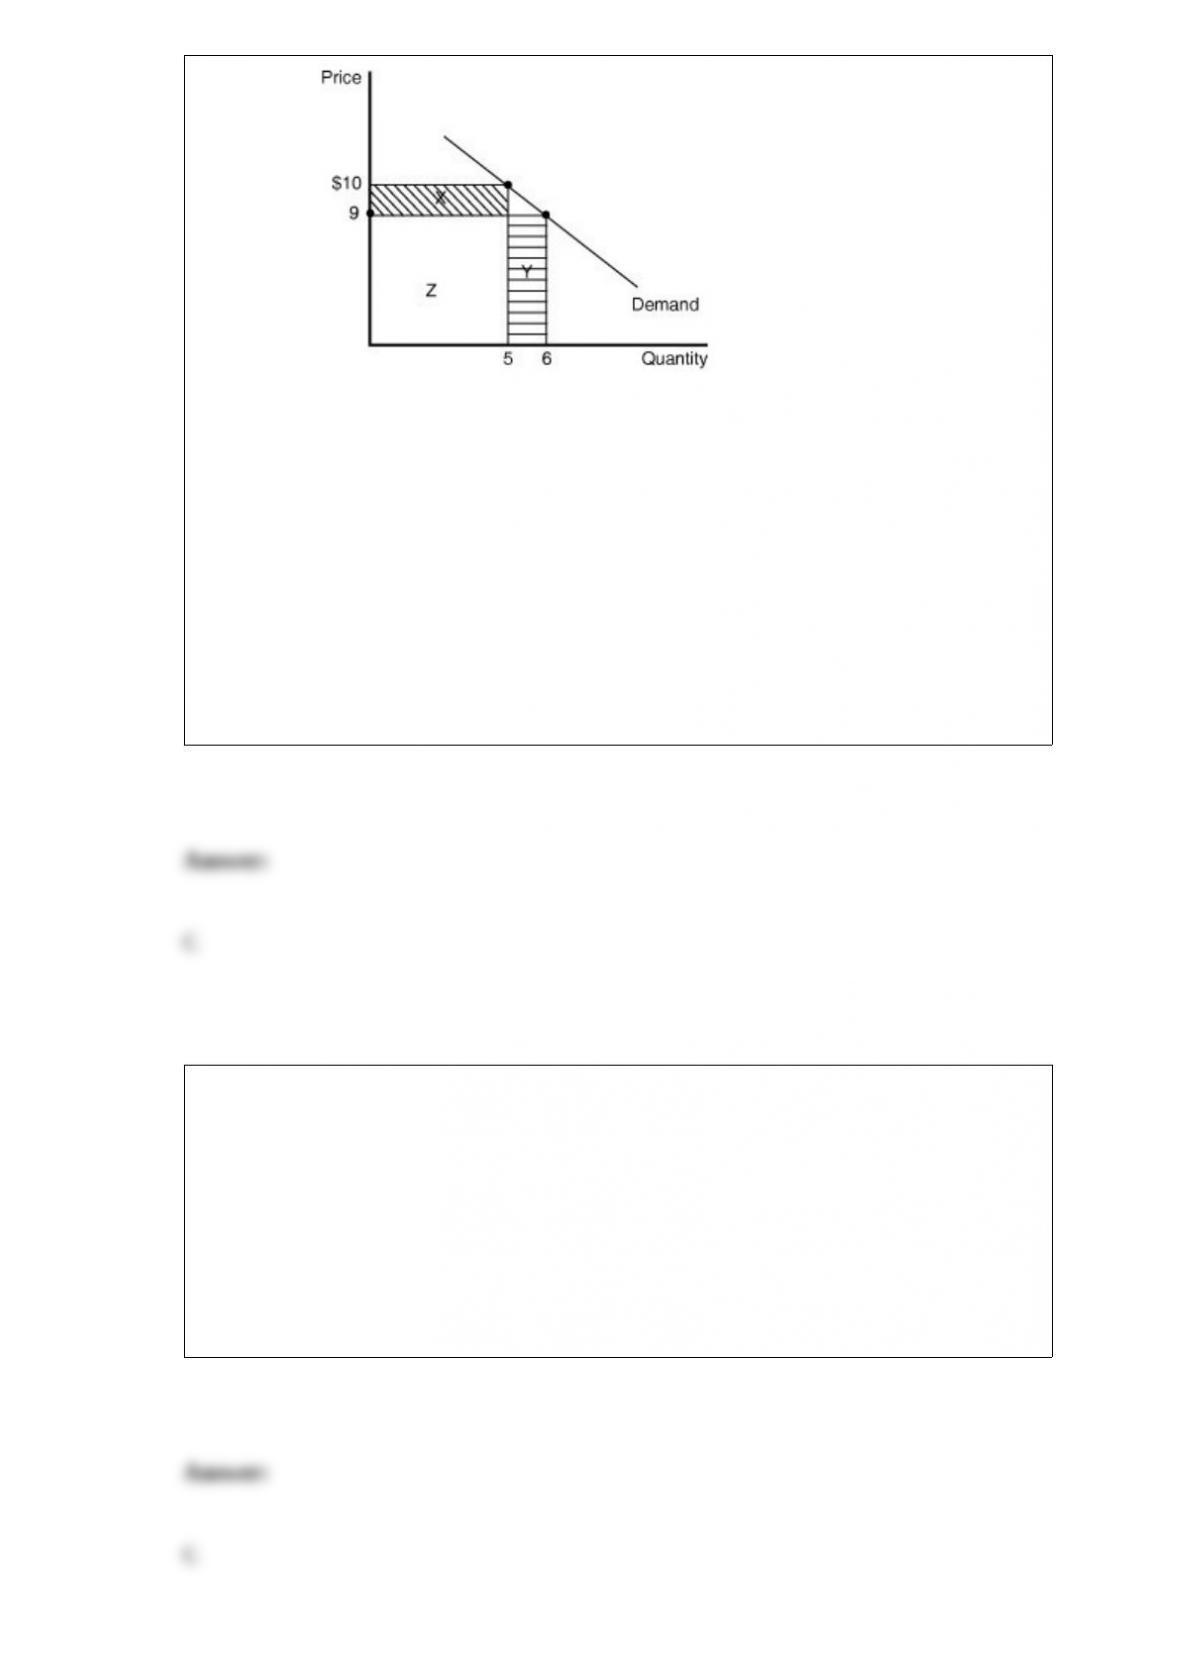
Figure 13-3
The marginal revenue from one additional unit sold is the sum of the gain in revenue
from selling the additional unit and the loss in revenue from having to charge a lower
price to sell the additional unit. Based on the diagram in the figure,
A) X represents the gain (price effect) and Y the loss (output effect).
B) X + Z represents the loss (output effect) and Y the gain (price effect).
C) Y represents the gain (output effect) and X the loss (price effect).
D) X represents the loss (price effect) and Y + Z the gain (output effect).
Free trade refers to trade between countries
A) that is without shipping costs.
B) that is licensed by both governments.
C) that is without restrictions.
D) of products which are free to low-income consumers.

If New Yorkers decrease their purchases of French champagne, assuming all else
remains constant, this will ________ of the United States.
A) increase the balance of trade
B) decrease net exports
C) decrease the current account balance
D) increase the trade deficit
E) increase the balance of payments
Based on projections from the U.S. Census Bureau and the Congressional Budget
Office,
A) there will be a significant increase in the demand for health care by the year 2020.
B) there will be a significant decrease in the demand for health care by the year 2020.
C) there will be no significant change in the demand for health care by the year 2020.
D) the change in the supply of health care will more than make up for the change in
demand for health care by the year 2020.
Table 16-3

Why is a dollar today more valuable than a dollar a year from now?
A) The dollar today can be immediately used to buy something.
B) A dollar a year from now will likely have less purchasing power because of inflation.
C) The unknown future is riskier than the known present.
D) all of these
Which of the following countries actually experienced negative economic growth from
1960 to 2010?
A) Israel
B) Singapore
C) Niger
D) Malaysia

Which of the following is motivated by an efficiency concern?
A) In December 2006, the Bush administration restarted a short-term housing assistance
program for victims of Hurricane Katrina.
B) Each year, the University of Notre Dame conducts a lottery to parcel out the 30,000
seats available to contributors, former athletes and parents in the 80,000-seat stadium.
C) The United Network for Organ Sharing advocates a system of rationing scarce
kidneys that would favor young patients over old in an effort to wring more life out of
donated organs.
D) The federal government’s housing choice voucher program assists very low-income
families, the elderly, and the disabled to afford decent, safe, and sanitary housing in the
private market.
The median voter model implies that
A) many people will be satisfied with the amount of spending on government funded
projects.
B) many people will be dissatisfied with the amount of spending on government funded
projects.
C) people in the political middle will be dissatisfied with the amount of spending on
government funded projects.
D) spending on government funded projects reflects the preferences of only those far
away from the median.

Figure 5-15 Figure 5-15 shows
the market for Atlantic salmon, a common resource. The current market equilibrium
output of Q1 is not the economically efficient output. The economically efficient output
is Q2. The current market equilibrium output is partly the result of overfishing. In that
case, what does S1 represent?
A) the private marginal benefit of harvesting salmon
B) the social marginal benefit of harvesting salmon
C) the private marginal cost of harvesting salmon
D) the social marginal cost of harvesting salmon
The Apple iPhone is sold in a box labeled “Made in China.” A study by economists at
the Asian Development Bank found the value of the iPhone components China
________ U.S. firms is ________ the value of assembling the iPhones in Chinese
factories.
A) exports to; equal to
B) exports to; greater than
C) imports from; less than
D) imports from; greater than
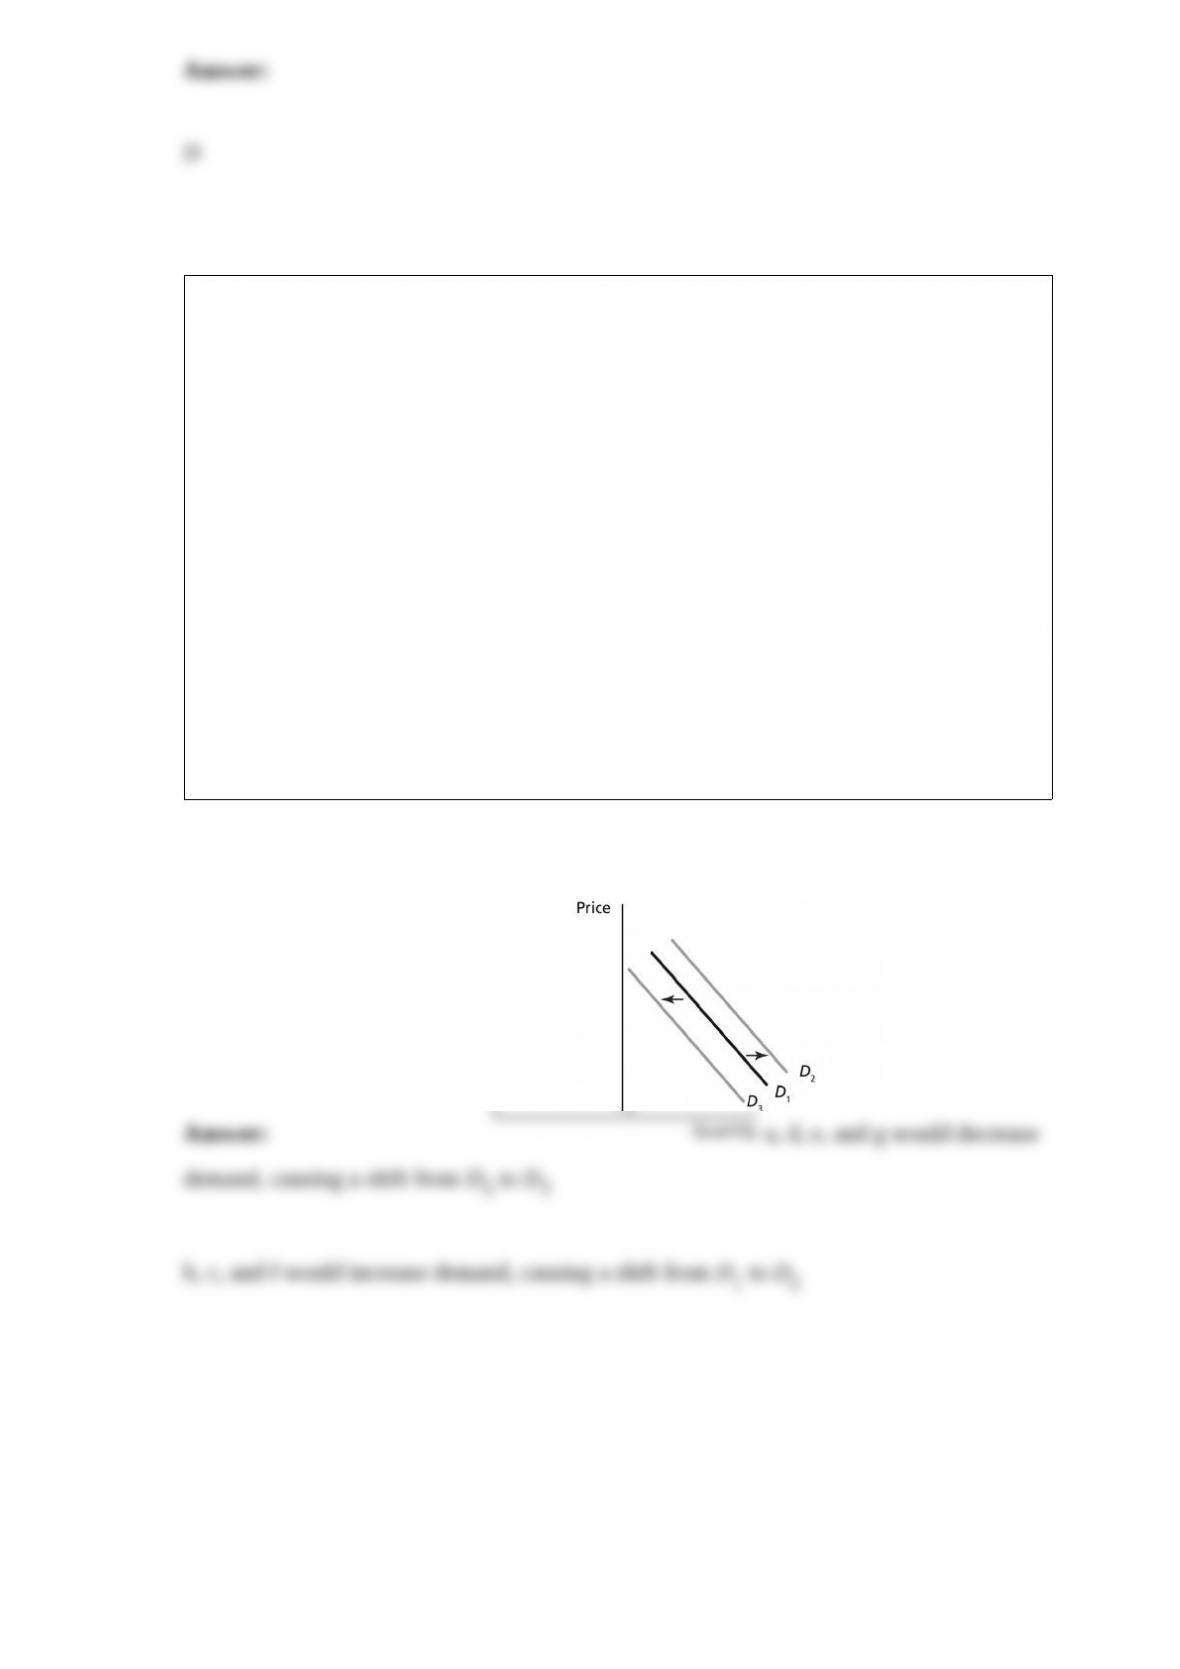
Draw a demand curve and label it D1. On the graph, illustrate an increase in demand
and a decrease in demand, and label the curves D2 and D3, respectively. Starting on
demand curve D1, explain the shift that would result from each of the following events:
a. a decrease in income and the good is a normal good
b. a decrease in income and the good is an inferior good
c. an increase in the price of a substitute good
d. an increase in the price of a complementary good
e. a decrease in the taste for the good
f. an increase in population
g. a decrease in the expected future price of the good