
1) In international financial transactions, what are the only two things that individuals
and firms can exchange?
A.currency and real assets.
B.services and manufactured goods.
C.preexisting assets and currently produced goods and services.
D.currency and currently produced goods and services.
2) The next three questions refer to the information in the following table.
(a)What would price and quantity be if the market were closed to international trade?
What would the domestic and foreign quantity supplied be if it were open to
international trade and the world price was $6?
(b)If the world price was $4 and a tariff of $2 were placed on the product, what would
be the total revenues going to domestic producers, foreign producers (after-tax), and the
government? Explain.
(c)Given a world price of $4, what would be the difference in the total revenue received
by foreign producers with a $2 per unit tariff compared with a quota of 20,000 units?

3)
refer to the above diagram, in which s1 and d1 represent the original supply and
demand curves and s2 and d2 the new curves. in this market:
a.supply has decreased and equilibrium price has increased.
b.demand has increased and equilibrium price has decreased.
c.demand has decreased and equilibrium price has decreased.
d.demand has increased and equilibrium price has increased.
4) In the table below, assume a monopsonist has the marginal-revenue-product schedule
for a particular type of labor given in columns 1 and 2 and that the supply schedule for
labor is that given in columns 1 and 3.
(a)Compute the firms total labor costs at each level of employment and the marginal
labor cost of each unit of labor, and enter these figures in columns 4 and 5.
(b)How many units of labor will the firm hire? What will be the wage rate?
(c)If this firm hired labor in a competitive labor market, what would be the wage rate
and number of workers hired?
5) In 2006, a household with an annual income of $100,000 would find itself in the:
A.second lowest quintile of the household income distribution.
B.third quintile of the household income distribution.
C.fourth quintile of the household income distribution.
D.fifth (highest) quintile of the household income distribution.

6) when externalities cause substantial positive benefits for third parties, a competitive
market:
a.underallocates resources to the production of the good.
b.overallocates resources to the production of the good.
c.is allocatively efficient.
d.compensates people for the value of the benefits that these third parties receive.
7) the profit-maximizing output of a pure monopoly is economically inefficient because
in equilibrium:
a.price equals minimum average total cost.
b.marginal revenue equals marginal cost.
c.marginal cost exceeds price.
d.price exceeds marginal cost.
8) the demand for commodity x is represented by the equation p = 10 – 0.2q and supply
by the equation p = 2 + 0.2q.
refer to the above information. the equilibrium price for x is:
a.$2.
b.$4.
c.$6.
d.$7.
9) the following production possibilities data for landia and scandia:
refer to the above data. the domestic opportunity cost of 1 fish in scandia is:
a.12 chips.
b.4 chips.
c.3 chips.
d.1 chip.
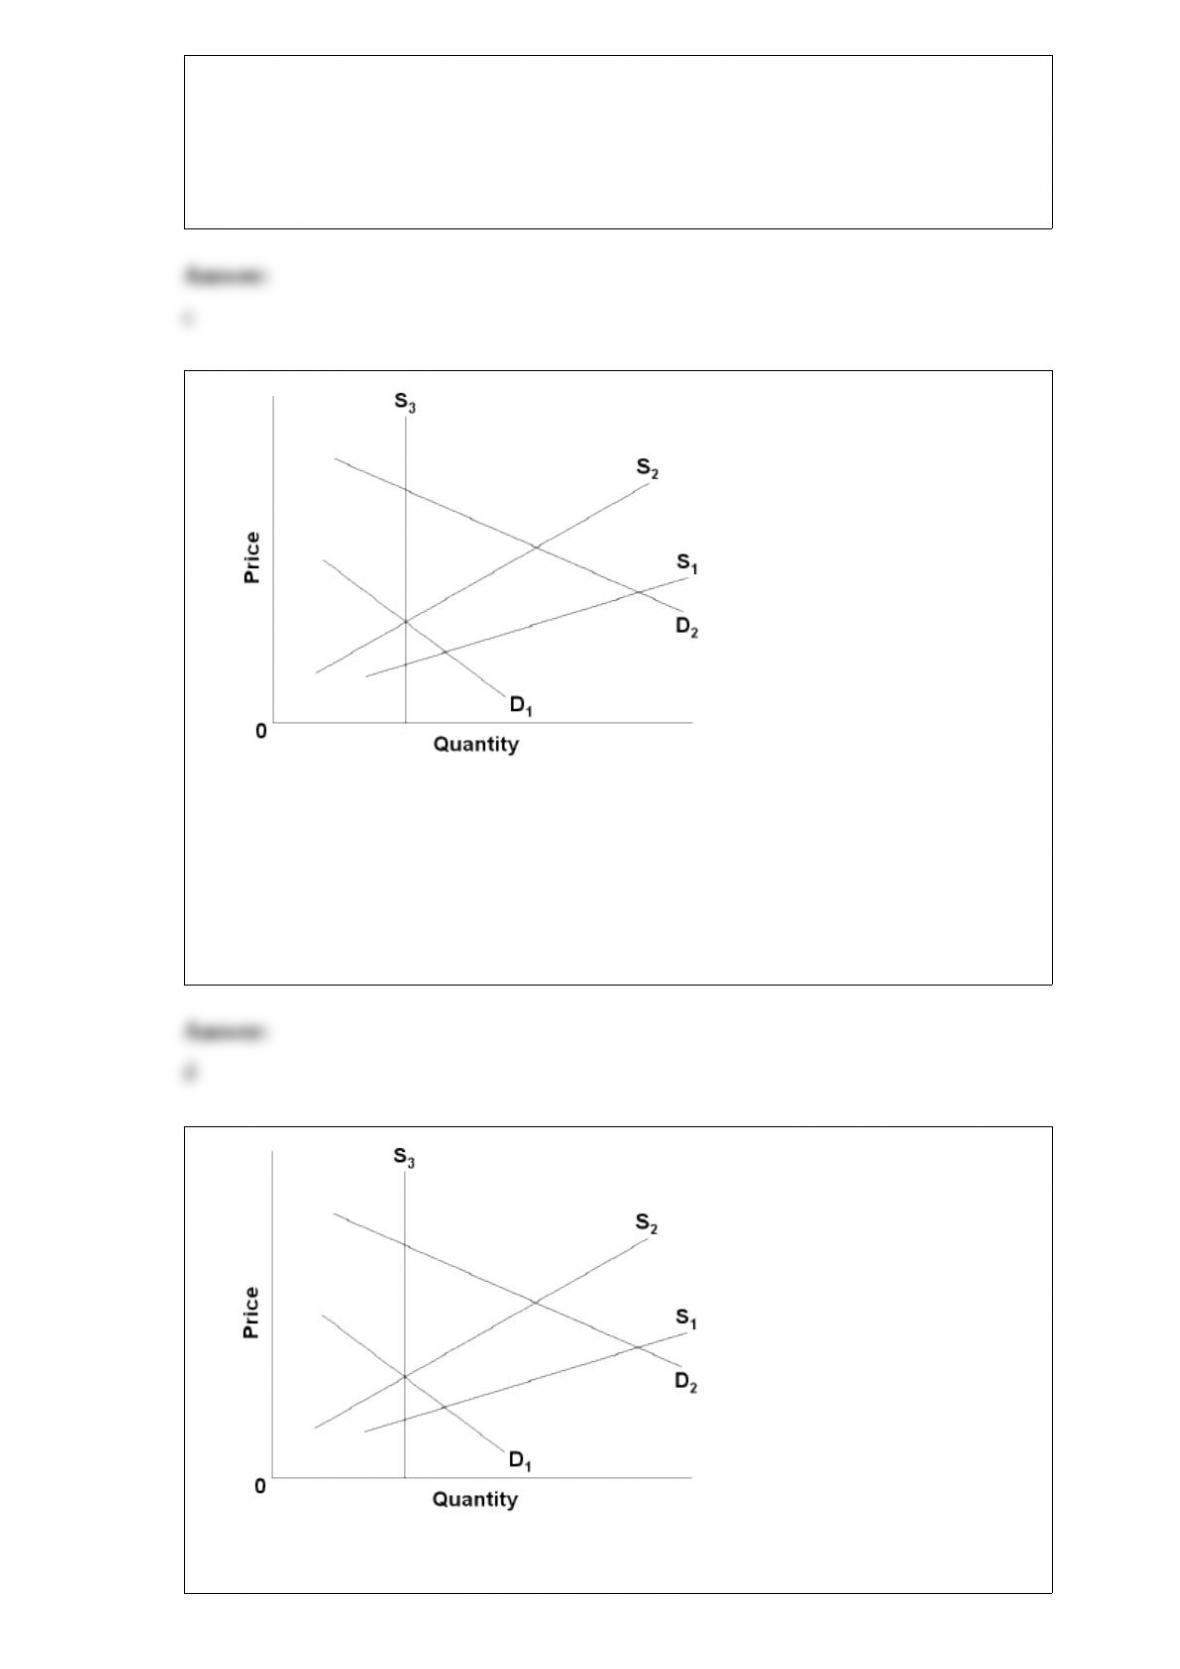
10)
the above diagram concerns supply adjustments to an increase in demand (d1to d2) in
the immediate market period, the short run, and the long run. in the long run the
increase in demand will:
a.have no effect on either equilibrium price or quantity.
b.increase equilibrium price, but not equilibrium quantity.
c.increase equilibrium quantity, but not equilibrium price.
d.increase both equilibrium price and quantity.
11)
the above diagram concerns supply adjustments to an increase in demand (d1to d2) in
the immediate market period, the short run, and the long run. supply curves s1, s2, and
s3apply to the:
a.immediate market period, long run, and short run respectively.
b.immediate market period, short run, and long run respectively.
c.long run, short run, and immediate market period respectively.
d.short run, long run, and immediate market period respectively.
12) If the MPC in an economy is .9, a $1 billion increase in government spending will
ultimately increase consumption by:
A.$1 billion.
B.$.9 billion.
C.$10 billion.
D.$9 billion.
13) in performing its stabilization function, it may be appropriate for the nation’s central
bank (the federal reserve in the united states) to take actions to:
a.increase taxes to reduce inflation.
b.increase interest rates to reduce inflation.
c.reduce government spending to reduce inflation.
d.increase subsidies to businesses to reduce unemployment.
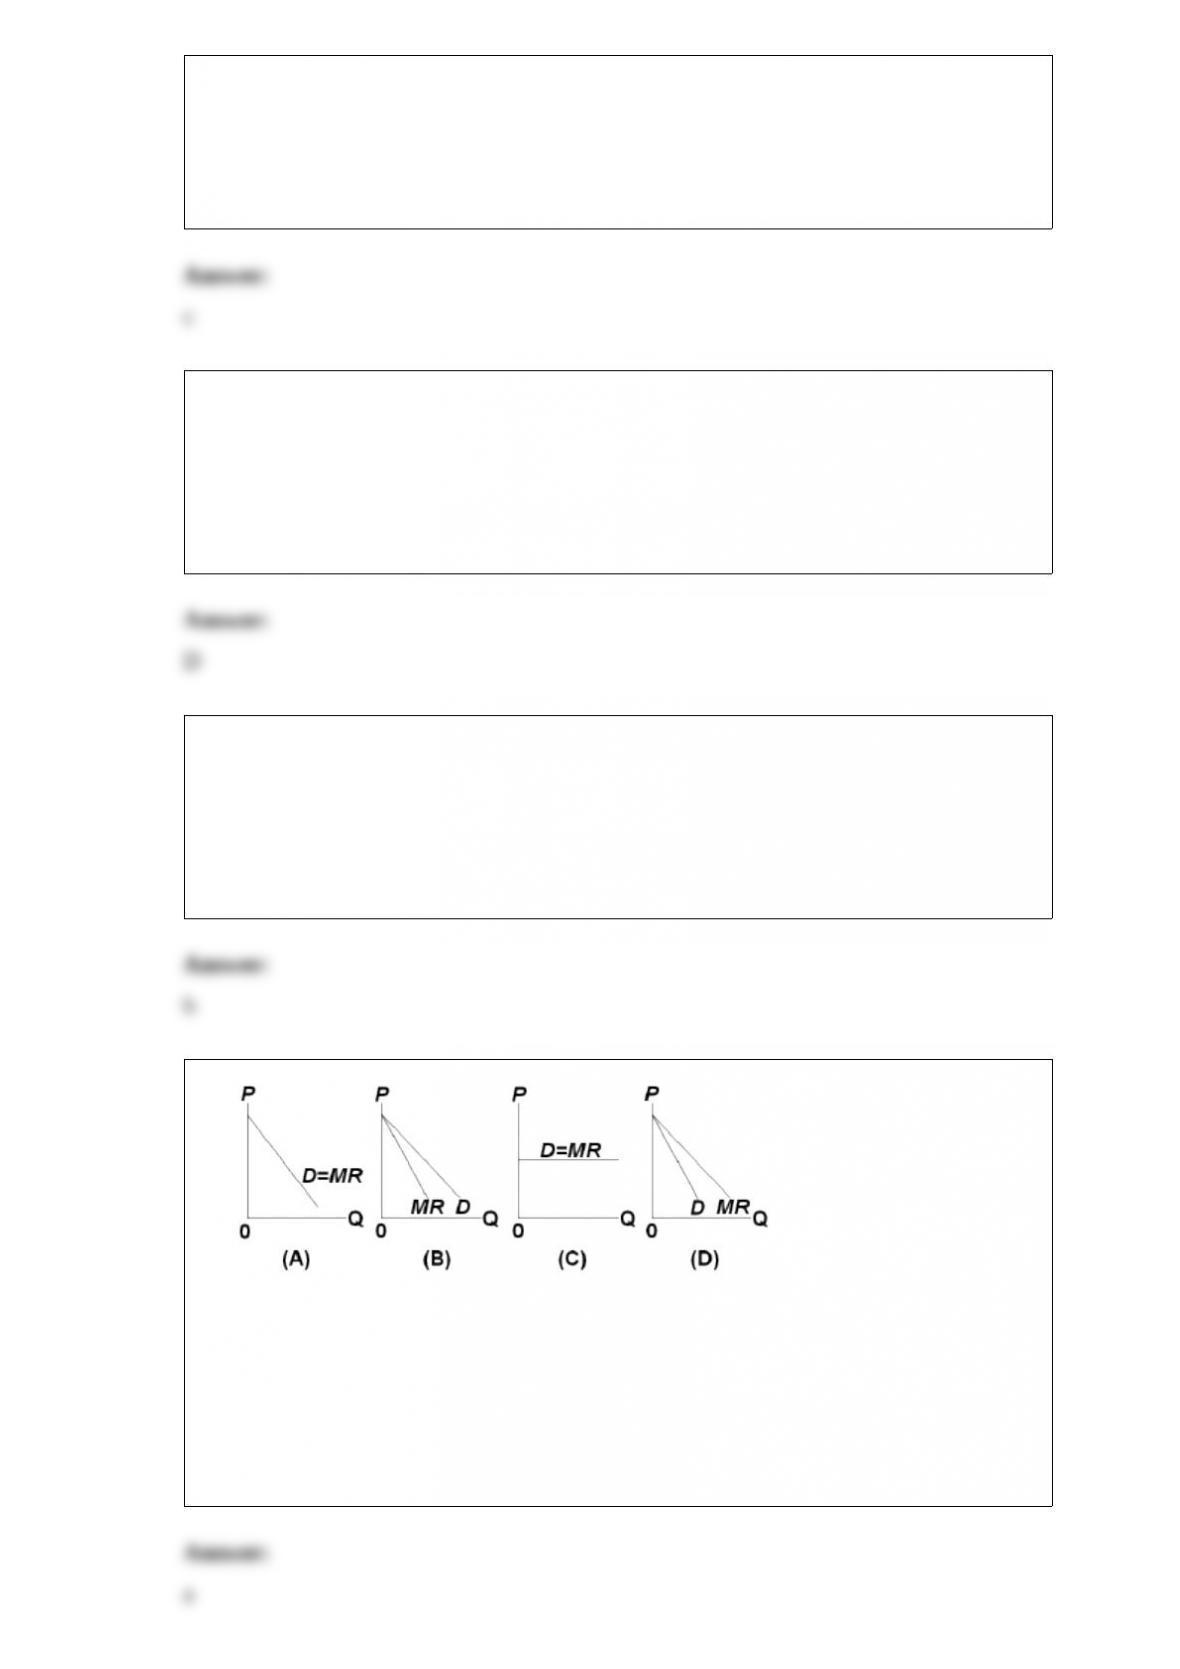
14)
which of the above diagrams correctly portray the demand (d) and marginal revenue
(mr) curves of a pure monopolist that is able to price discriminate by charging each
customer their maximum willingness to pay?
a.a
b.b
c.c
d.d
15) structural unemployment:
a.is also known as frictional unemployment.
b.is the main component of cyclical unemployment.
c.is said to occur when people are waiting to be called back to previous jobs.
d.may involve a locational mismatch between unemployed workers and job openings.
16) In new classical economics, the change in output caused by a “price-level surprise”:
A.is shown as a shift of the long-run aggregate supply curve.
B.does not alter the rate of unemployment, even in the short-run.
C.is soon reversed through a shift of the short-run aggregate supply curve.
D.permanently changes the rate of unemployment.
17) Which of the following would most likely increase income inequality?
A.Improvements in public education.
B.Greater monopoly power among product sellers.
C.Greater equality in the distribution of wealth.
D.Fewer differences in working conditions across occupations.
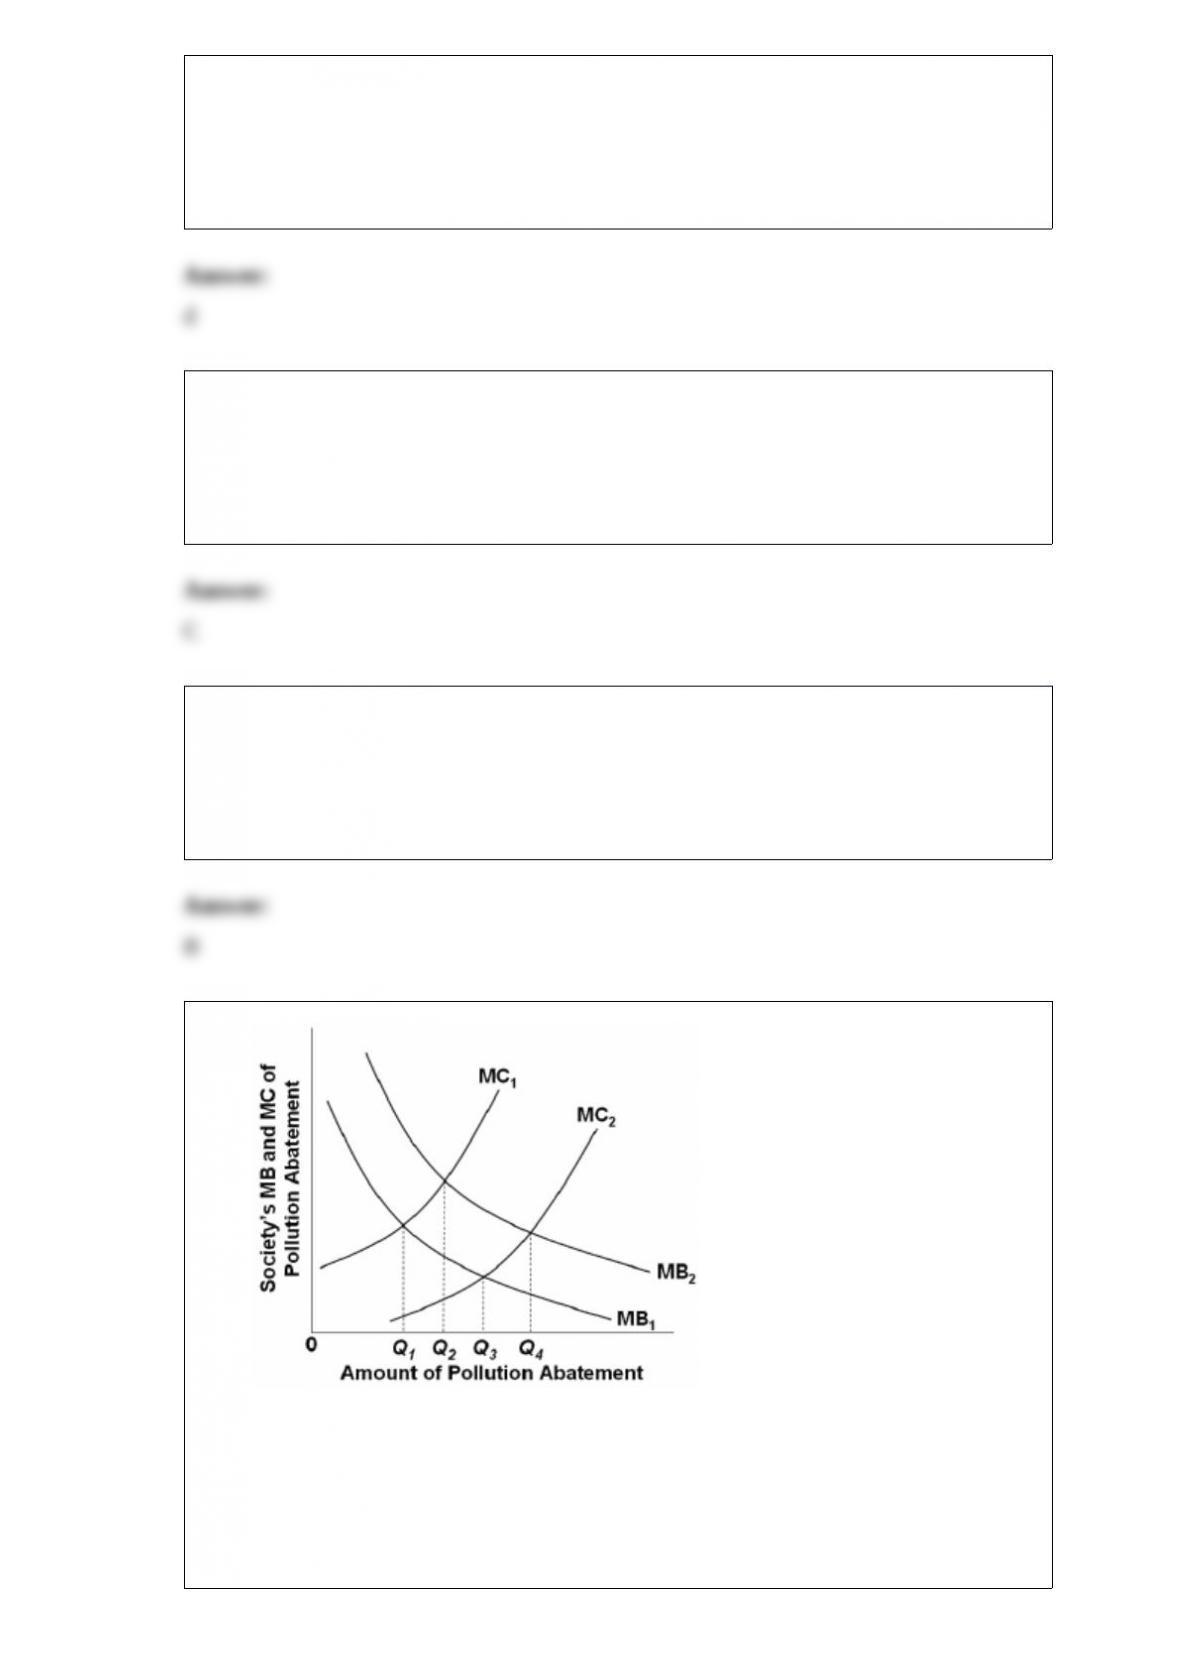
18)
Refer to the above diagram. Which one of the following might shift the marginal benefit
curve from MB1to MB2?
A.major new studies strongly linking cancer to pollution
B.improved technology for reducing pollution
C.a change in consumer tastes from manufacturing goods to services
D.a decrease in the price of recycled goods