When production reflects consumer preferences, ________ occurs.
A) allocative efficiency
B) productive efficiency
C) equity
D) efficient central planning
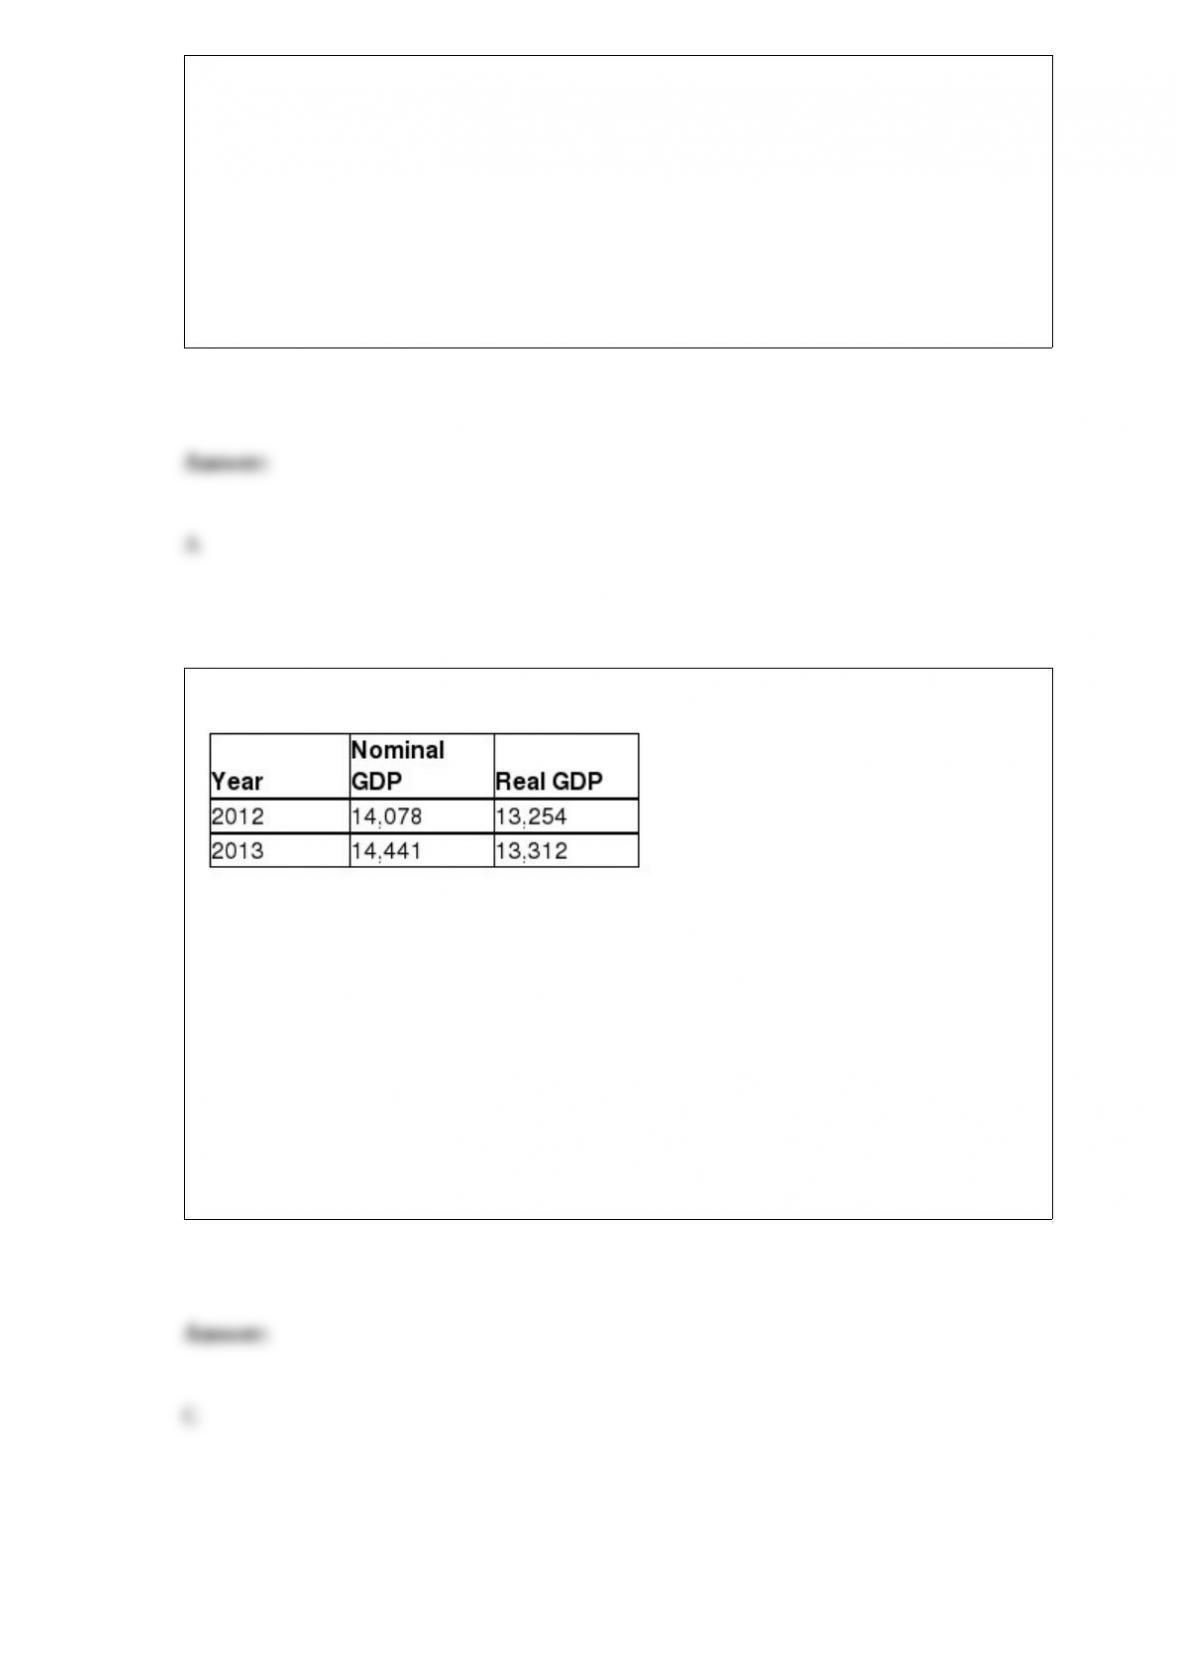
Table 8-14
Consider the following data on nominal GDP and real GDP (values are in billions of
dollars): The GDP deflator for 2013 equals
A) 92.2.
B) 102.6.
C) 108.5.
D) 109.1.
Firms in a small economy anticipated that inventories would grow over the past year by
$500,000. Over that year, inventories actually grew by only $400,000. This implies that
A) aggregate expenditure that year was greater than GDP that year.
B) there was an unplanned increase in inventories that year.
C) there was a planned increase in inventories that year.
D) aggregate expenditure that year was equal to GDP that year.
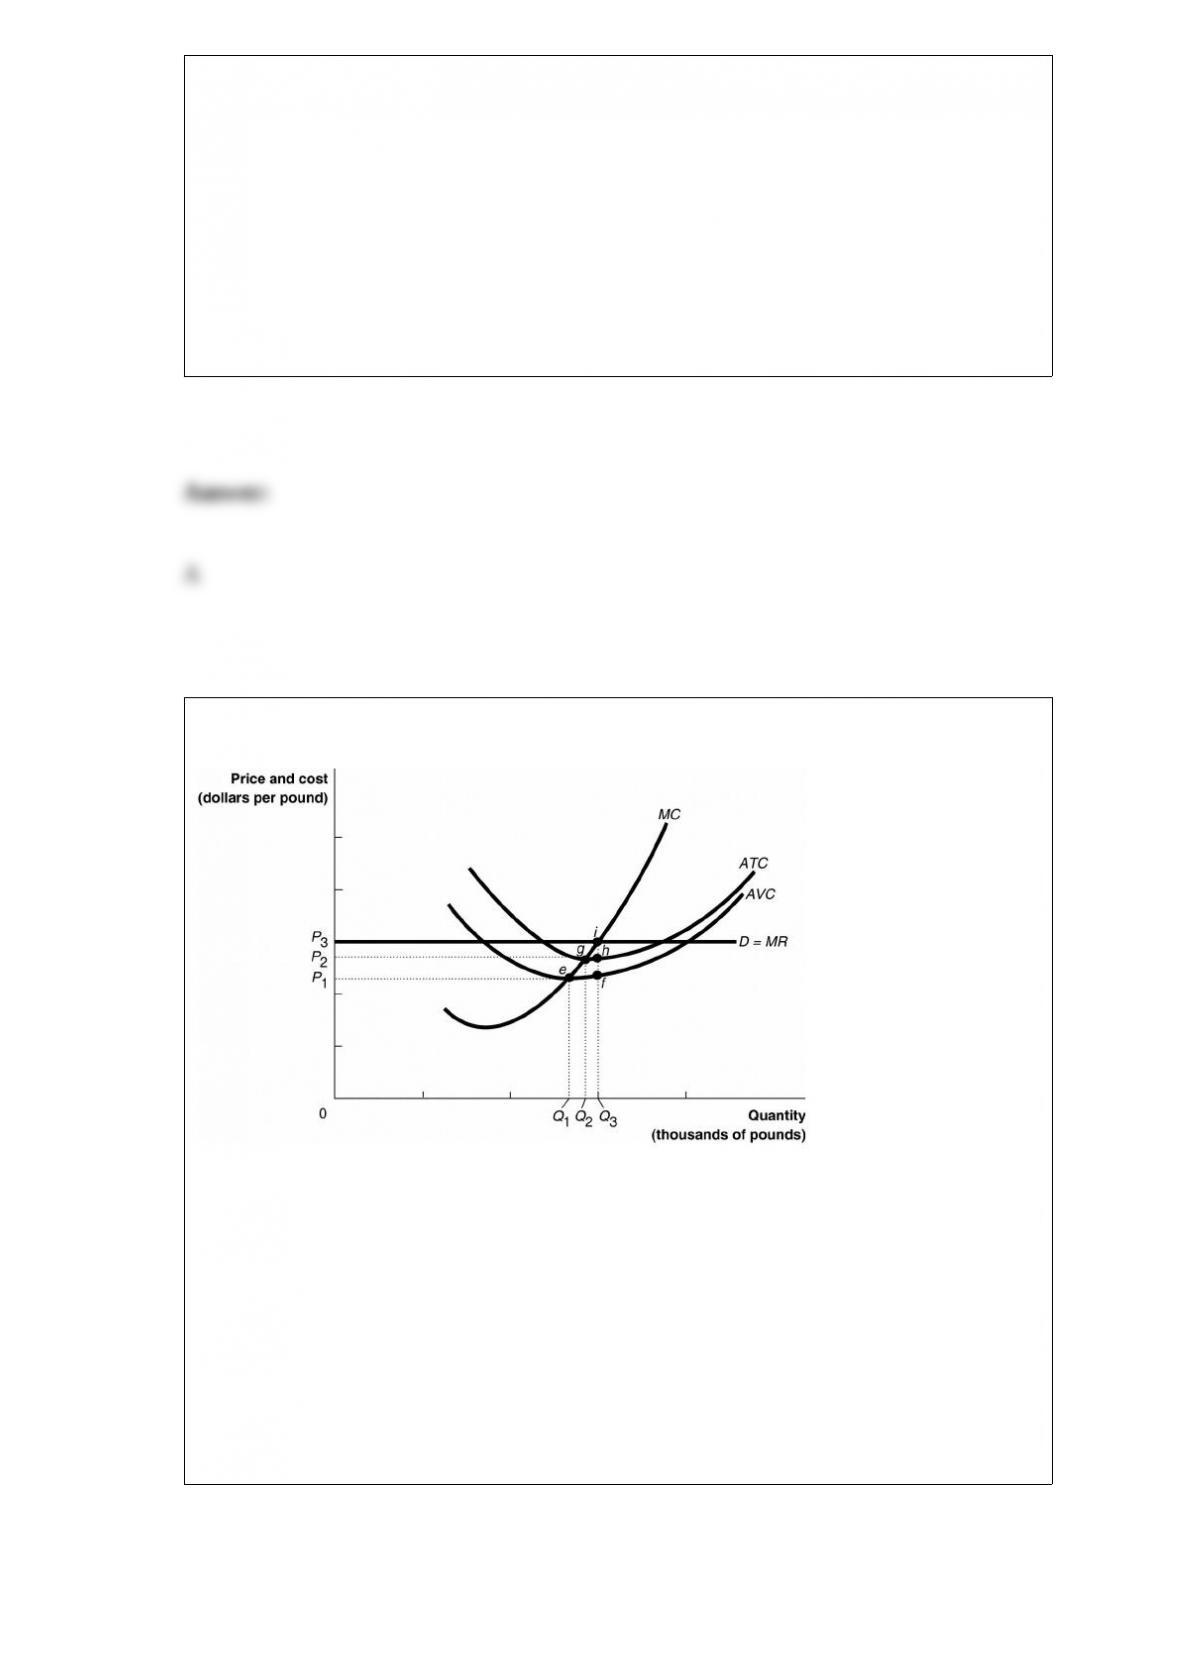
Figure 12-7
Figure 12-7 illustrates
the cost curves of a perfectly competitive firm. If the market price is P1
A) The firm will experience a loss and raise its price to P2. The firm will then break
even.
B) The firm will break even by producing a quantity of Q2.
C) The firm will experience a loss since price is less than ATC.
D) The firm may make a profit if it can increase the demand for its product.
In 2008, the Treasury and Federal Reserve took action to save large financial firms such
as Bear Stearns and AIG from failing. Which of the following is one reason why these
measures were taken?
A) The Emergency Economic Stabilization Act required the Fed and the Treasury to
provide financial assistance to firms that participated in regular open market actions
with the Fed.
B) The bankruptcy of a large financial firm would force the firm to sell its holdings of
securities, which could cause other firms that hold these securities to also fail.
C) The Fed and the Treasury wanted to allow Freddie Mac and Fannie Mae more time
to buy the firms before they went bankrupt.
D) The failure of these firms would have forced the Fed to increase interest rates, which
could have led to a severe recession.
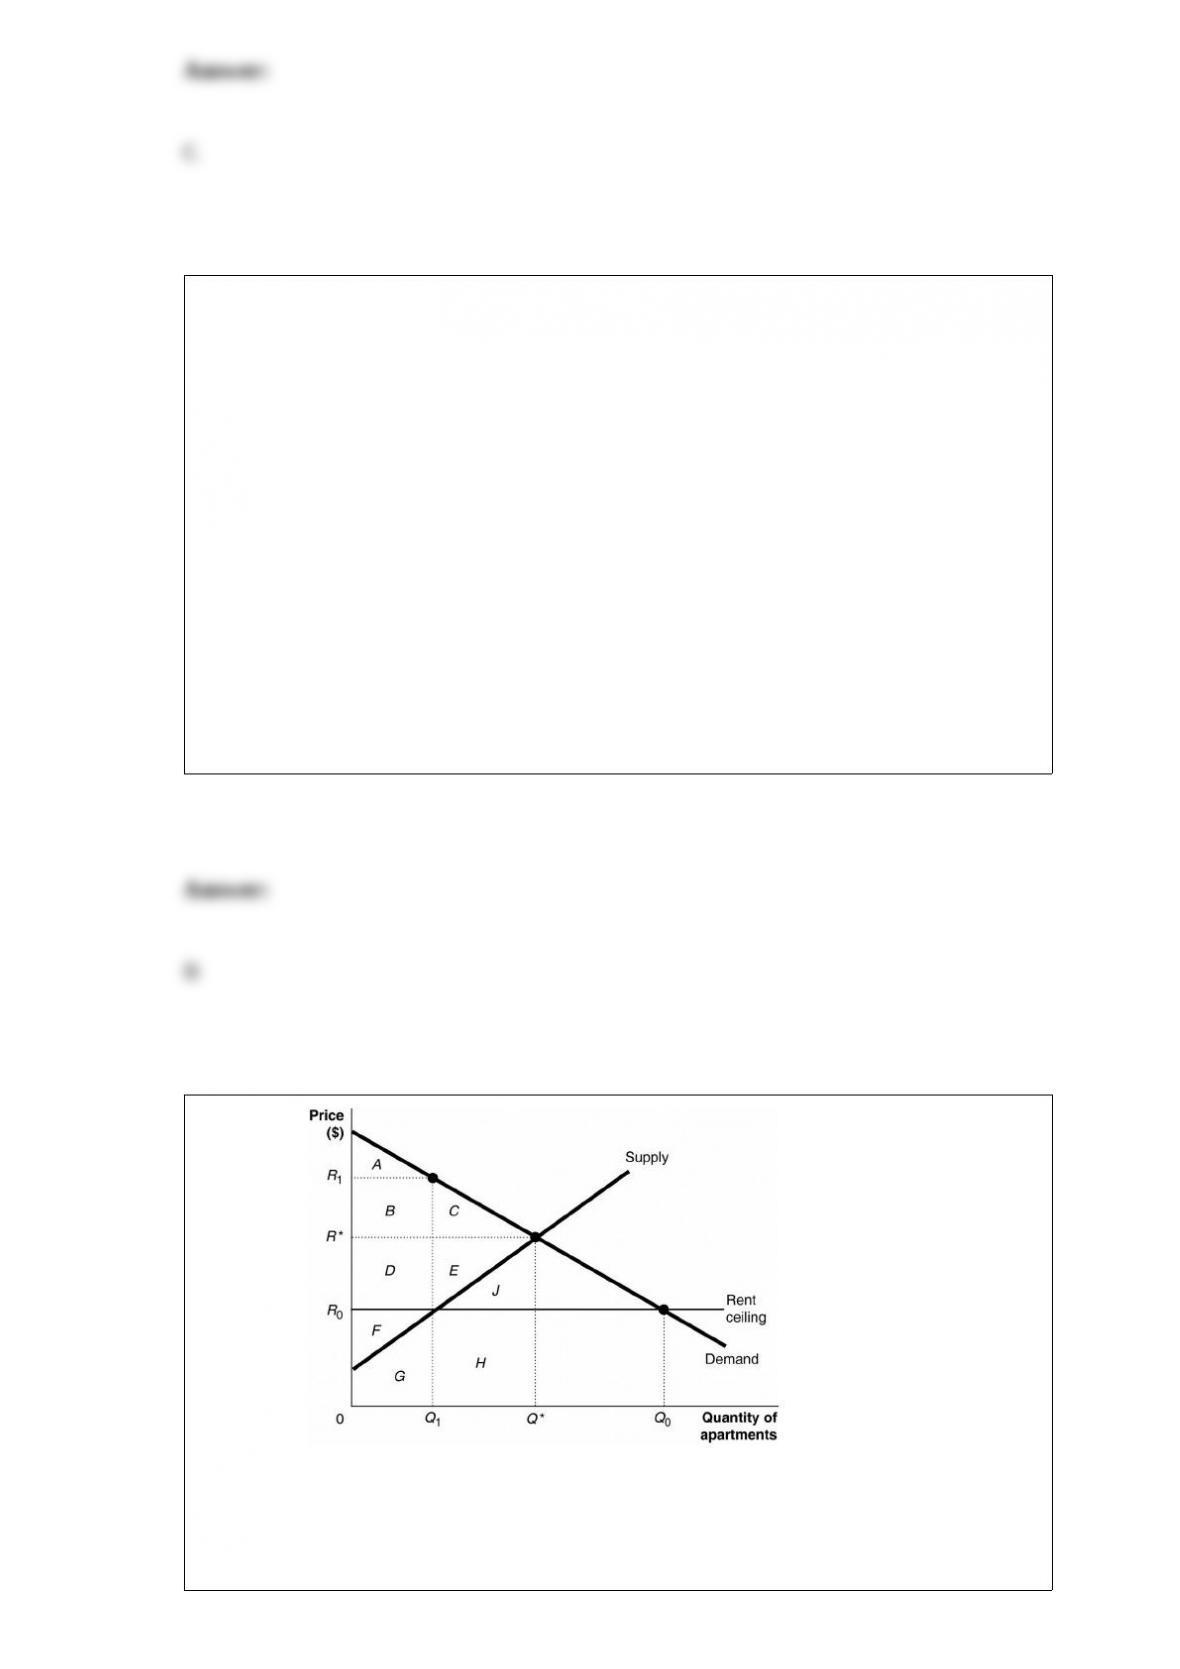
Figure 4-5 Figure 4-5 shows the
market for apartments in Bay City. Recently, the government imposed a rent ceiling at
R0. Suppose that instead of a price ceiling, the government imposed a price floor of R1.
What area represents the deadweight loss after the imposition of the price floor?

A) G + H
B) J + H
C) C + E + J + H
D) C + E
The cross-price elasticity of demand measures the
A) absolute change in the quantity demanded of one good divided by the absolute
change in the price of another good.
B) percentage change in the quantity demanded of one good divided by the percentage
change in the price of another good.
C) percentage change in the price of one good divided by the percentage change in the
quantity demanded of another good.
D) percentage change in the quantity demanded of one good in one location divided by
the price of the same good in another location.
Table 13-3
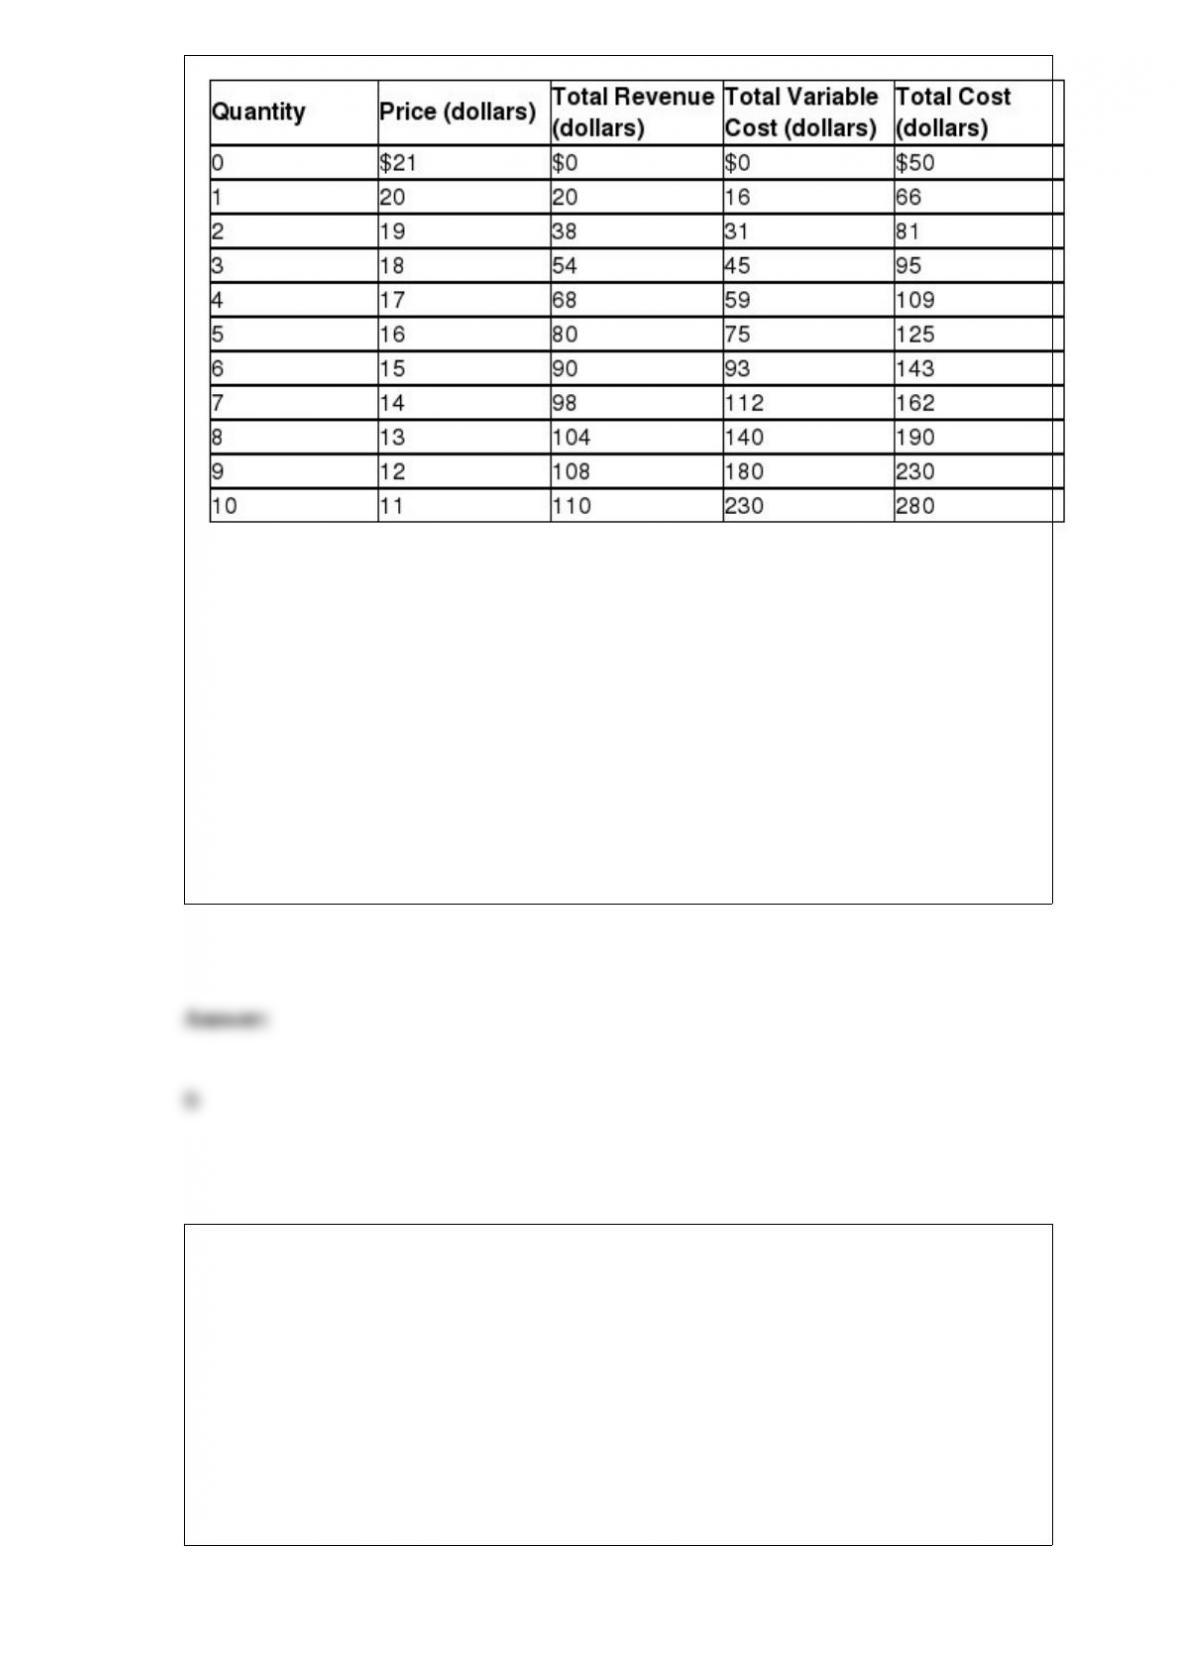
Table 13-3 shows the demand and cost schedules for a monopolistically competitive
firm.
What is the amount of the firm’s loss at its optimal output level?
A) $0
B) $41
C) $45
D) $50
If Joey Kobayashi experiences diminishing marginal utility from eating hot dogs, then
A) his total utility from eating hot dogs is negative.
B) the marginal utility from the next hot dog Joey eats will be negative.
C) the additional satisfaction he receives from eating another hot dog will be less than
the satisfaction he received from his eating his last hot dog.
D) Joey is maximizing the marginal utility per dollar he receives from eating hot dogs.
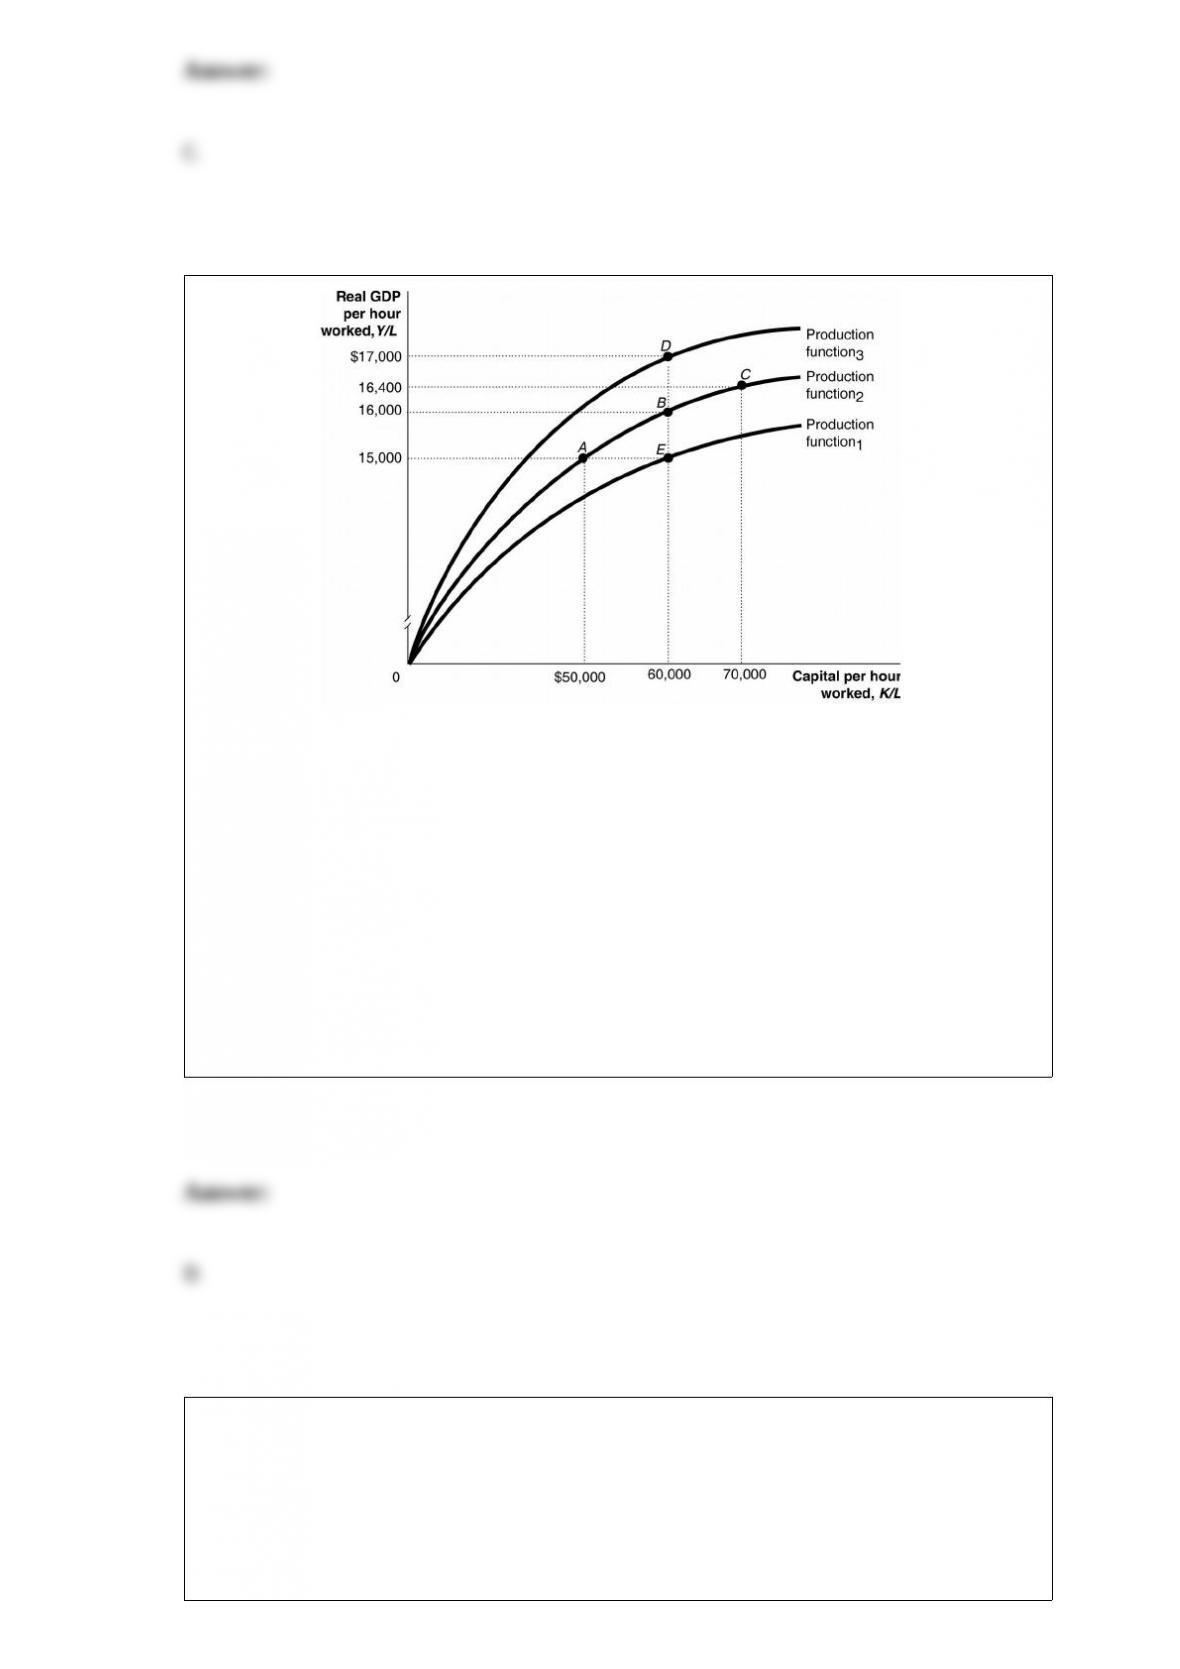
Figure 22-4
Many countries in Africa strongly discouraged and prohibited foreign direct investment
in the 1950s and 1960s. By doing so, these countries were essentially preventing a
moment from
A) B to A.
B) E to B.
C) A to E.
D) D to B.
The primary tool the Federal Reserve uses to increase the money supply is
A) printing more money.
B) lowering the required reserve ratio.
C) buying Treasury securities.
D) lowering the discount rate.
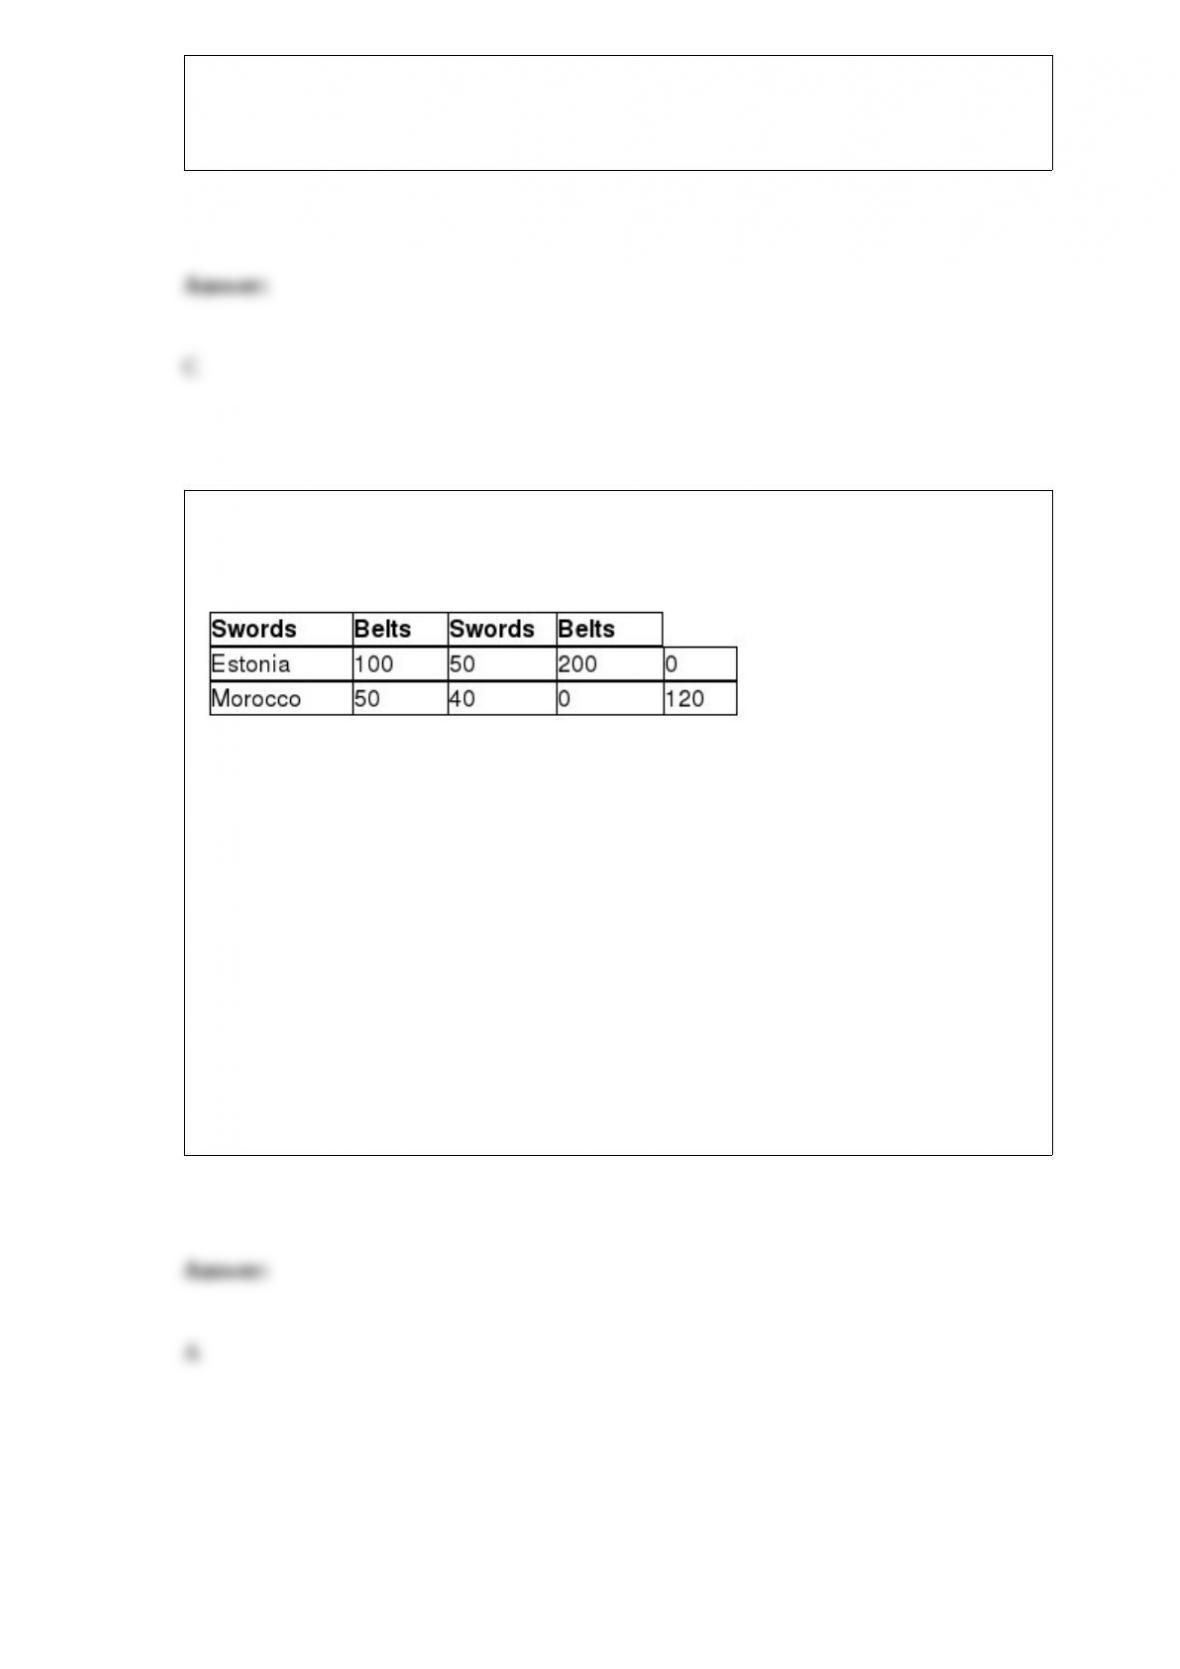
Table 9-12 Production and
Consumption Production
Without Trade With Trade
Estonia and Morocco can produce both swords and belts. Table 9-12 shows the
production and consumption quantities without trade, and the production numbers with
trade.
If the actual terms of trade are 1 belt for 1.5 swords and 70 belts are traded, how many
belts will Morocco gain compared to the “without trade” numbers?
A) 10
B) 20
C) 70
D) 80
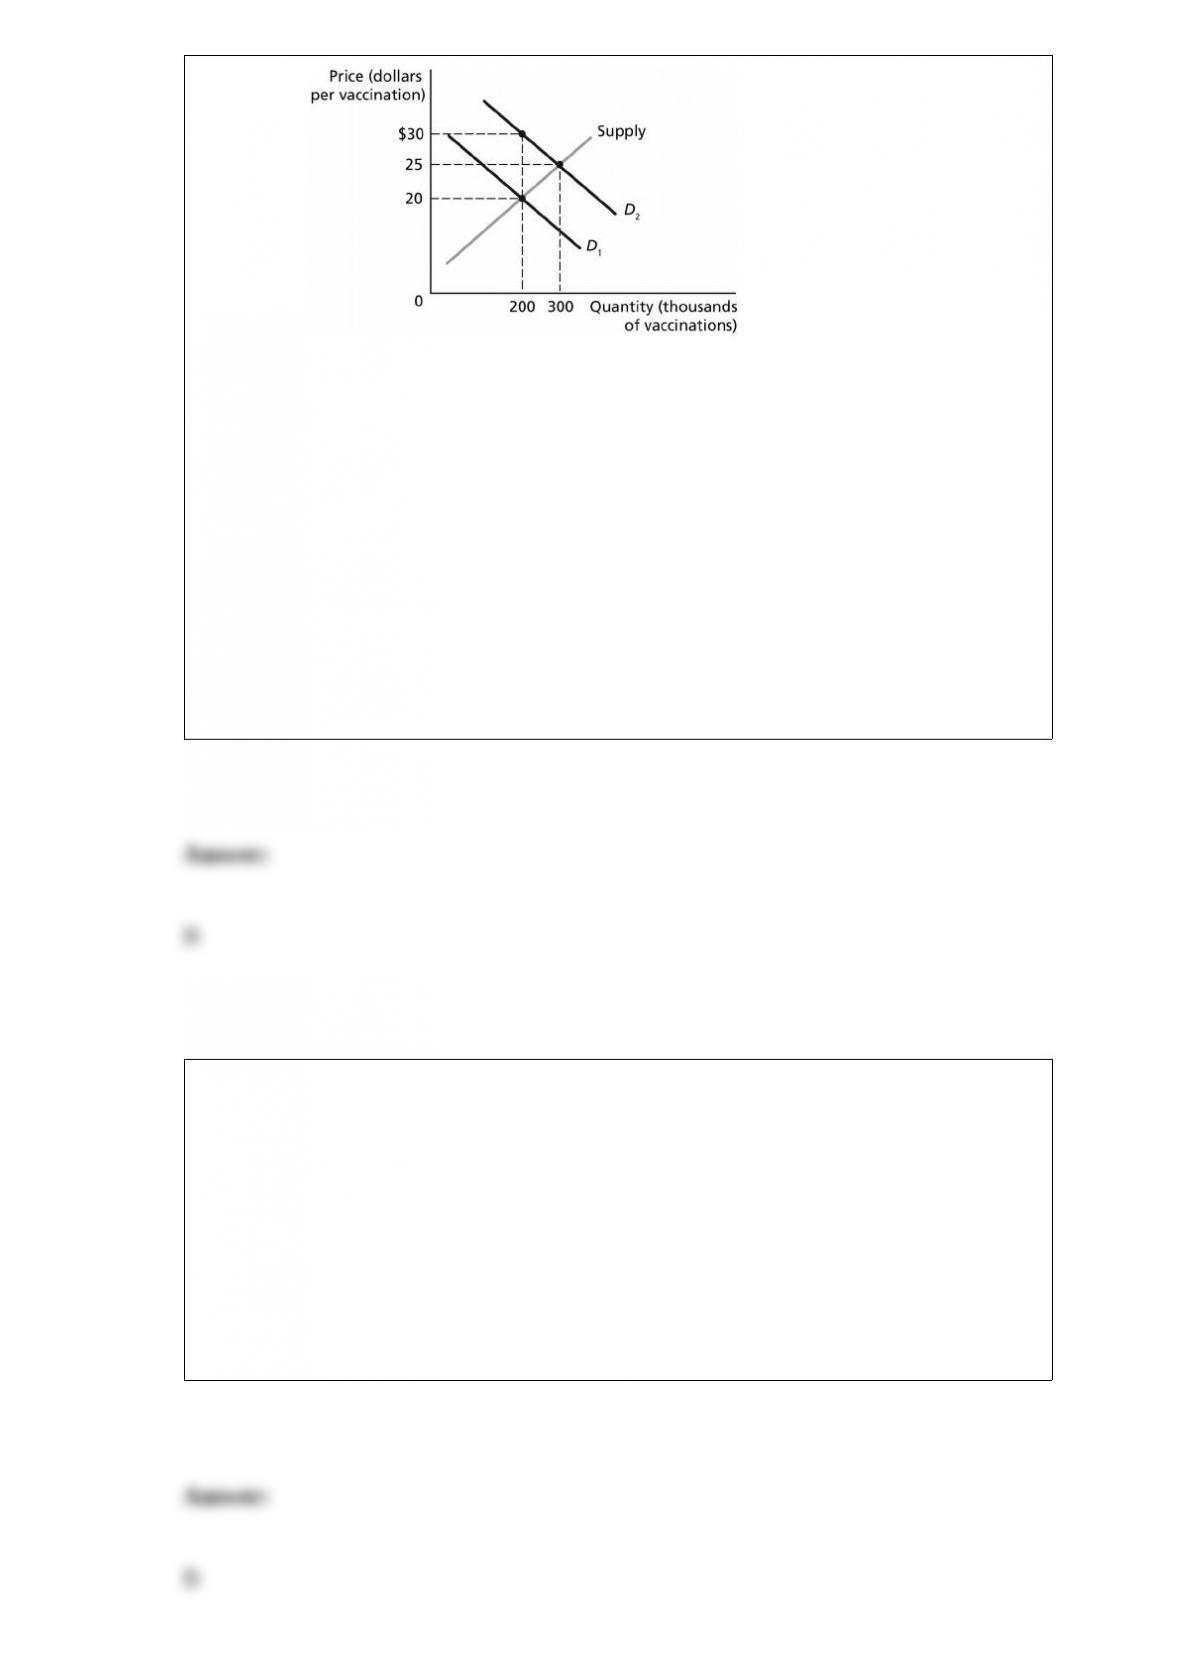
Figure 7-1 Figure 7-1 represents the
market for vaccinations. Vaccinations are considered a benefit to society, and the figure
shows both the marginal private benefit and the marginal social benefit from
vaccinations.
At the market equilibrium,
A) the marginal benefit is equal to the marginal cost.
B) the marginal benefit is greater than the marginal cost.
C) the marginal benefit is less than the marginal cost.
D) the marginal benefit is zero.
If a firm’s long-run average total curve shows that it can produce 5,000 DVDs at an
average cost of $2.00 and 15,000 DVDs at an average cost of $1.50 this is evidence of
A) diminishing returns.
B) economies of scale.
C) diseconomies of scale.
D) the law of supply.