
1) Factors that have hampered the increase in the supply of physicians in the U.S.
include the following, except:
A.Actions by doctors’ unions, like the AMA
B.Rising direct expenses for a medical degree
C.Higher opportunity cost of medical education and training
D.Rising incomes of physicians
2) Use the following data to answer the question. The letters A, B, and C designate
three successively larger plant sizes.
Refer to the data. At what level of output is minimum efficient scale realized?
A.30
B.40
C.50
D.60
3) Suppose that in some year nominal interest rates are less than the rate of inflation.
This means that:
A.money demand exceeds money supply.
B.real interest rates are negative.
C.real interest rates are positive and unusually high.
D.real interest rates exceed nominal interest rates.
4) A decrease in the demand for health care would most likely result from:
A.Newer and more costly medical technology
B.More use of defensive medicine
C.An aging population
D.Healthier lifestyles

5)
Refer to the diagram pertaining to two nations and a specific product. Lines FA and GB
are:
A.domestic supply curves for two countries.
B.domestic demand curves for two countries.
C.import demand curves for two countries.
D.export supply curves for two countries.
6) Suppose for a regulated monopoly that price equals minimum ATC but price exceeds
MC. This means that:
A.both productive and allocative efficiency are being achieved.
B.productive efficiency is being achieved, but not allocative efficiency.
C.allocative efficiency is being achieved, but not productive efficiency.
D.neither productive nor allocative efficiency is being achieved.
7) Which of the following will not cause the supply curve to shift?
A.A change in the costs of resources needed to produce the good
B.A technological change in the production of the good
C.A change in the price of the good
D.A change in the prices of other goods that producers could be producing
8)
Refer to the table representing Kara’s bank account. Assuming that $2,000 was
deposited into her account at the beginning of year 1, the value for cell A is:
A.$10.
B.$20.
C.$100.
D.$200.
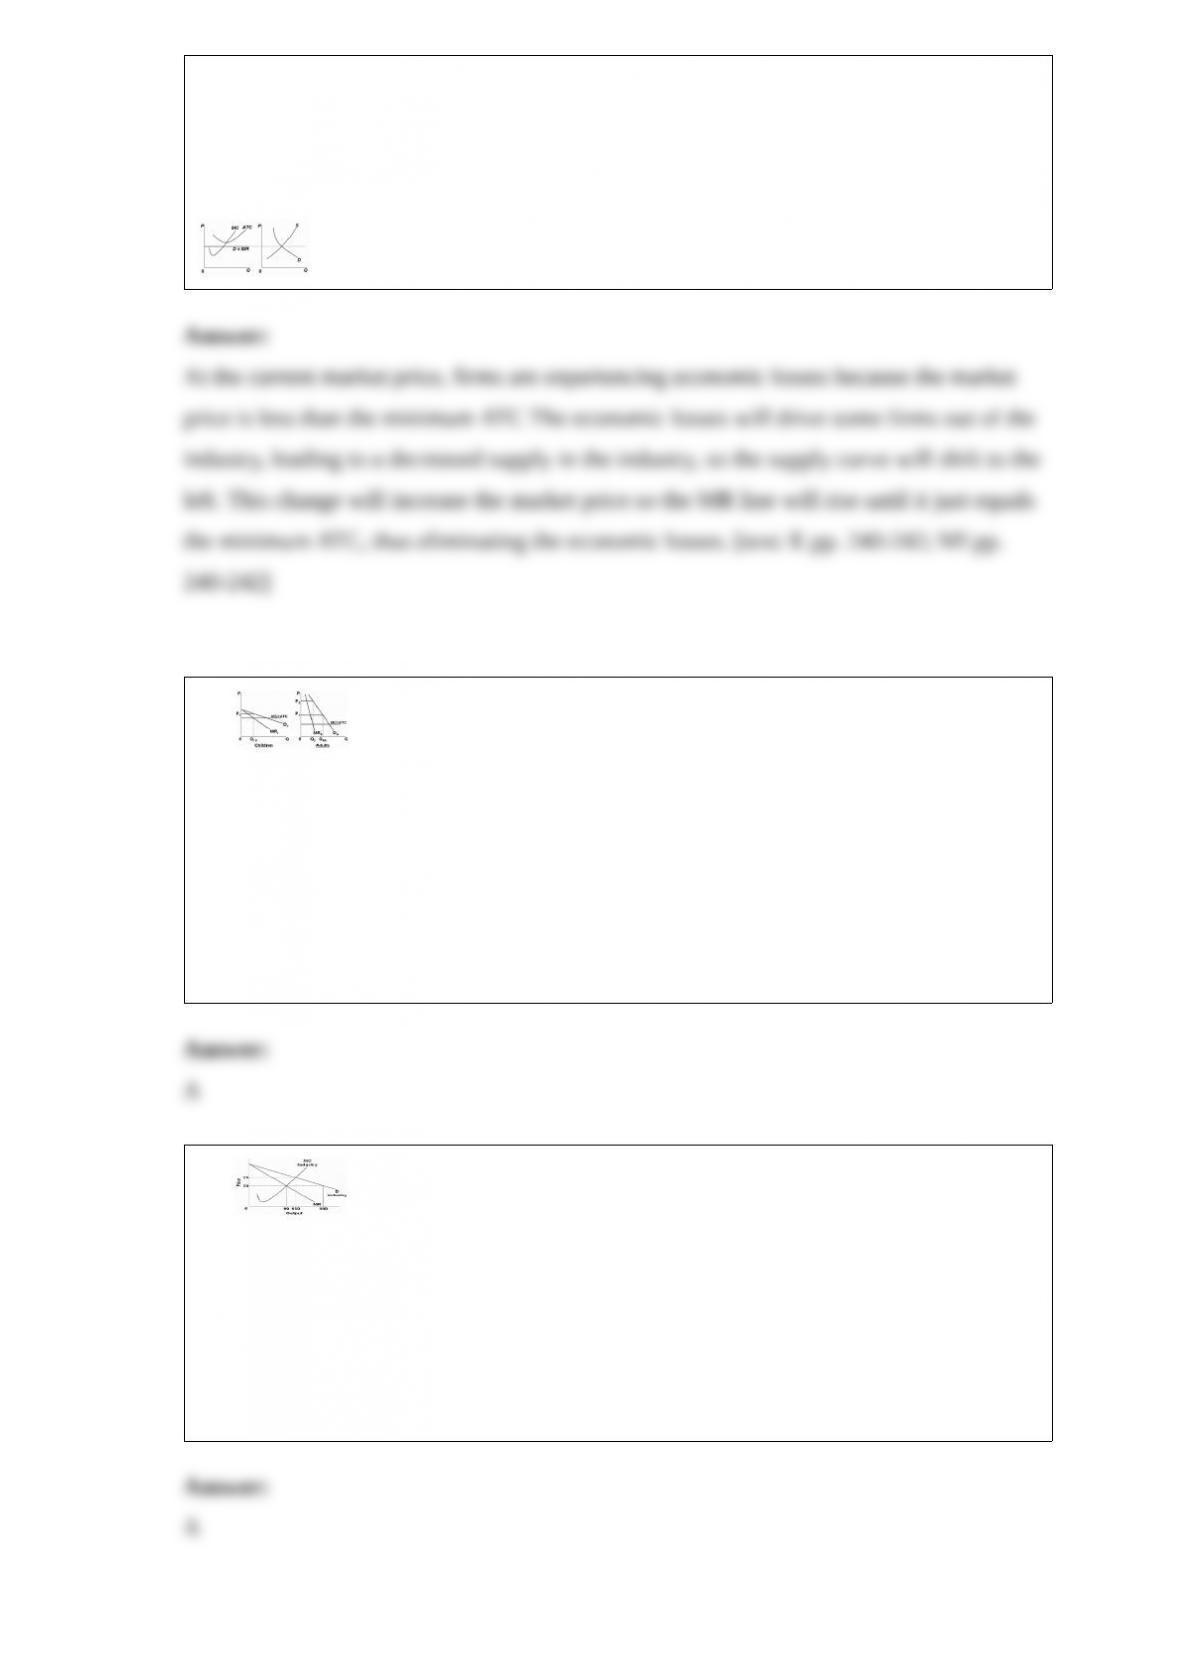
9) Consider the two graphs below. Graph A represents a typical firm in a purely
competitive industry. Graph B represents the supply and demand conditions in that
industry. The dashed horizontal line represents the current market price for firms and
for the industry. In the long run, what will happen to price, profit, the supply curve, and
the number of firms in the industry?
10)
Assume the figure applies to a pure monopolist and that MC is the same for both
graphs. If this firm is able to price discriminate between children and adults, it should
charge prices of:
A.P1 to children and P2 to adults.
B.P1 to adults and P2 to children.
C.P1 to both children and adults.
D.P2 to both children and adults.
11)
Based on the graph above, what is the difference between the purely competitive
equilibrium level of output and the pure monopoly equilibrium level of output?
A.20
B.70
C.90
D.110