
1) According to one survey 76 percent of Americans said they were not saving enough
for retirement. This example of inconsistency over time
a.is rational behavior.
b.likely occurs because saving requires a sacrifice in the present for a reward in the
distant future.
c.likely occurs because Americans don’t care about retirement.
d.definitely would not happen if Americans earned a greater return on their investments.
2) Which of the following statements is not correct?
a.All states have state income taxes, but the percentages vary widely.
b.Sales taxes and property taxes are important revenue sources for state and local
governments.
c.Medicare spending has increased because the percentage of the population that is
elderly and the cost of healthcare have both increased.
d.A budget deficit occurs when government spending exceeds government receipts.
3) A monopolist can sell 300 units of output for $45 per unit. Alternatively, it can sell
301 units of output for $44.60 per unit. The marginal revenue of the 301st unit of output
is
a. -$120.00.
b. -$75.40.
c. -$0.40.
d. $75.40.
4) The equity of a tax system concerns whether the tax burden is distributed equally
among the population.
a.True
b.False
5) In some countries, brand name fast-food restaurants are not allowed to operate. Such
restrictions are likely to
a.enhance the social welfare of society.
b.increase the number of fast-food restaurants.
c.reduce barriers to entry in imperfect markets.
d.reduce the competitive nature of local fast-food markets.
6) Let P represent price; let QSrepresent quantity supplied; and assume the equation of
the supply curve is
If 90 units of the good are produced and sold, then producer
surplus amounts to $1,350.
a.True
b.False
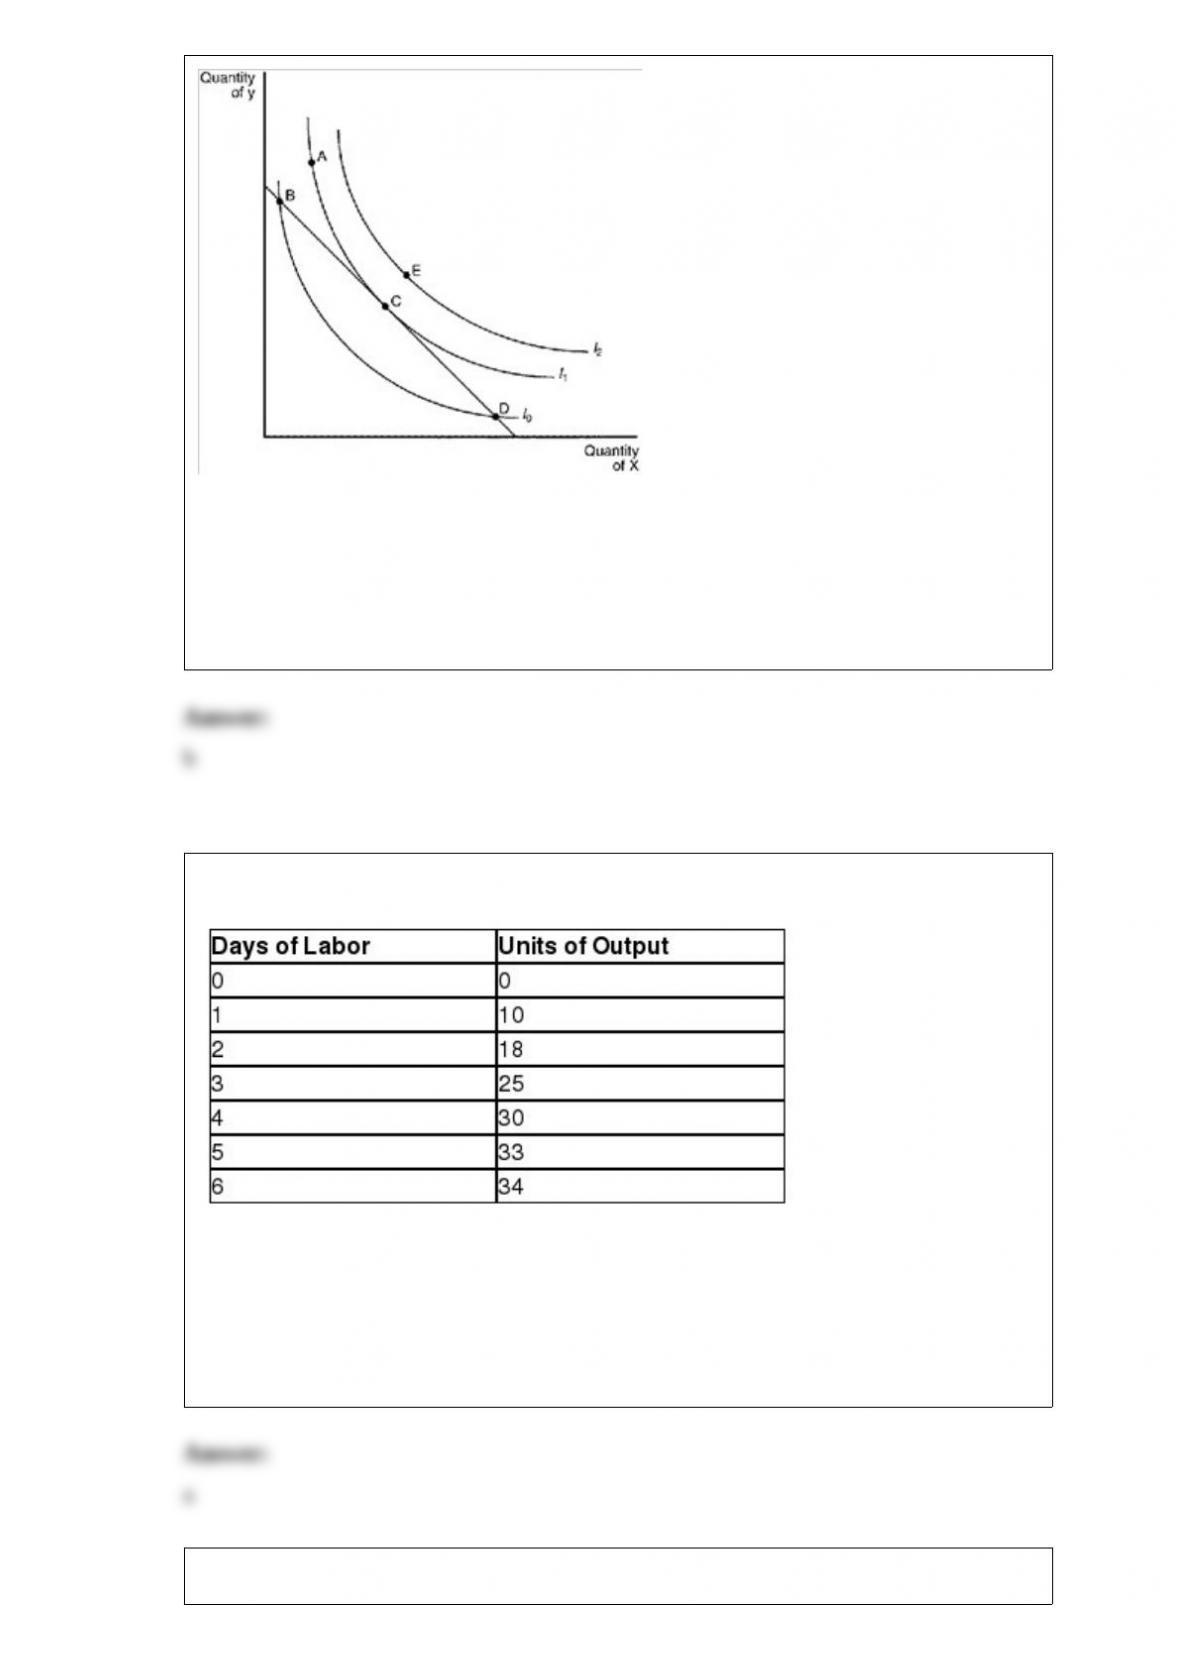
7) The following table contains a monthly demand schedule for large, single-topping,
carry-out pizzas.
If the law of demand applies to these pizzas, then A could be
a.0
b.15
c.25
d.30
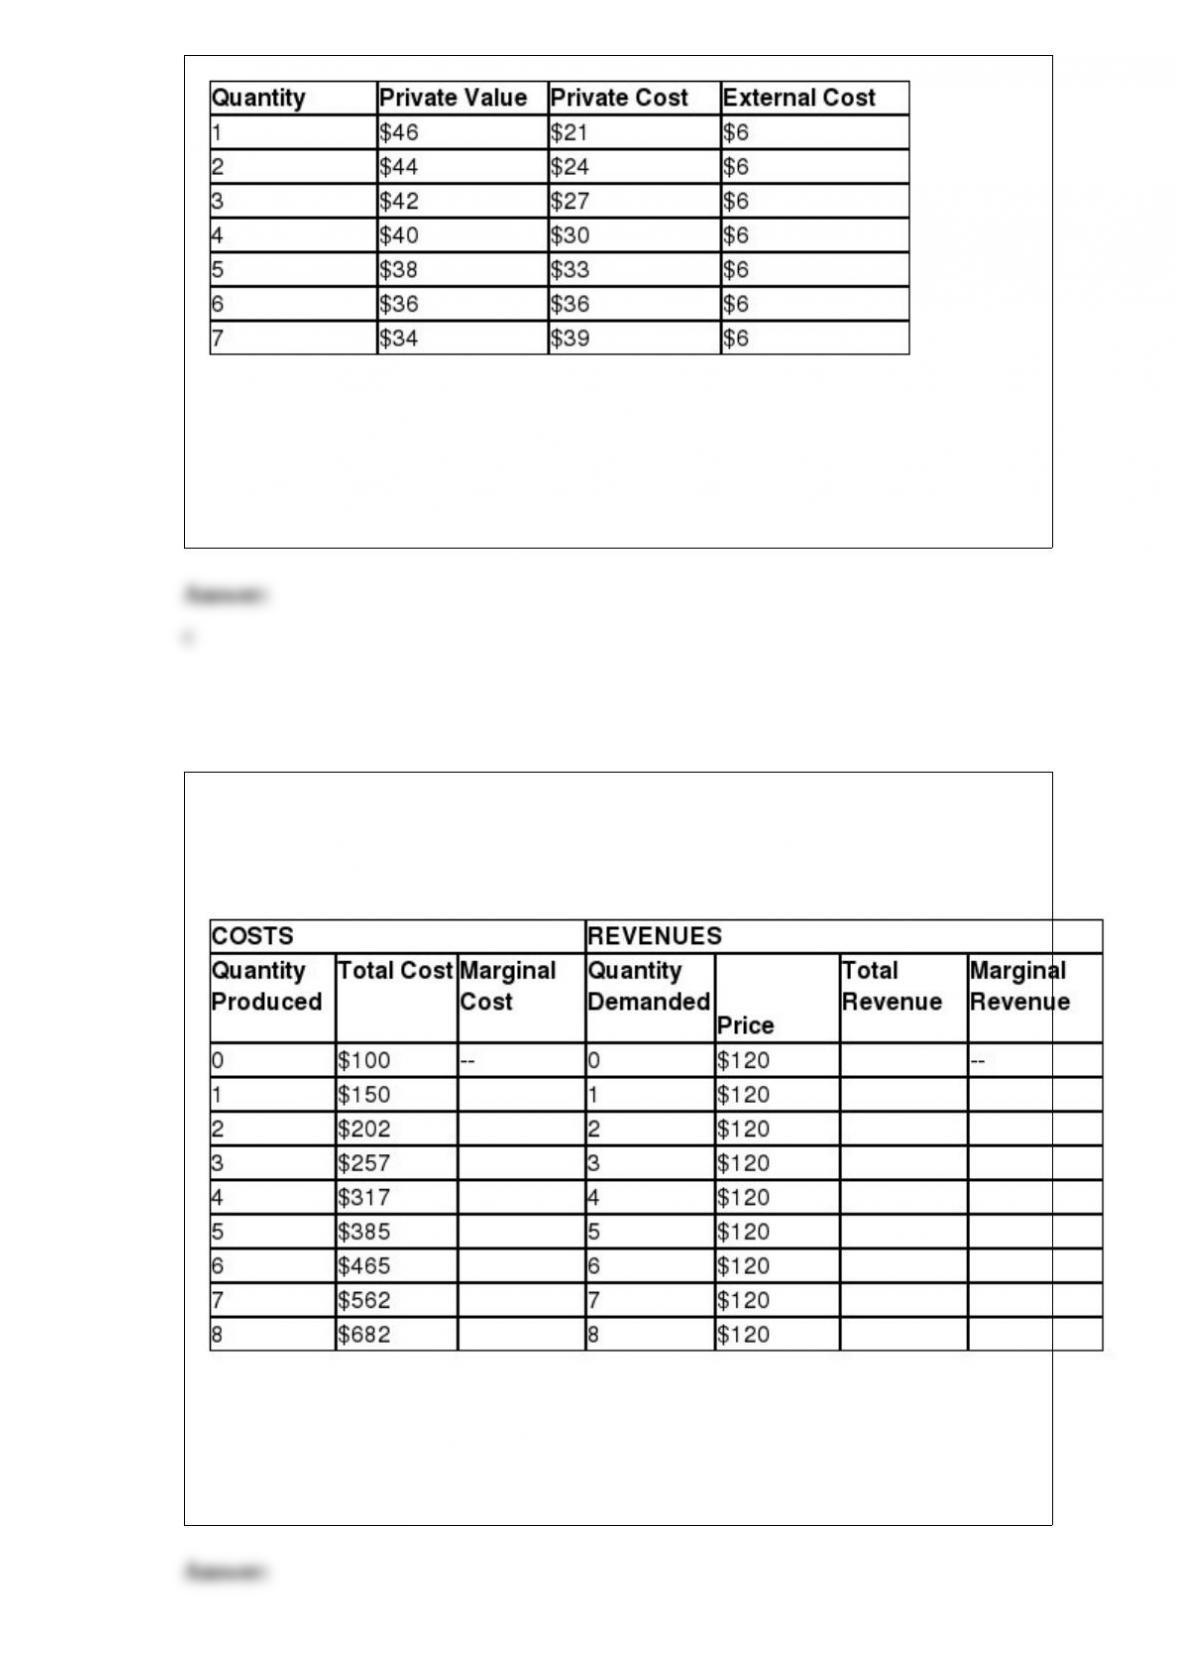
8) Figure 21-18
Refer to Figure 21-18. Bundle C represents a point where
a.MRSxy > Py/Px.
b.MRSxy = Px/Py.
c.MRSxy < Px/Py.
d.MRSxy > Px/Py.
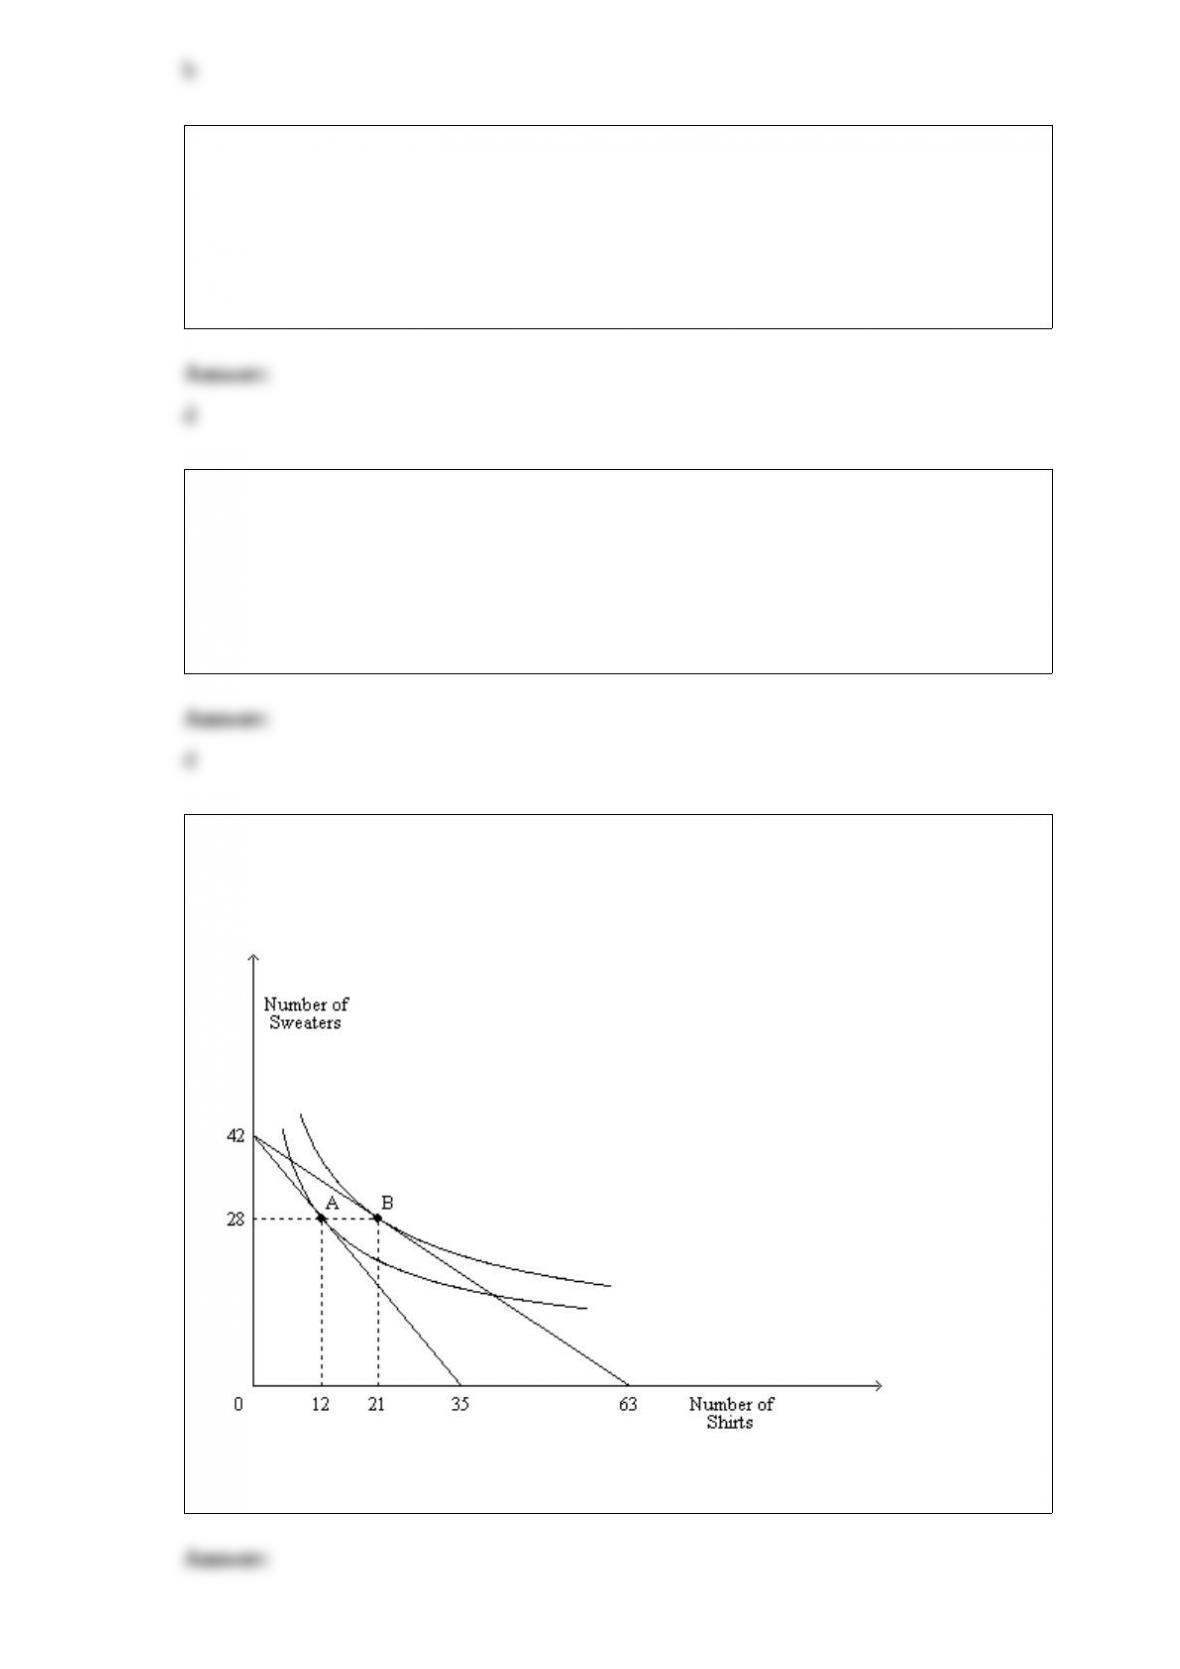
9) Table 18-1
Refer to Table 18-1. Suppose that the firm pays its workers $80 per day. Each unit of
output sells for $15. How many days of labor should the firm hire?
a.3
b.4
c.5
d.6
10) Table 10-4
The last unit of output for which private value exceeds social cost is the
a.2nd unit.
b.3rd unit.
c.4th unit.
d.5th unit.
11) Table 14-6
The following table presents cost and revenue information for a firm operating in a
competitive industry.
What is the average revenue when 4 units are sold?
a. $60
b. $120
c. $125
d. $197
12) Because workers in the U.S. economy receive most of the total income earned,
which of the following factors of production is considered to be the most important?
a.profit
b.wages
c.interest
d.labor
13) Sir Isaac Newton’s development of the theory of gravity after observing an apple
fall from a tree is an example of
a.a controlled experiment that lead to the formulation of a scientific theory.
b.being in the right place at the right time.
c.an idea whose time had come.
d.the interplay between observation and theory in science.
14) Figure 21-31
The figure shows two indifference curves and two budget constraints for a consumer
named Kevin.
Refer to Figure 21-31. Suppose Kevin is optimally purchasing 12 shirts and 28
sweaters, and he is spending $648 on shirts. What is the price of a sweater?
15) With which three demographic variables is poverty correlated?
16)
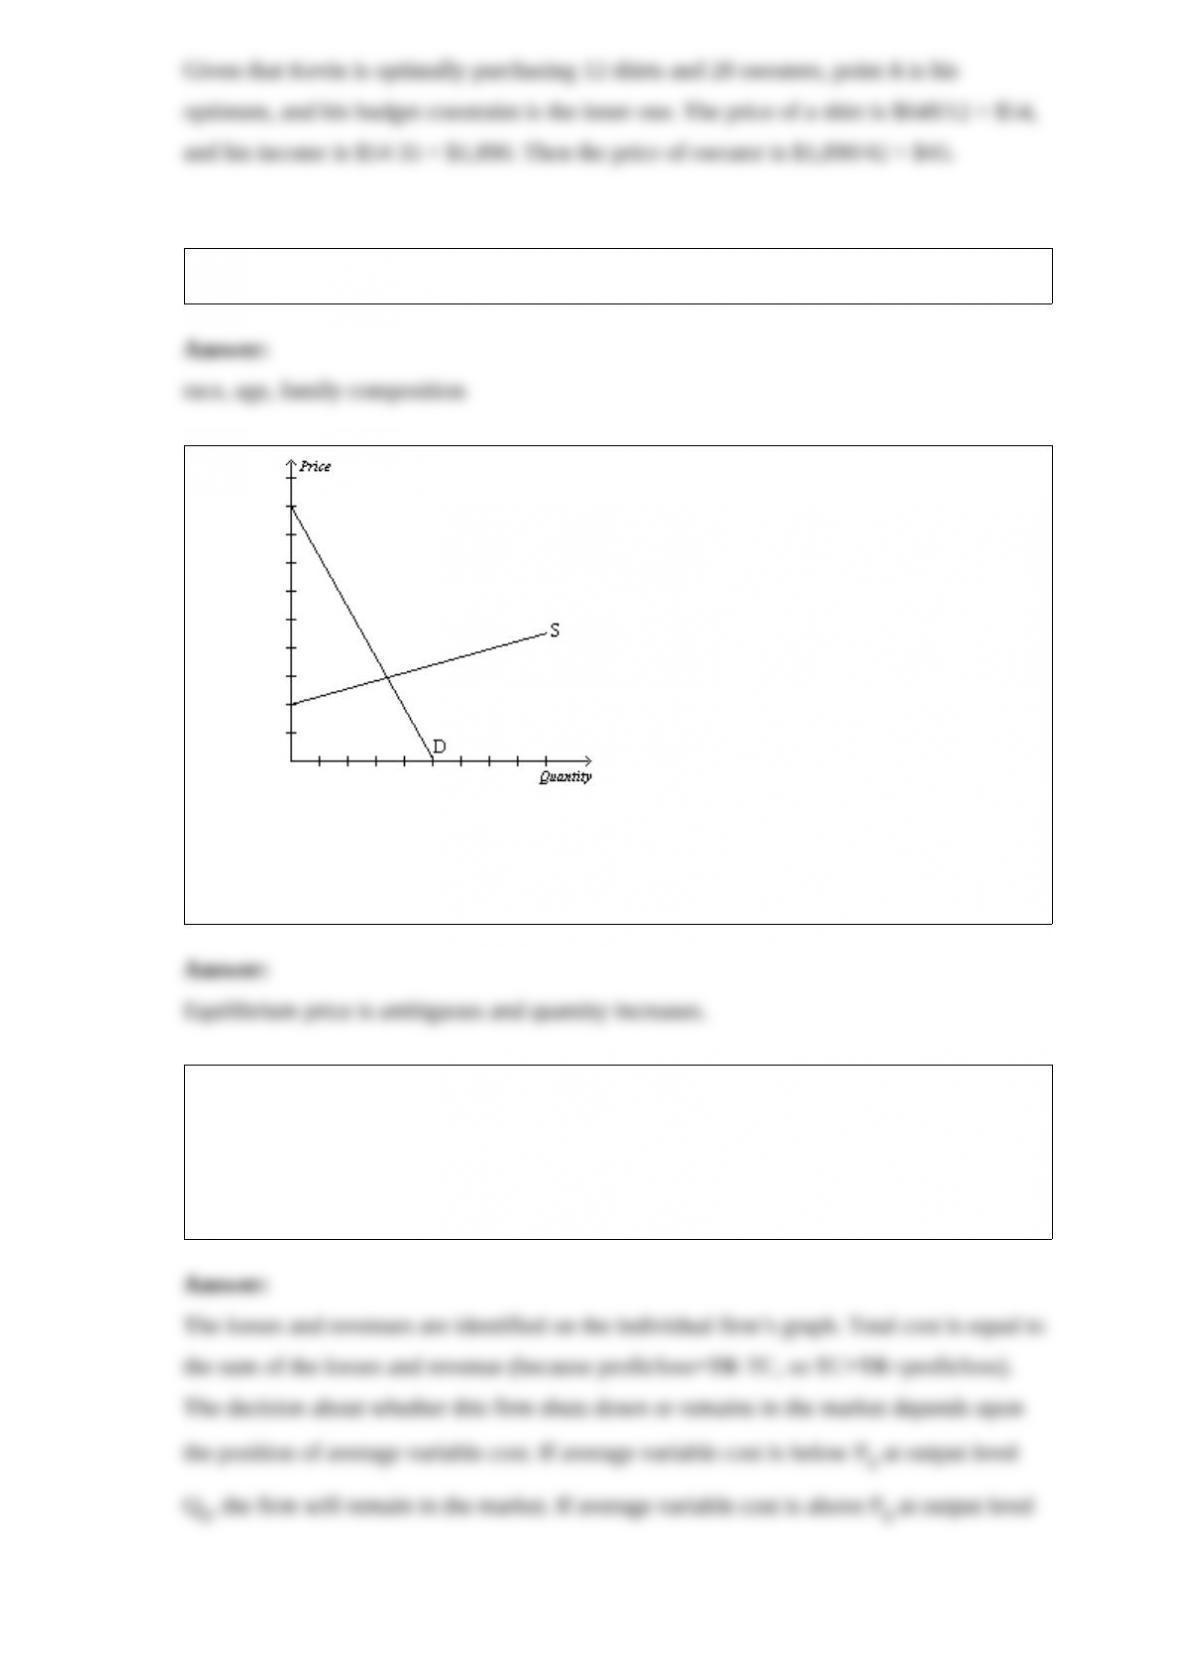
In this market for tablet computers, more suppliers enter the market and the price of
laptops, a substitute good, increases, while all other factors remain constant. Explain the
change(s) in the equilibrium price and quantity.
17) Use a graph to demonstrate the circumstances that would prevail in a perfectly
competitive market where firms are experiencing economic losses. Identify costs,
revenue, and the economic losses on your graph. Using your graph, determine whether
an individual firm will shut down in the short run, or choose to remain in the market.
Explain your answer.
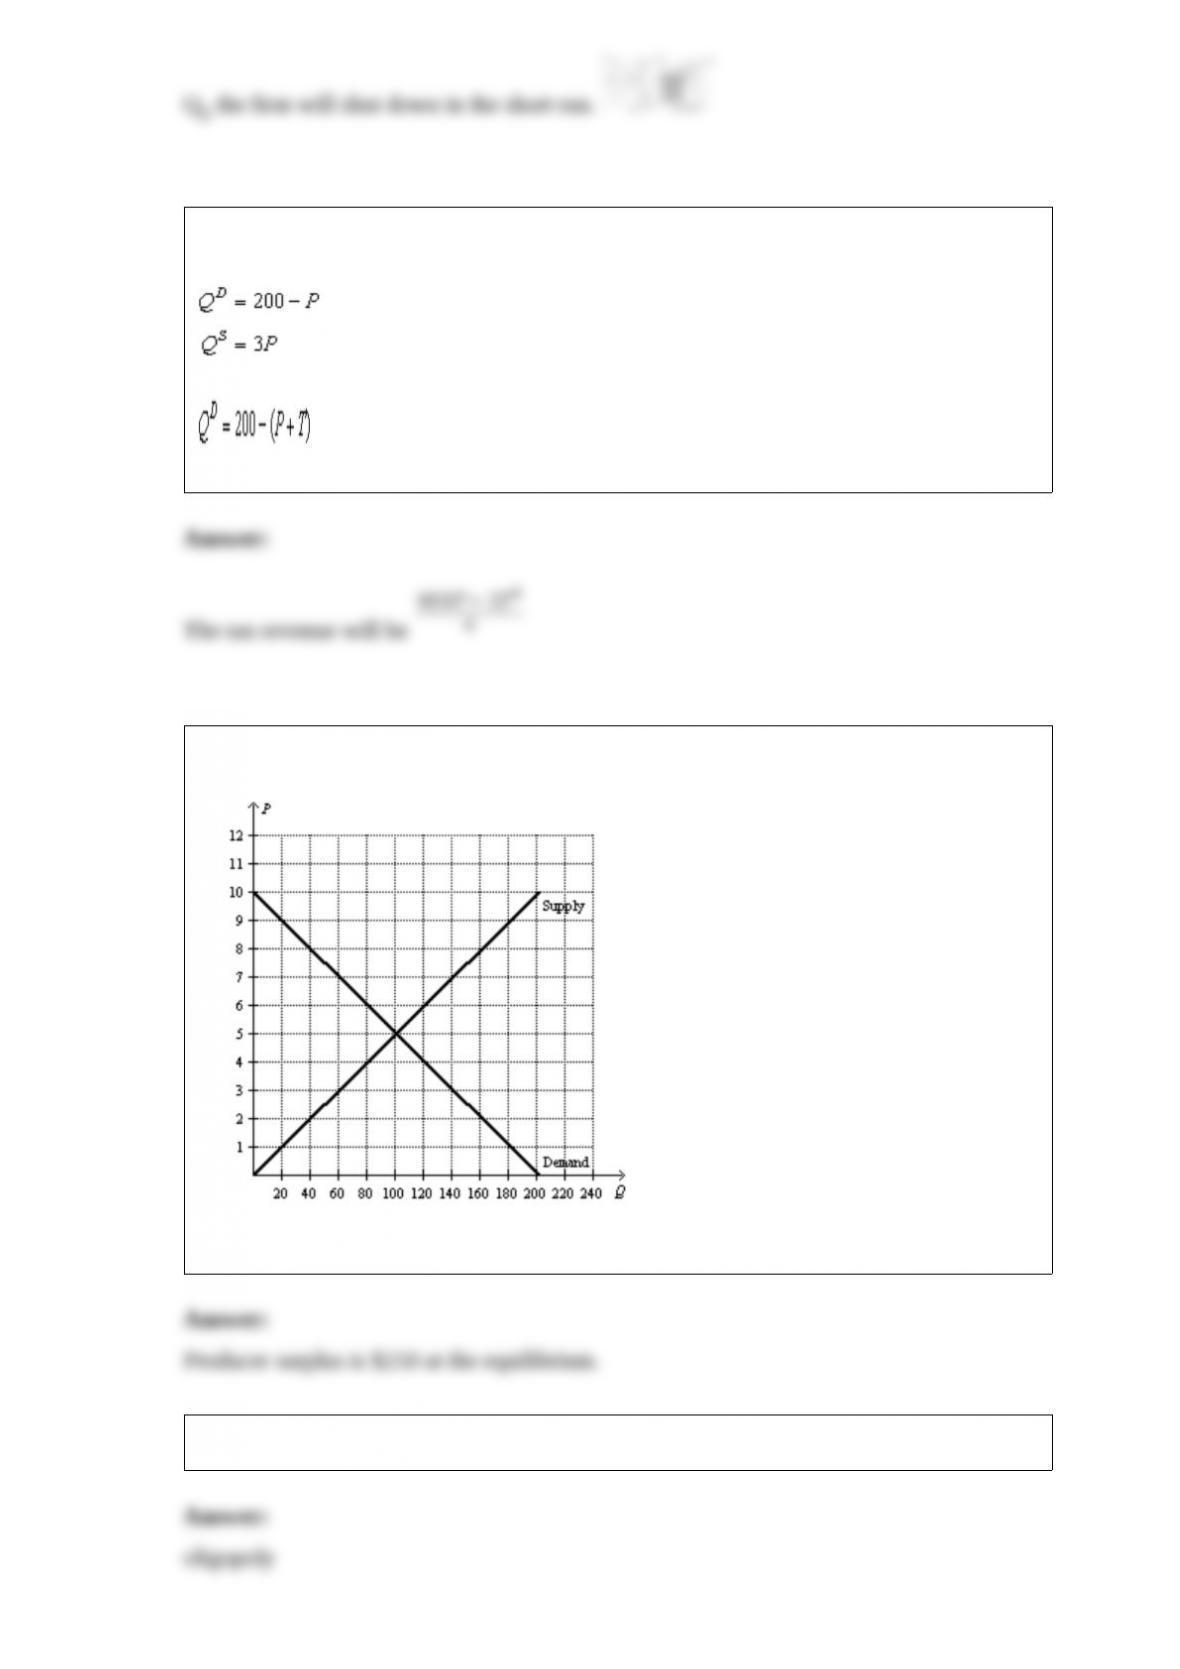
18) Scenario 8-3
Suppose the market demand and market supply curves are given by the equations:
Suppose that a tax of T is placed on buyers so that the demand curve becomes:
How much tax revenue will be collected after this tax is imposed?
19) Figure 8-25
How much is producer surplus at the market equilibrium?
20) Which market structure(s) is(are) considered highly concentrated?