To say that government intervenes in the economy to promote equality is to say that
government is aiming to
a. create a more fair distribution of income.
b. change the ingredients that are used to “bake” the economic pie.
c. enlarge the economic pie.
d. All of the above are correct.
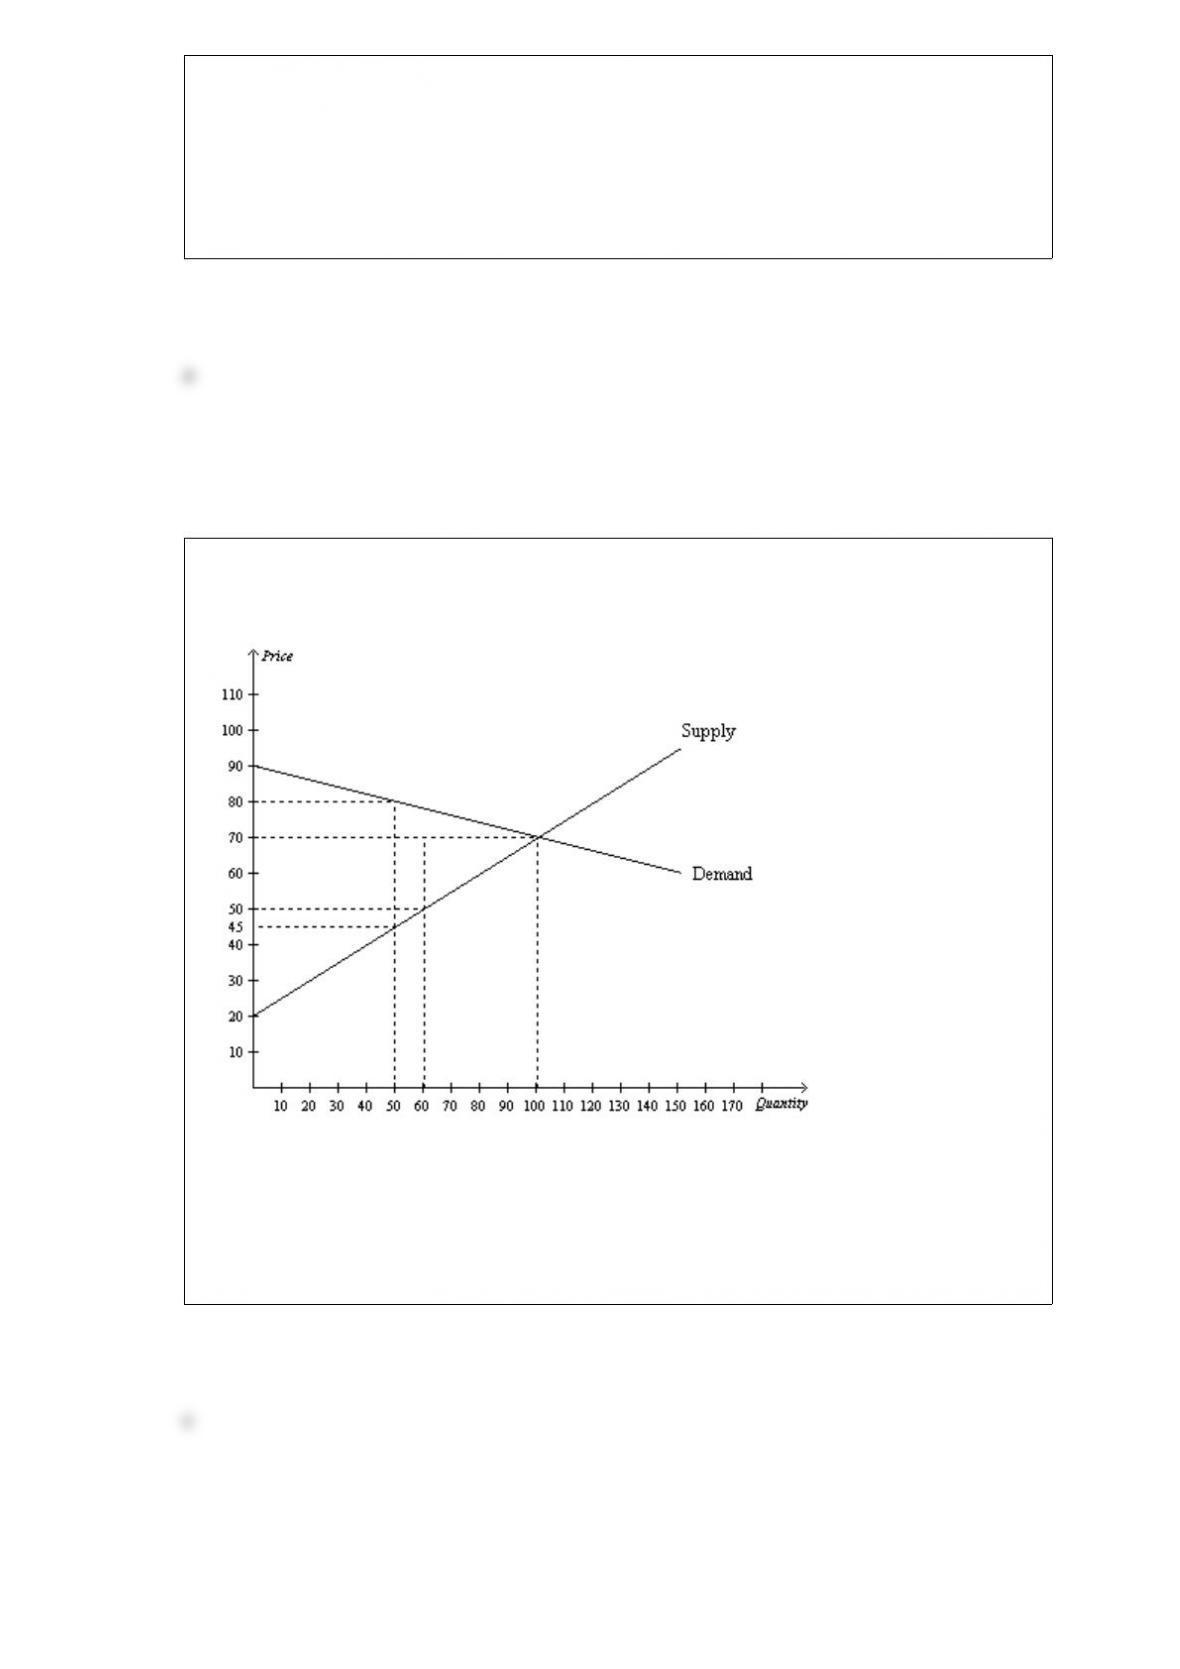
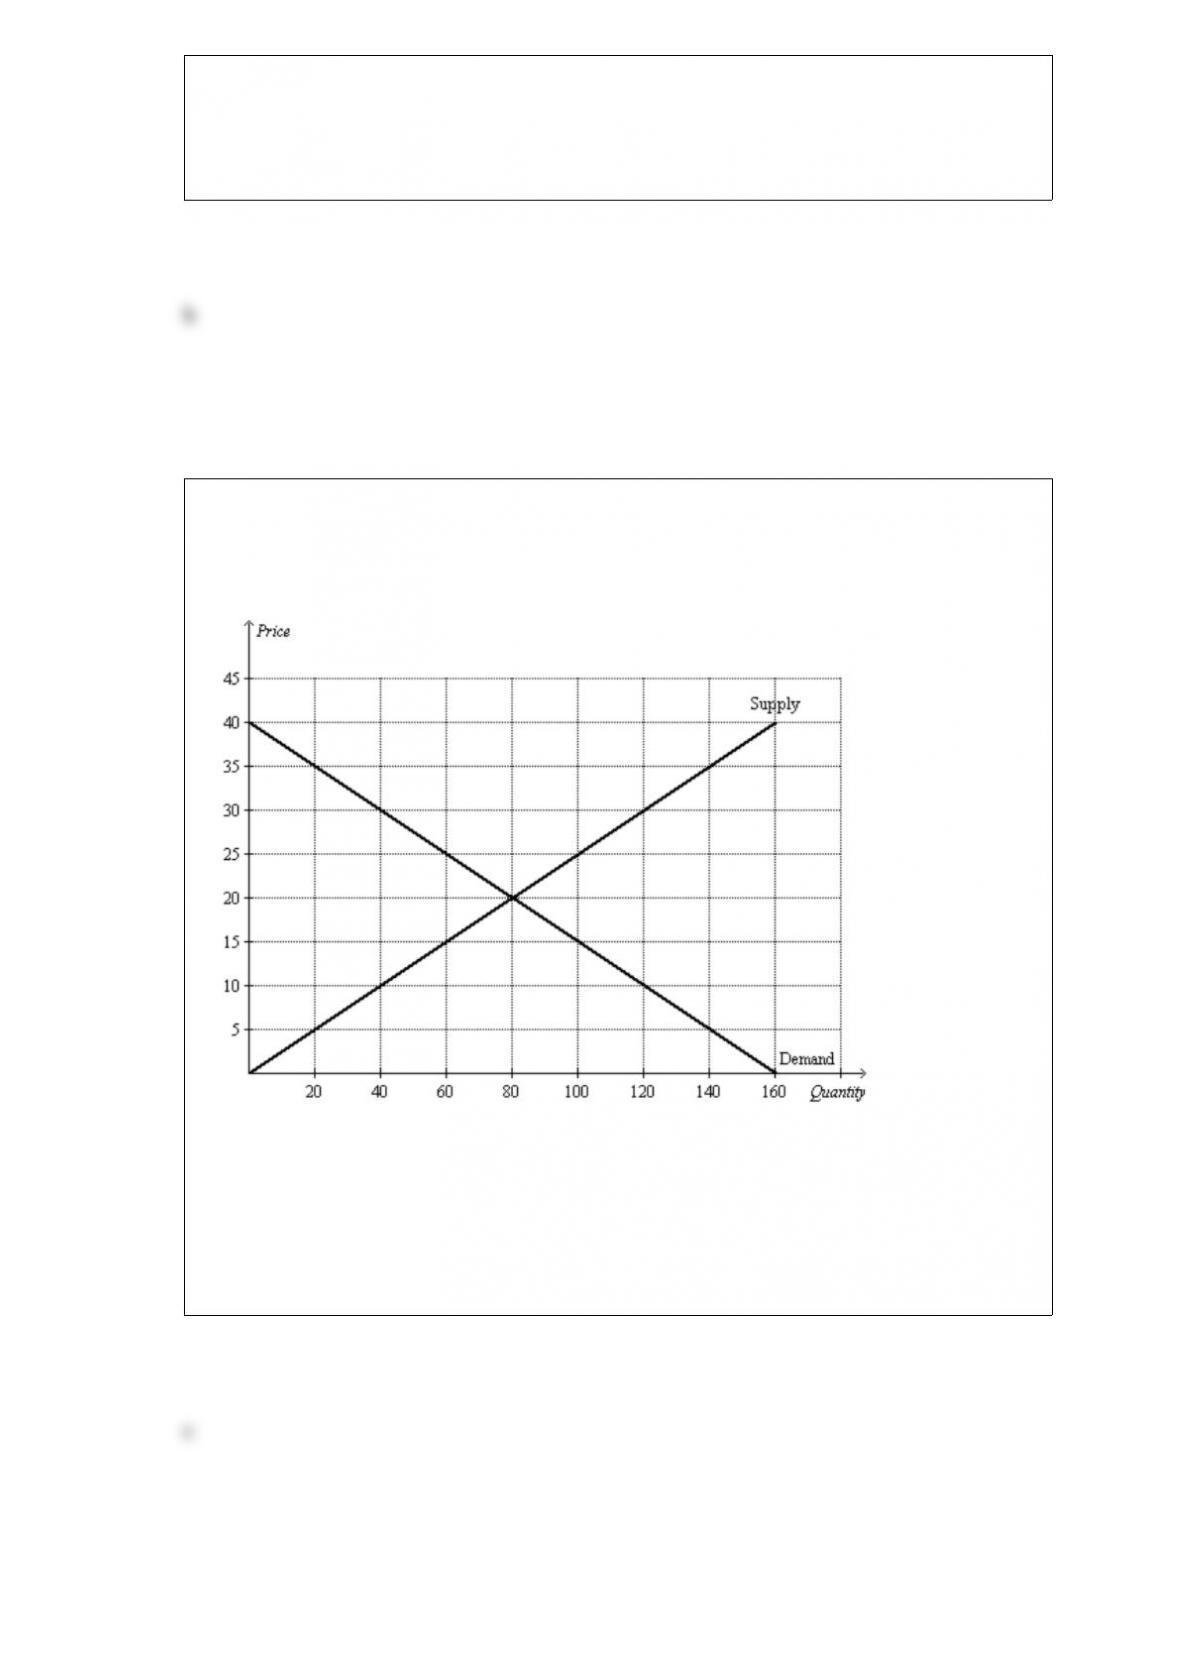
Figure 722
Refer to Figure 722. At the equilibrium price, total surplus is
a. $2,500.
b. $1,000.
c. $3,500.
d. $7,000.

A likely effect of government policies that redistribute income and wealth from the
wealthy to the poor is that those policies
a. enhance equality.
b. enhance efficiency.
c. increase the reward for working hard.
d. All of the above are correct.
Table 55
PriceTotal
Revenue
$5$70
$6$78
$7$84
$8$88
$9$90
$10$90
Refer to Table 55. When price is between $5 and $9, demand is
a. elastic.
b. unit elastic.
c. inelastic.
d. There is not enough information given to determine whether demand is elastic, unit
elastic, or inelastic.
Figure 81
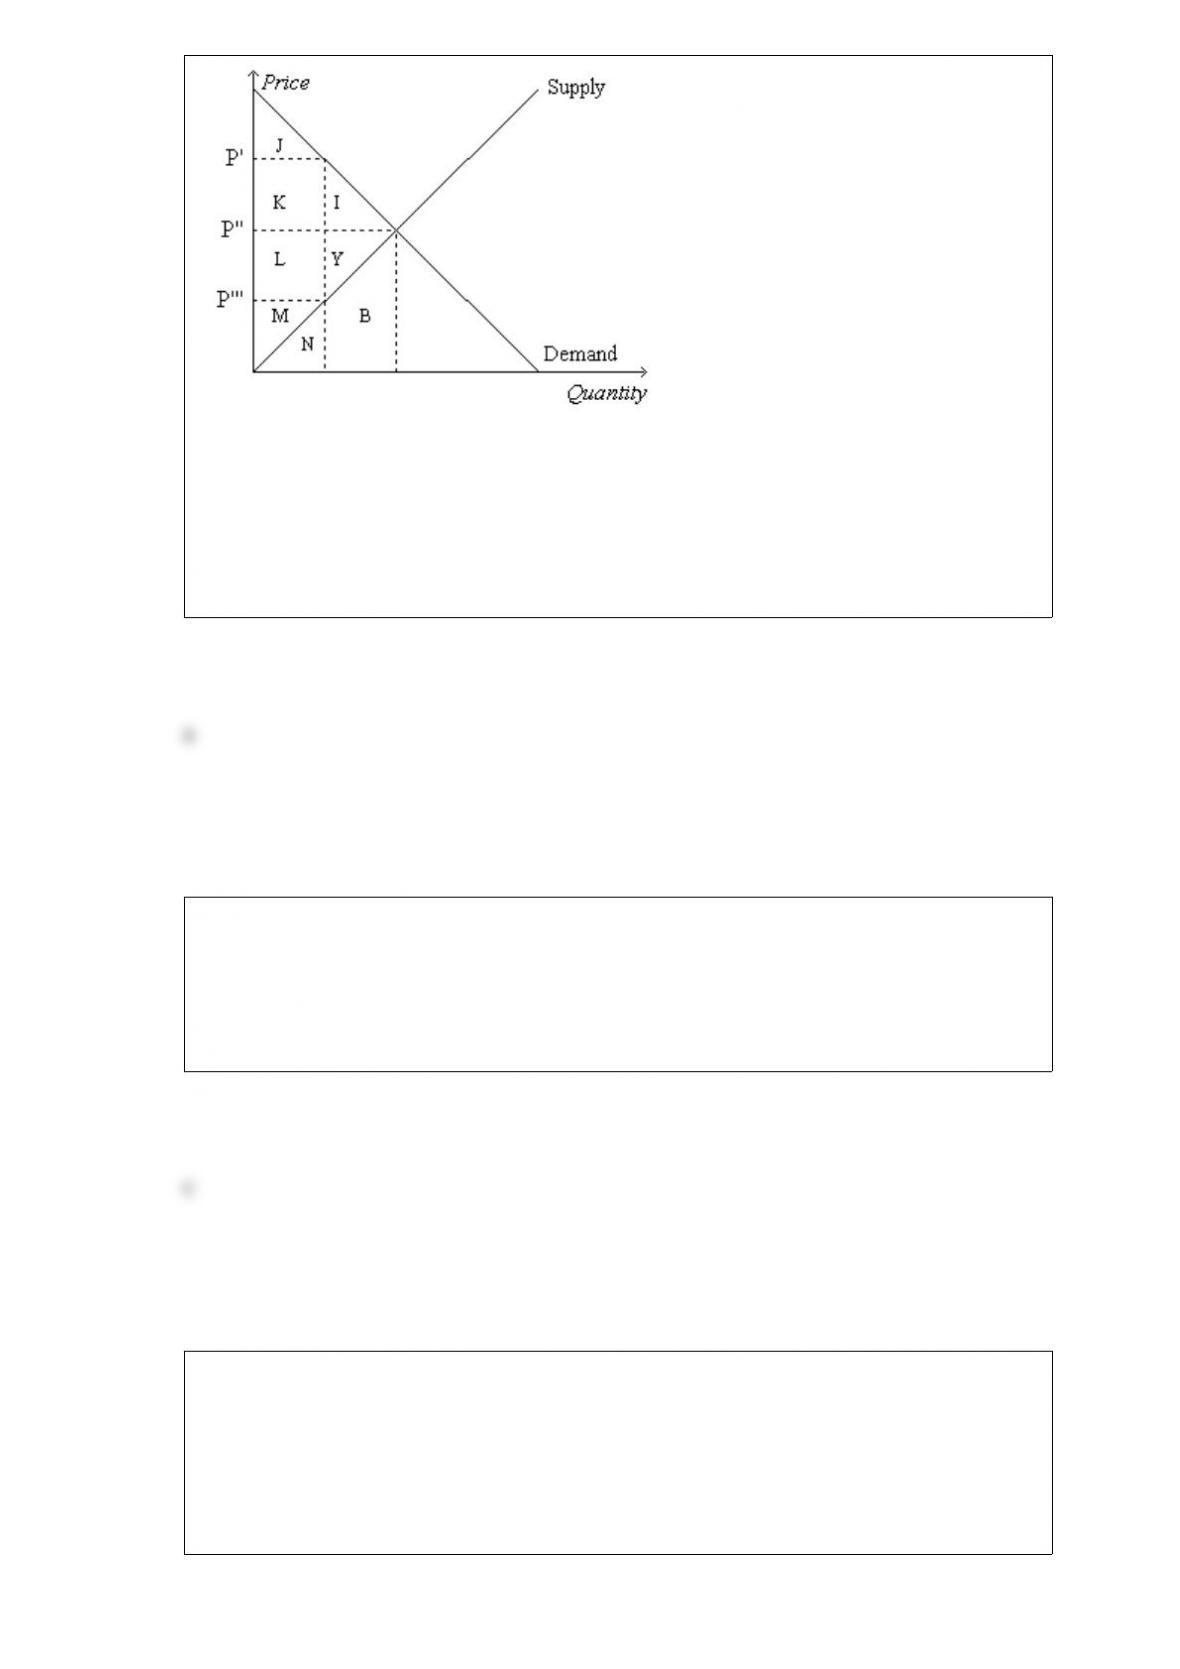
Refer to Figure 81. Suppose the government imposes a tax of P’ P”’. The area measured
by I+Y represents the
a. deadweight loss due to the tax.
b. loss in consumer surplus due to the tax.
c. loss in producer surplus due to the tax.
d. total surplus before the tax.
Today, people changed their expectations about the future. This change
a. can cause a movement along a demand curve.
b. can affect future demand but not today’s demand.
c. can affect today’s demand.
d. cannot affect either today’s demand or future demand.
When studying how some event or policy affects a market, elasticity provides
information on the
a. change in the costs of production.
b. tradeoff between equality and efficiency.
c. effect on the budget deficit or surplus.
d. direction and magnitude of the effect.
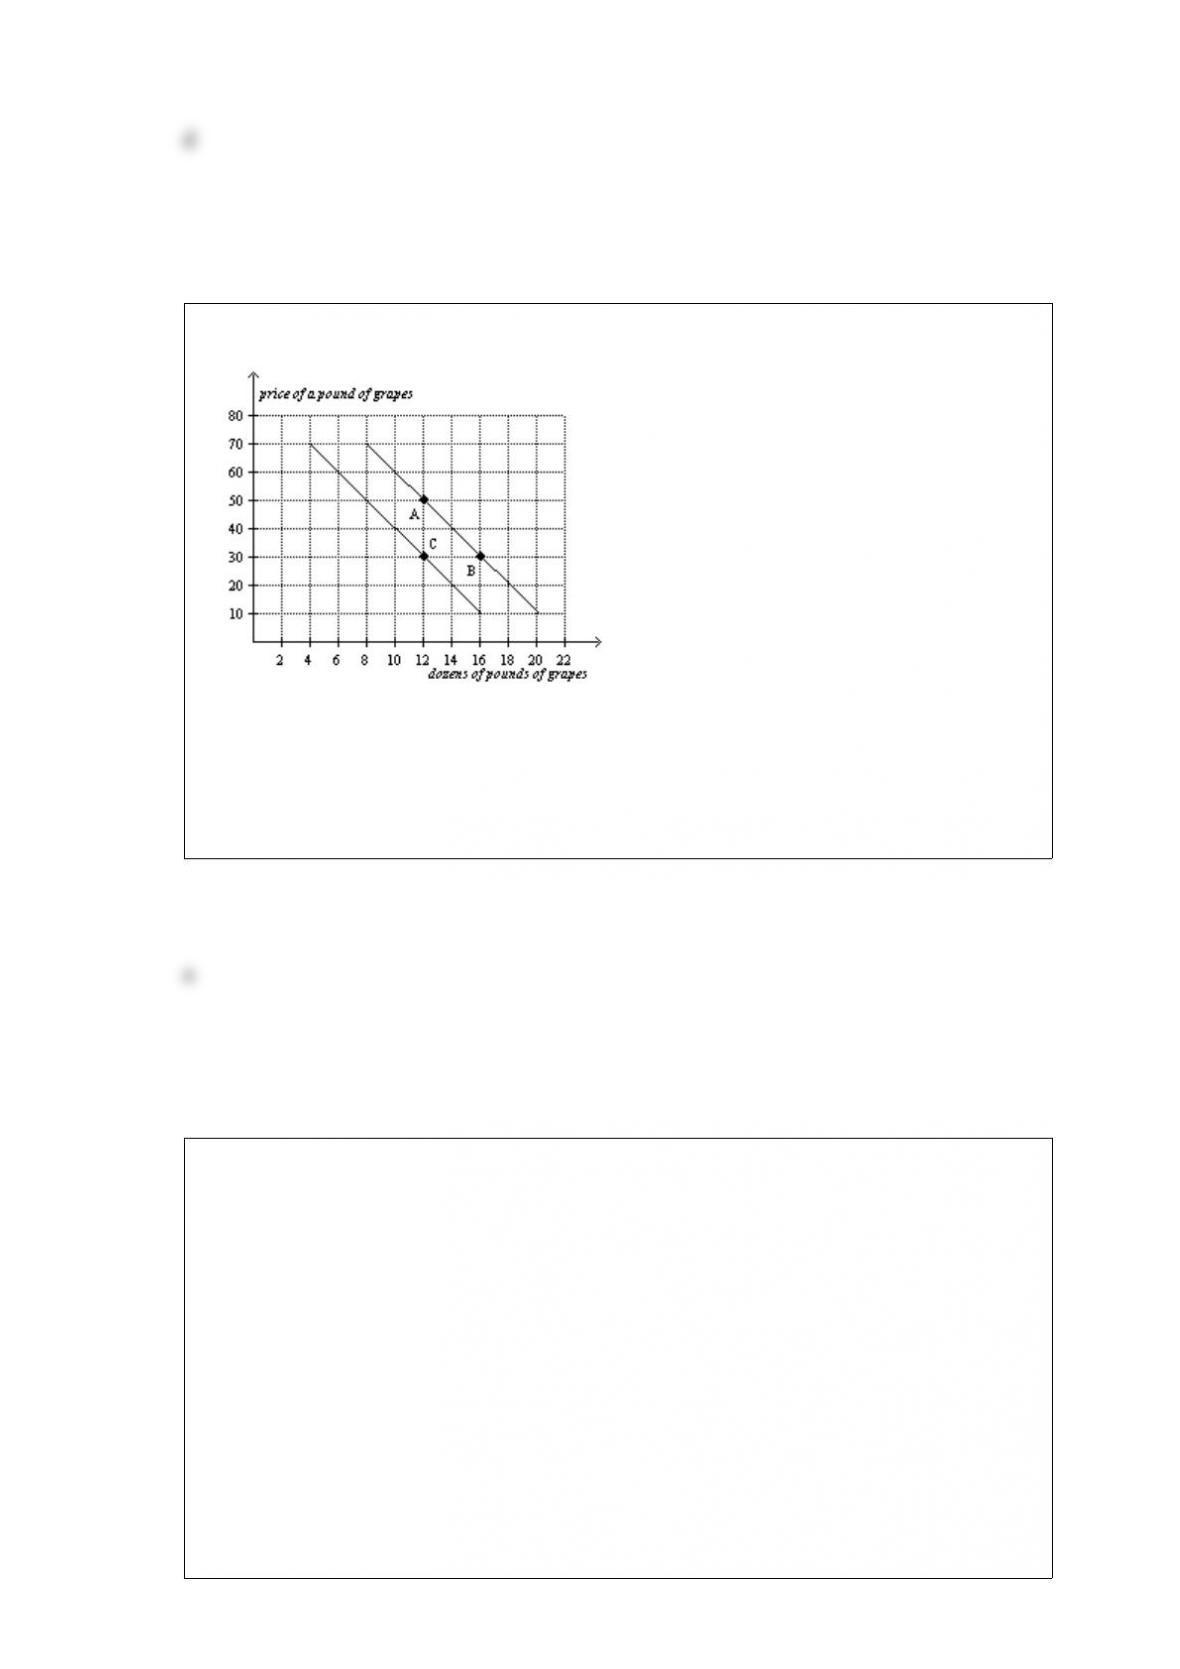
Figure 217
Refer to Figure 217. The movement from point B to point C is a(n)
a. shift of the demand curve.
b. movement along the demand curve.
c. indication that the price of grapes has changed.
d. indication that the costs incurred by firms that produce grapes have changed.
Table 411
PriceQuantity
DemandedQuantity
Supplied
$101060
$82045
$63030
$44015
$2500
Refer to Table 411. If the price were $4, a
a. surplus of 15 units would exist, and price would tend to fall.
b. shortage of 25 units would exist, and price would tend to rise.
c. surplus of 25 units would exist, and price would tend to fall.
d. shortage of 40 units would exist, and price would tend to rise.

Suppose the United States had a shortterm shortage of farmers. Which mechanisms
would adjust to remove the shortage?
a. The government would provide tax incentives to encourage people to become
farmers.
b. The government would subsidize the production of food.
c. The prices of food and the wages of farmers would adjust.
d. There are no mechanisms to remove the shortage.
One result of a tax, regardless of whether the tax is placed on the buyers or the sellers,
is that the
a. equilibrium quantity of the good is unchanged.
b. price the buyer effectively pays is lower.
c. supply curve for the good shifts upward by the amount of the tax.
d. tax reduces the welfare of both buyers and sellers.
Suppose that in Brazil total annual output is worth $600 million and people work 30
million hours. In Peru total annual output is worth $800 million and people work 50
million hours. Productivity is higher
a. in Brazil. Most variation in the standard of living across countries is due to
differences in productivity.
b. in Brazil. Differences in productivity explain very little of the variation in the
standard of living across countries.
c. in Peru. Most variation in the standard of living across countries is due to differences
in productivity.

d. in Peru. Differences in productivity explain very little of the variation in the standard
of living across countries.
When a tax is levied on buyers, the
a. supply curves shifts upward by the amount of the tax.
b. tax creates a wedge between the price buyers effectively pay and the price sellers
receive.
c. tax has no effect on the wellbeing of sellers.
d. All of the above are correct.
Economists build economic models by
a. generating data.
b. conducting controlled experiments in a lab.
c. making assumptions.
d. reviewing statistical forecasts.
Figure 46
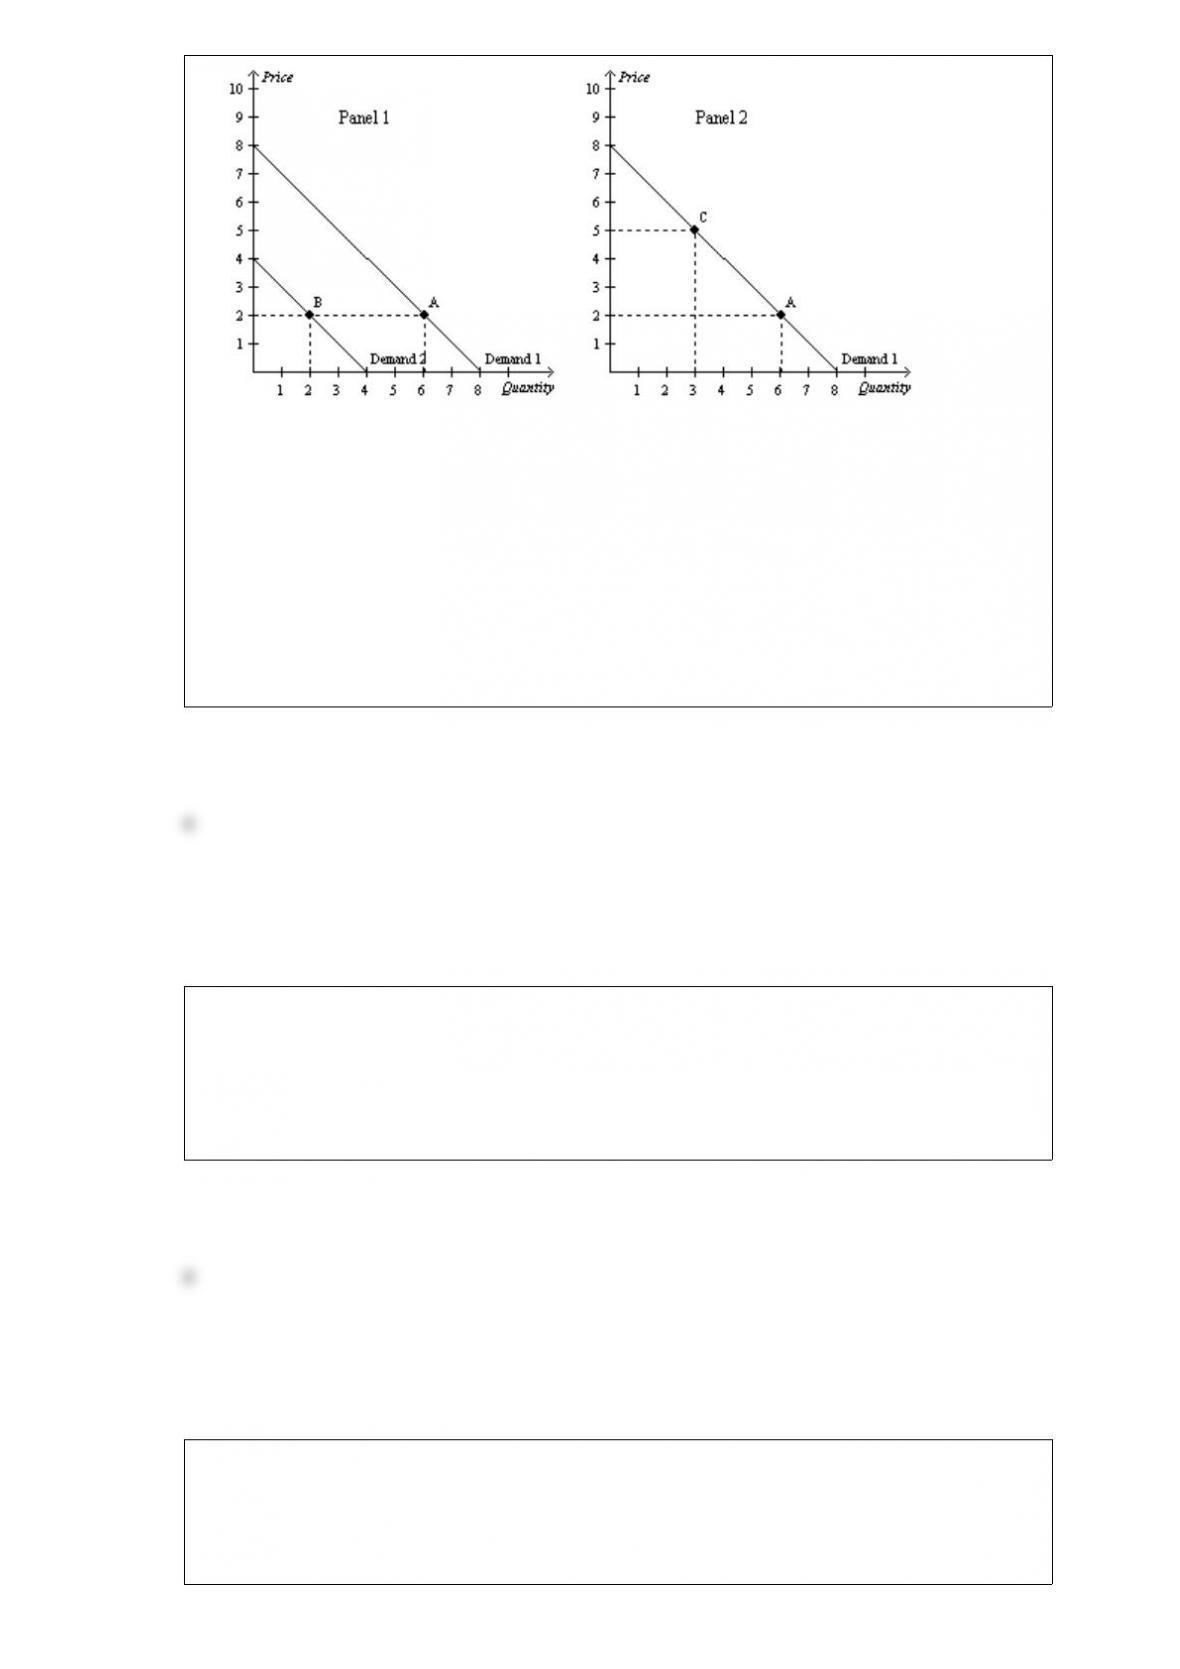
Refer to Figure 46. Suppose that the federal government is concerned about obesity in
the United States. Congress is considering two plans. One would require “junk food”
producers to include warning labels on all junk food. The other would impose a tax on
all products considered to be junk food. If the warning labels are successful, we could
illustrate the plan as producing a movement from
a. Point A to Point B in Panel 1.
b. Point B to Point A in Panel 1.
c. Point A to Point C in Panel 2.
d. Point C to Point A in Panel 2.
A tax levied on the sellers of a good shifts the
a. supply curve upward (or to the left).
b. supply curve downward (or to the right).
c. demand curve upward (or to the right).
d. demand curve downward (or to the left).
Table 510
Supply Curve XSupply Curve YSupply Curve Z
Price $5.00$7.00$5.00$7.00$5.00$7.00
Quantity Supplied200300300400400500
Refer to Table 510. Using the midpoint method, which of the three supply curves has
the most elastic price elasticity of supply?
a. Supply curve X
b. Supply curve Y
c. Supply curve Z
d. There is no difference in the elasticity of the three supply curves.
Which of the following is correct concerning opportunity cost?
a. Except to the extent that you pay more for them, opportunity costs should not include
the cost of things you would have purchased anyway.
b. To compute opportunity costs, you should subtract benefits from costs.
c. Opportunity costs and the idea of tradeoffs are not closely related.
d. Rational people should compare various options without considering opportunity
costs.
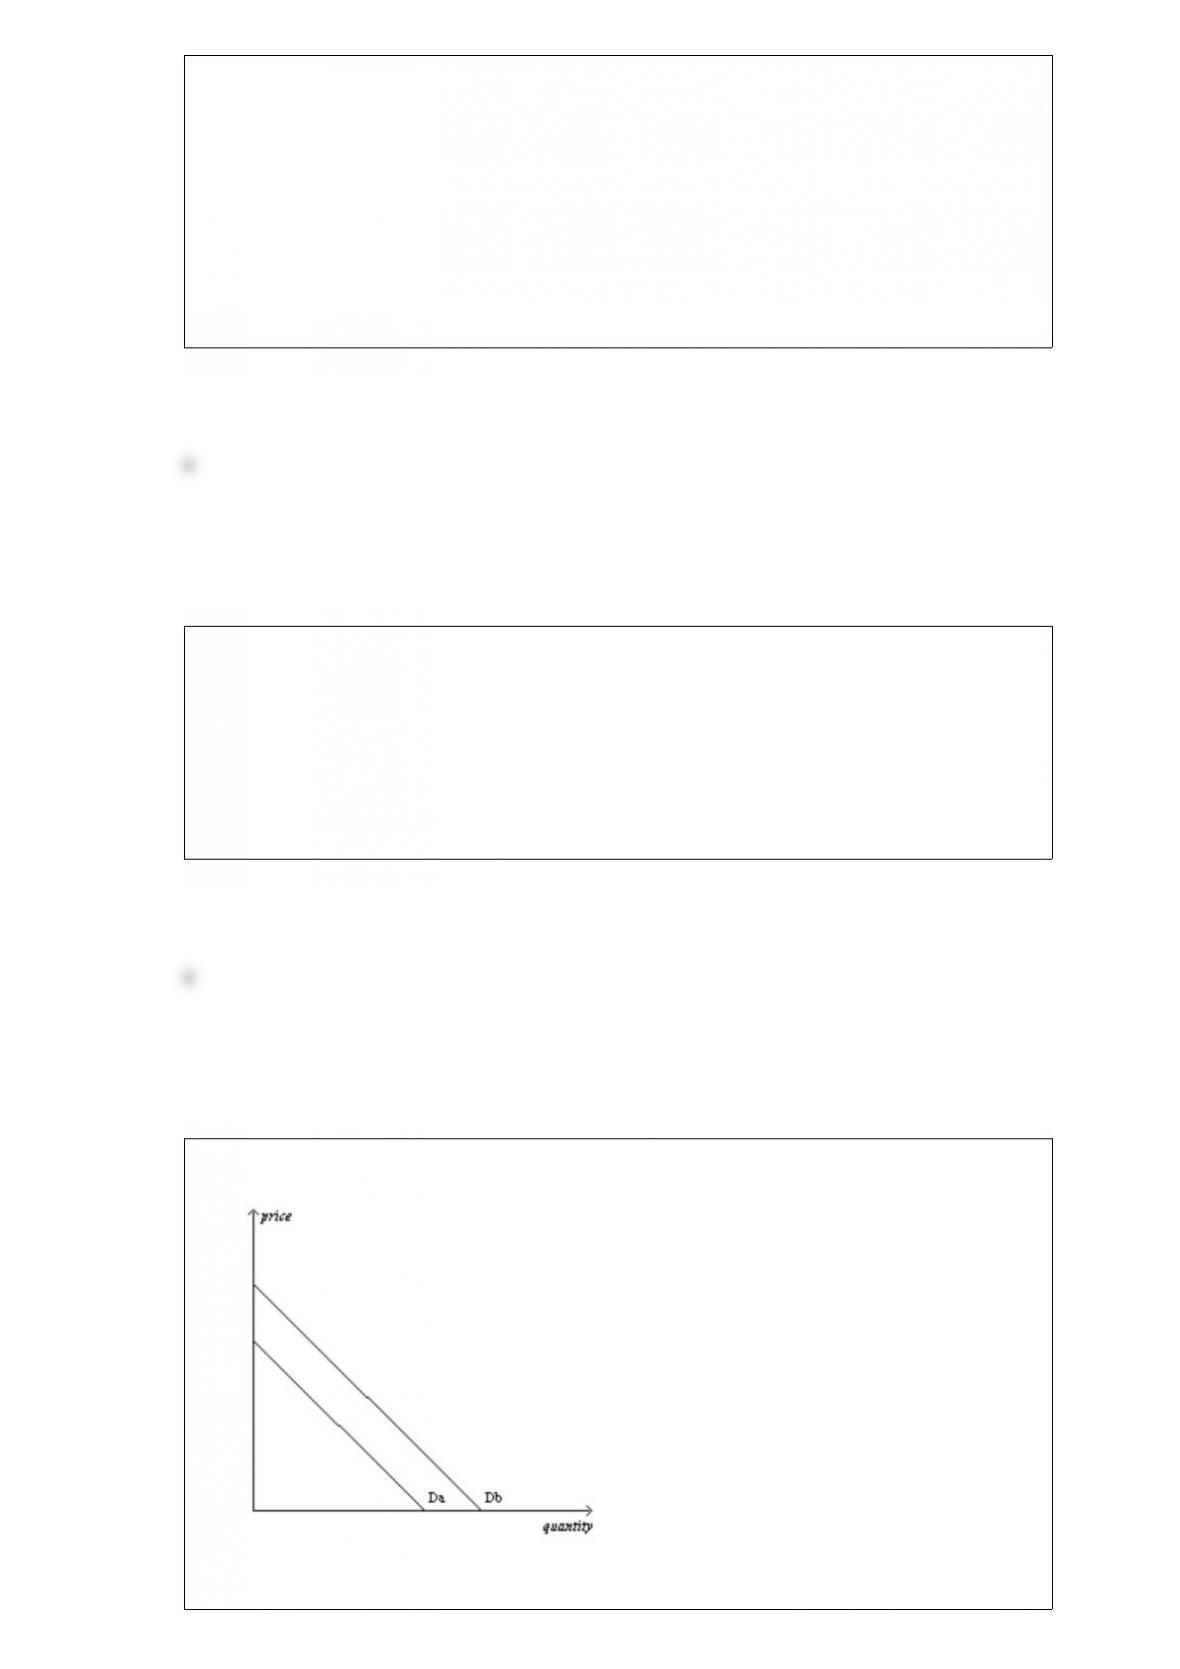
Figure 47
Refer to Figure 47. The movement from Db to Da could be caused by
a. a decrease in price.
b. an increase in the price of a complement.
c. a technological advance.
d. an increase in the price of a substitute.
Figure 925
The following diagram shows the domestic demand and supply in a market. Assume
that the world price in this market is $10 per unit.
Refer to Figure 925. Suppose the government imposes a tariff of $5 per unit. With
trade and a tariff, total surplus is
a. $1,700.
b. $1,800.
c. $1,900.
d. $2,000.

Suppose France imposes a tariff on wine of 3 euros per bottle. If government revenue
from the tariff amounts to 30 million euros per year and if the quantity of wine supplied
by French wine producers, with the tariff, is 8 million bottles per year, then we can
conclude that
a. the quantity of wine demanded by France, with the tariff, is 18 million bottles per
year.
b. the quantity of wine demanded by France, without the tariff, would be 24 million
bottles per year.
c. the amount of the deadweight loss is 24 million euros per year.
d. the tariff causes French buyers of wine to pay 2 euros more per bottle than they
would pay without the tariff.
A demand schedule is a table that shows the relationship between
a. quantity demanded and quantity supplied.
b. income and quantity demanded.
c. price and quantity demanded.
d. price and income.
Figure 36
Maxine’s Production Possibilities FrontierDaisy’s Production Possibilities Frontier
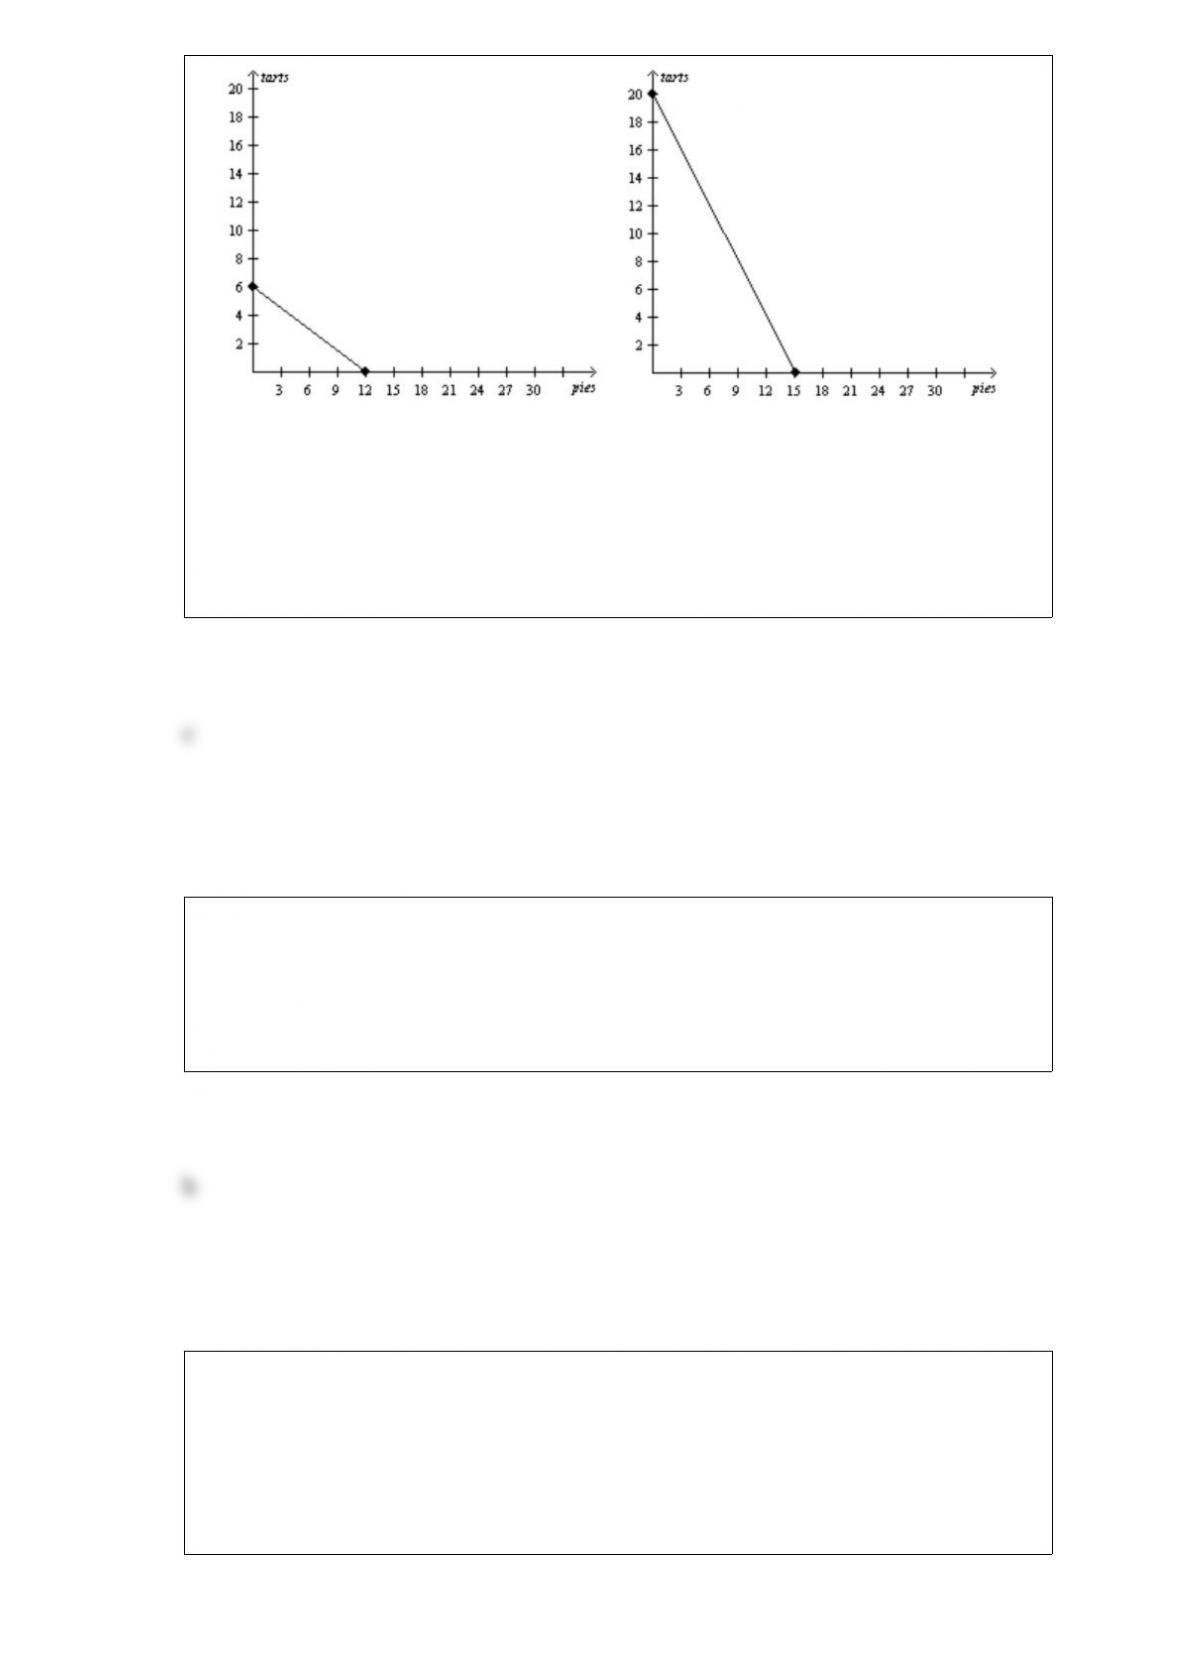
Refer to Figure 36. If Daisy must work 2.5 hours to make each pie, then her production
possibilities frontier is based on how many hours of work?
a. 6 hours
b. 7.5 hours
c. 37.5 hours
d. 50 hours
To say that a price ceiling is nonbinding is to say that the price ceiling
a. results in a surplus.
b. is set above the equilibrium price.
c. causes quantity demanded to exceed quantity supplied.
d. All of the above are correct.
The view held by Arthur Laffer and Ronald Reagan that cuts in tax rates would
encourage people to increase the quantity of labor they supplied became known as
a. California economics.
b. welfare economics.
c. supplyside economics.
d. elasticity economics.

Scenario 53
The supply of aged cheddar cheese is inelastic, and the supply of bread is elastic. Both
goods are considered to be normal goods by a majority of consumers. Suppose that a
large income tax increase decreases the demand for both goods by 10%.
Refer to Scenario 53. The equilibrium price will
a. increase in both the aged cheddar cheese and bread markets.
b. increase in the aged cheddar cheese market and decrease in the bread market.
c. decrease in the aged cheddar cheese market and increase in the bread market.
d. decrease in both the aged cheddar cheese and bread markets.
Table 315
Labor Hours Needed to Make 1 Pound ofAmount Produced in 40 Hours
MeatPotatoesMeatPotatoes
Farmer8 hours/pound5 hours/pound5 pounds8 pounds
Rancher4 hours/pound10 hours/pound10 pounds4 pounds
Refer to Table 315. Assume that the farmer and the rancher each has 40 labor hours
available. If each person divides his time equally between the production of meat and
potatoes, then total production is
a. 5 pounds of meat and 4 pounds of potatoes.
b. 6 pounds of meat and 7.5 pounds of potatoes.
c. 7.5 pounds of meat and 6 pounds of potatoes.
d. 10 pounds of meat and 8 pounds of potatoes.
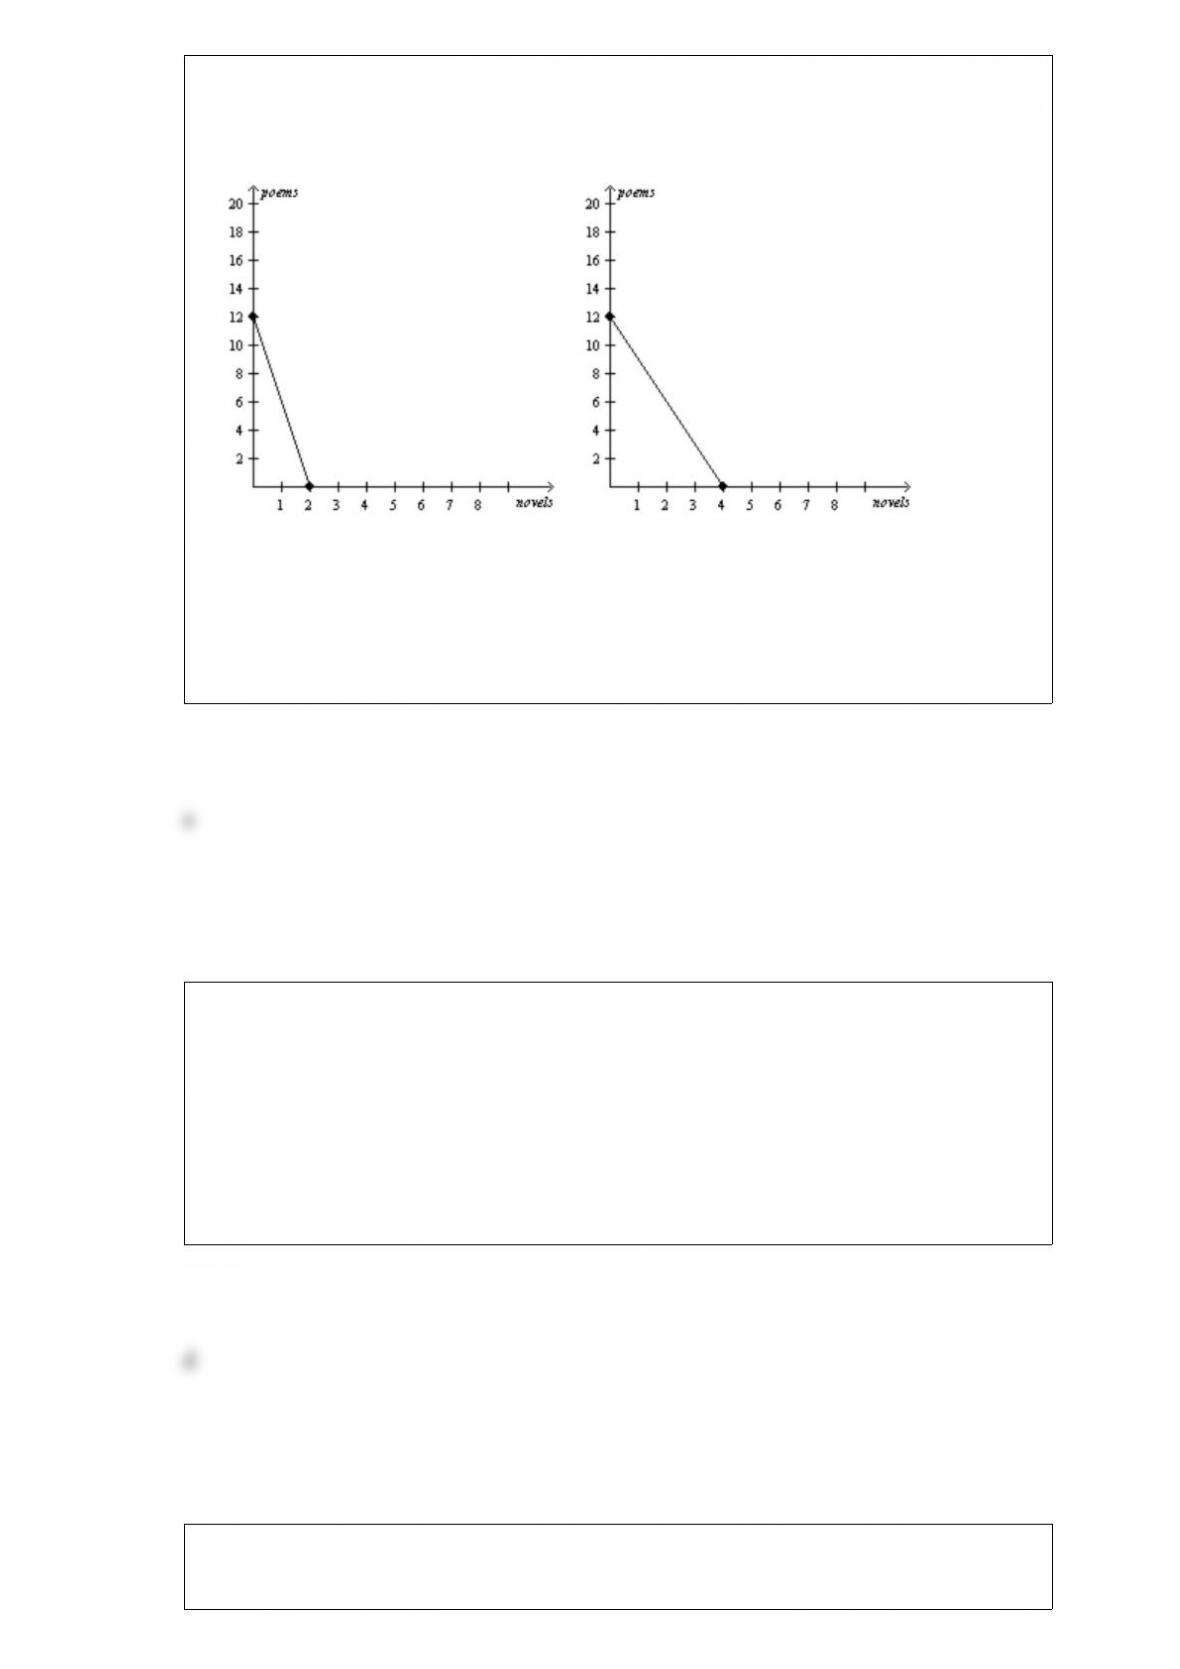
Figure 315
Perry’s Production Possibilities FrontierJordan’s Production Possibilities Frontier
Refer to Figure 315. Which of the following is not correct?
a. Perry and Jordan could each consume 2 novels and 6 poems without trade.
b. Jordan could consume 2 novels and 6 poems both with and without trade.
c. Perry and Jordan could each consume 2 novels and 6 poems with trade.
d. Perry and Jordan could each consume 12 poems without trade.
For a country that is considering the adoption of either a tariff or an import quota on a
particular good, an important difference is that
a. an import quota has no effect on consumer surplus, while a tariff decreases consumer
surplus.
b. an import quota has no effect on producer surplus, while a tariff decreases producer
surplus.
c. a tariff raises total surplus, while an import quota does not.
d. a tariff raises revenue for that country’s government, while an import quota does not.
When constructing a production possibilities frontier, which of the following
assumptions is not made?

a. The economy produces only two goods or two types of goods.
b. Firms produce goods using factors of production.
c. The technology available to firms is given.
d. The quantities of the factors of production that are available are increasing over the
relevant time period.
Suppose that when the price of wheat is $2 per bushel, farmers can sell 10 million
bushels. When the price of wheat is $3 per bushel, farmers can sell 8 million bushels.
Which of the following statements is true? The demand for wheat is
a. income inelastic, so an increase in the price of wheat will increase the total revenue
of wheat farmers.
b. income elastic, so an increase in the price of wheat will increase the total revenue of
wheat farmers.
c. price inelastic, so an increase in the price of wheat will increase the total revenue of
wheat farmers.
d. price elastic, so an increase in the price of wheat will increase the total revenue of
wheat farmers.
Table 715
The following table represents the costs of five possible sellers.
SellerCost ($)
Quentin10
Ruby30
Sandra60
Thomas100
Ursula150
Refer to Table 715. If each producer has one unit available for sale, and if the market
equilibrium price is $70, how much is the combined total cost of all participating sellers
in the market?
a. $100
b. $150
c. $250
d. $350
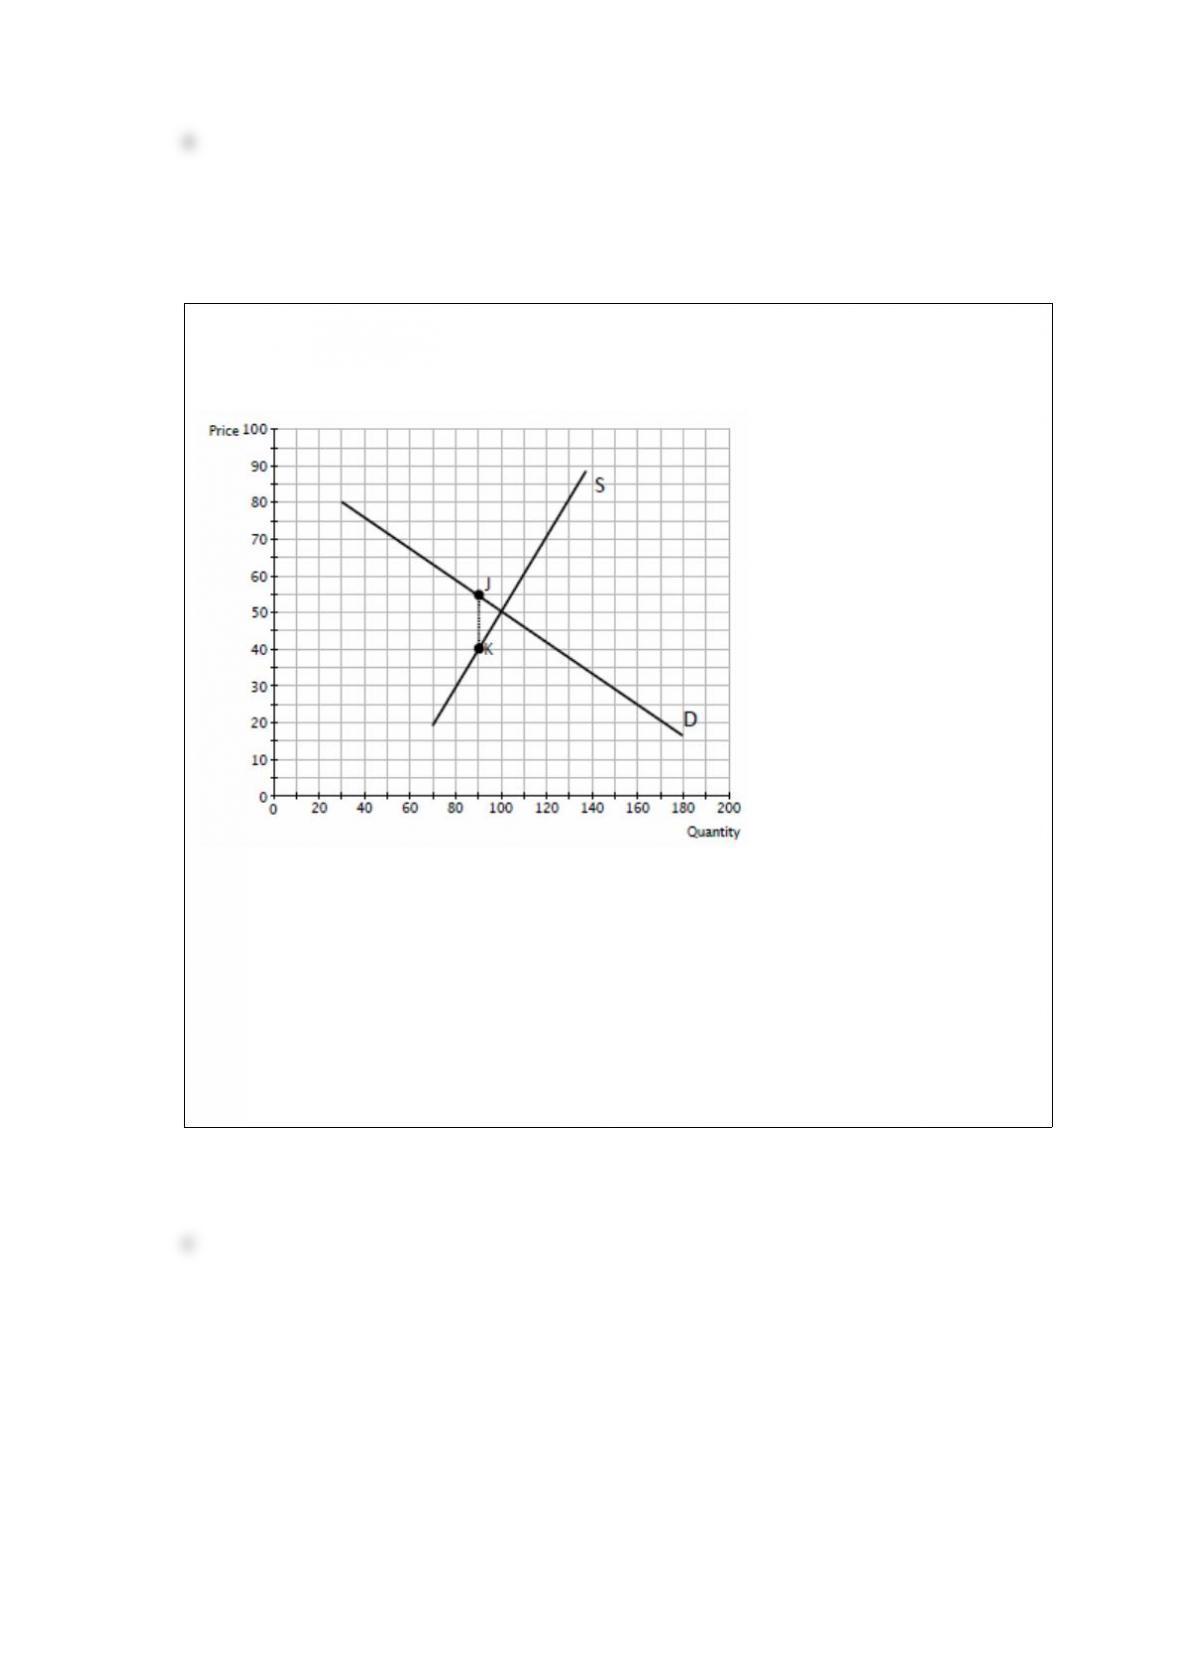
Figure 633
The diagram shows the effect of a tax as measured by the distance between J and K.
Refer to Figure 633. Based upon the diagram,
a. more of the incidence of the tax is on buyers, since the demand curve is more elastic
than the supply curve.
b. more of the incidence of the tax is on sellers, since the demand curve is less elastic
than is the supply curve .
c. more of the incidence of the tax is on sellers, since supply is more inelastic than
demand.
d. more of the incidence of the tax is on buyers, since supply is more inelastic than
demand.