
You know an economist has crossed the line from scientist to policy adviser when he or
she
a. claims that the problem at hand is widely misunderstood by noneconomists.
b. talks about the evidence.
c. makes normative statements.
d. makes a claim about how the world is.
Ken and Traci are two woodworkers who both make tables and chairs. In one month,
Ken can make 3 tables or 18 chairs, whereas Traci can make 8 tables or 24 chairs.
Given this, we know that the opportunity cost of 1 chair is
a. 1/6 table for Ken and 1/3 table for Traci.
b. 1/6 table for Ken and 3 tables for Traci.
c. 6 tables for Ken and 1/3 table for Traci.
d. 6 tables for Ken and 3 tables for Traci.
HTMLENTITY#8203HTMLENTITYIn a market with a binding price control,
a. there is an imbalance between the quantity supplied by sellers and the quantity
demanded by buyers.
b. HTMLENTITY#8203HTMLENTITYthe costs of production are fully reflected in
the price paid.
c. HTMLENTITY#8203HTMLENTITYthe price observe reflects the scarcity of the
good.
d. HTMLENTITY#8203HTMLENTITYall of the above are true.
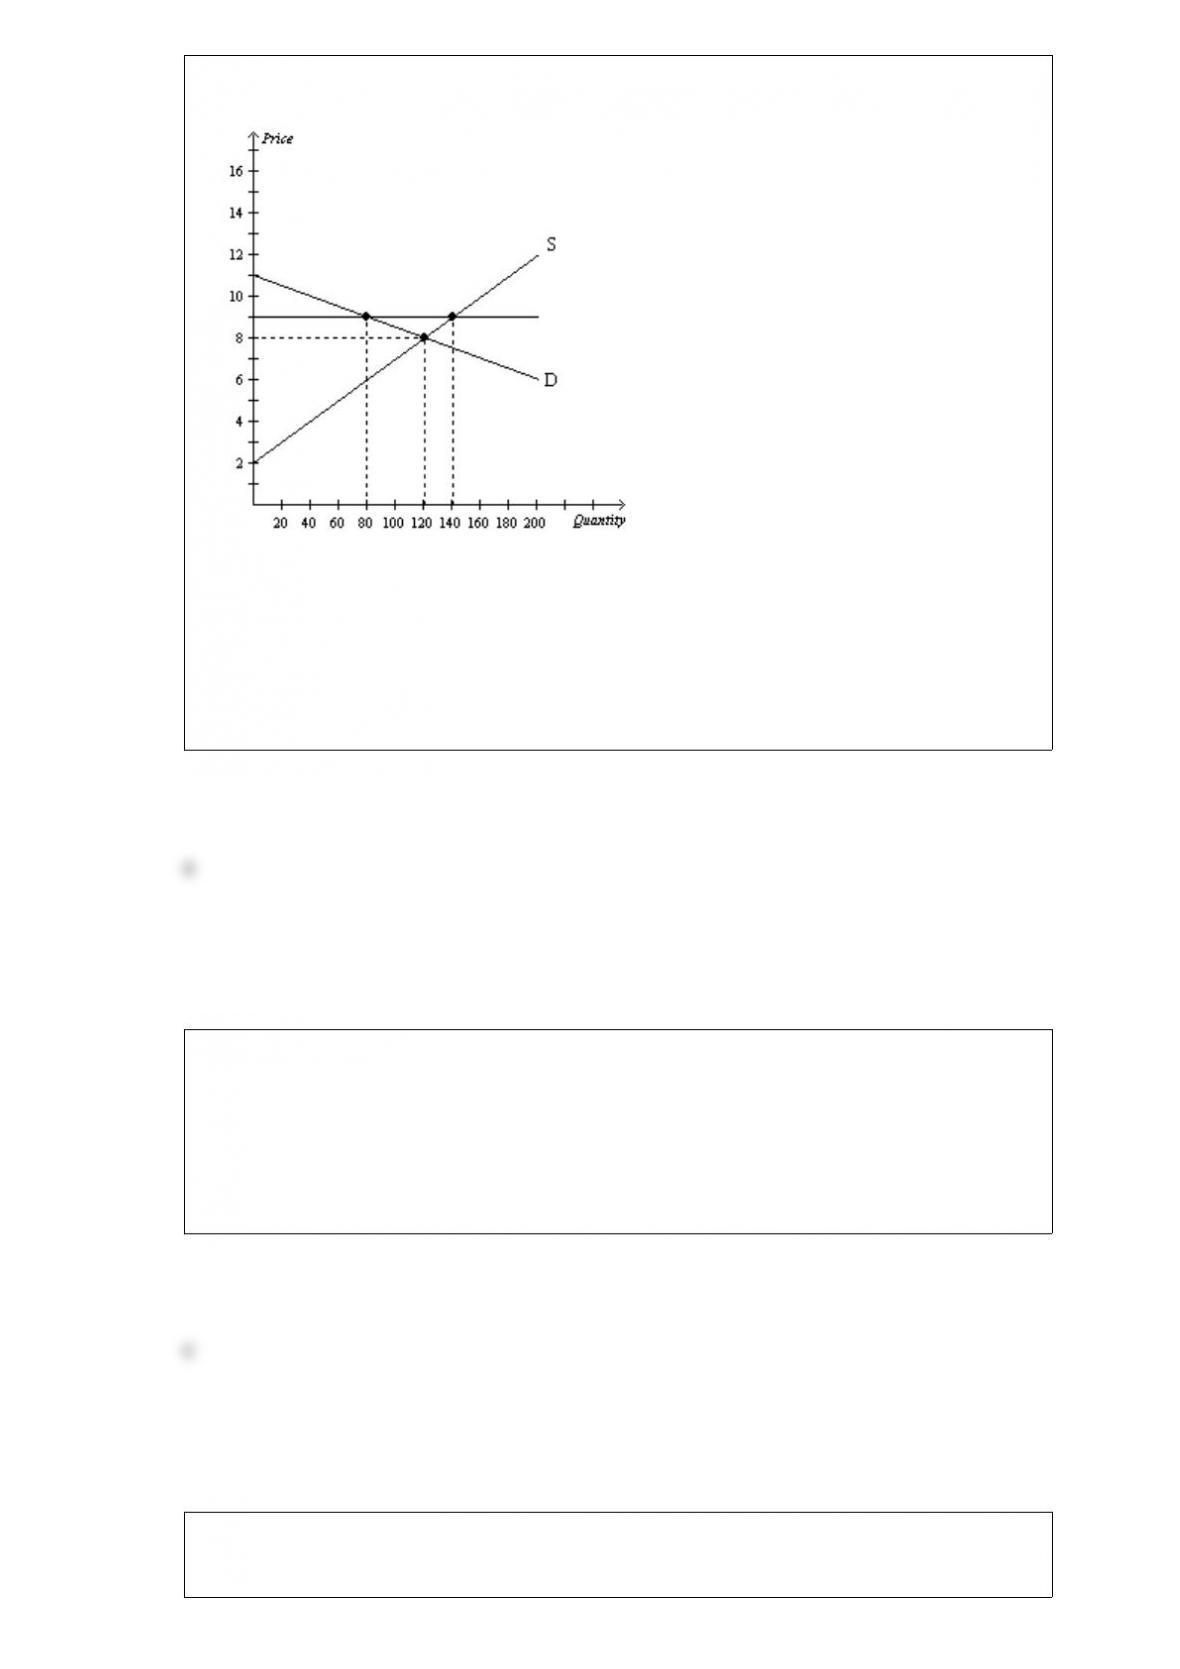
Figure 65
Refer to Figure 65. If the solid horizontal line on the graph represents a price floor,
then the price floor is
a. binding and creates a surplus of 60 units of the good.
b. binding and creates a surplus of 20 units of the good.
c. binding and creates a surplus of 40 units of the good.
d. not binding, and there will be no surplus or shortage of the good.
The term “productivity”
a. means the same thing as “efficiency.”
b. is seldom used by economists, as its meaning is not precise.
c. refers to the quantity of goods and services produced from each unit of labor input.
d. refers to the variety of goods and services from which households can choose when
they shop.
If a 25% change in price results in a 40% change in quantity supplied, then the price
elasticity of supply is about
a. 0.63, and supply is elastic.
b. 0.63, and supply is inelastic.
c. 1.60, and supply is elastic.
d. 1.60, and supply is inelastic.
Benefits from trade would not include
a. the ability of people and nations to specialize.
b. a greater variety of goods and services becoming available.
c. less competition.
d. lower prices.
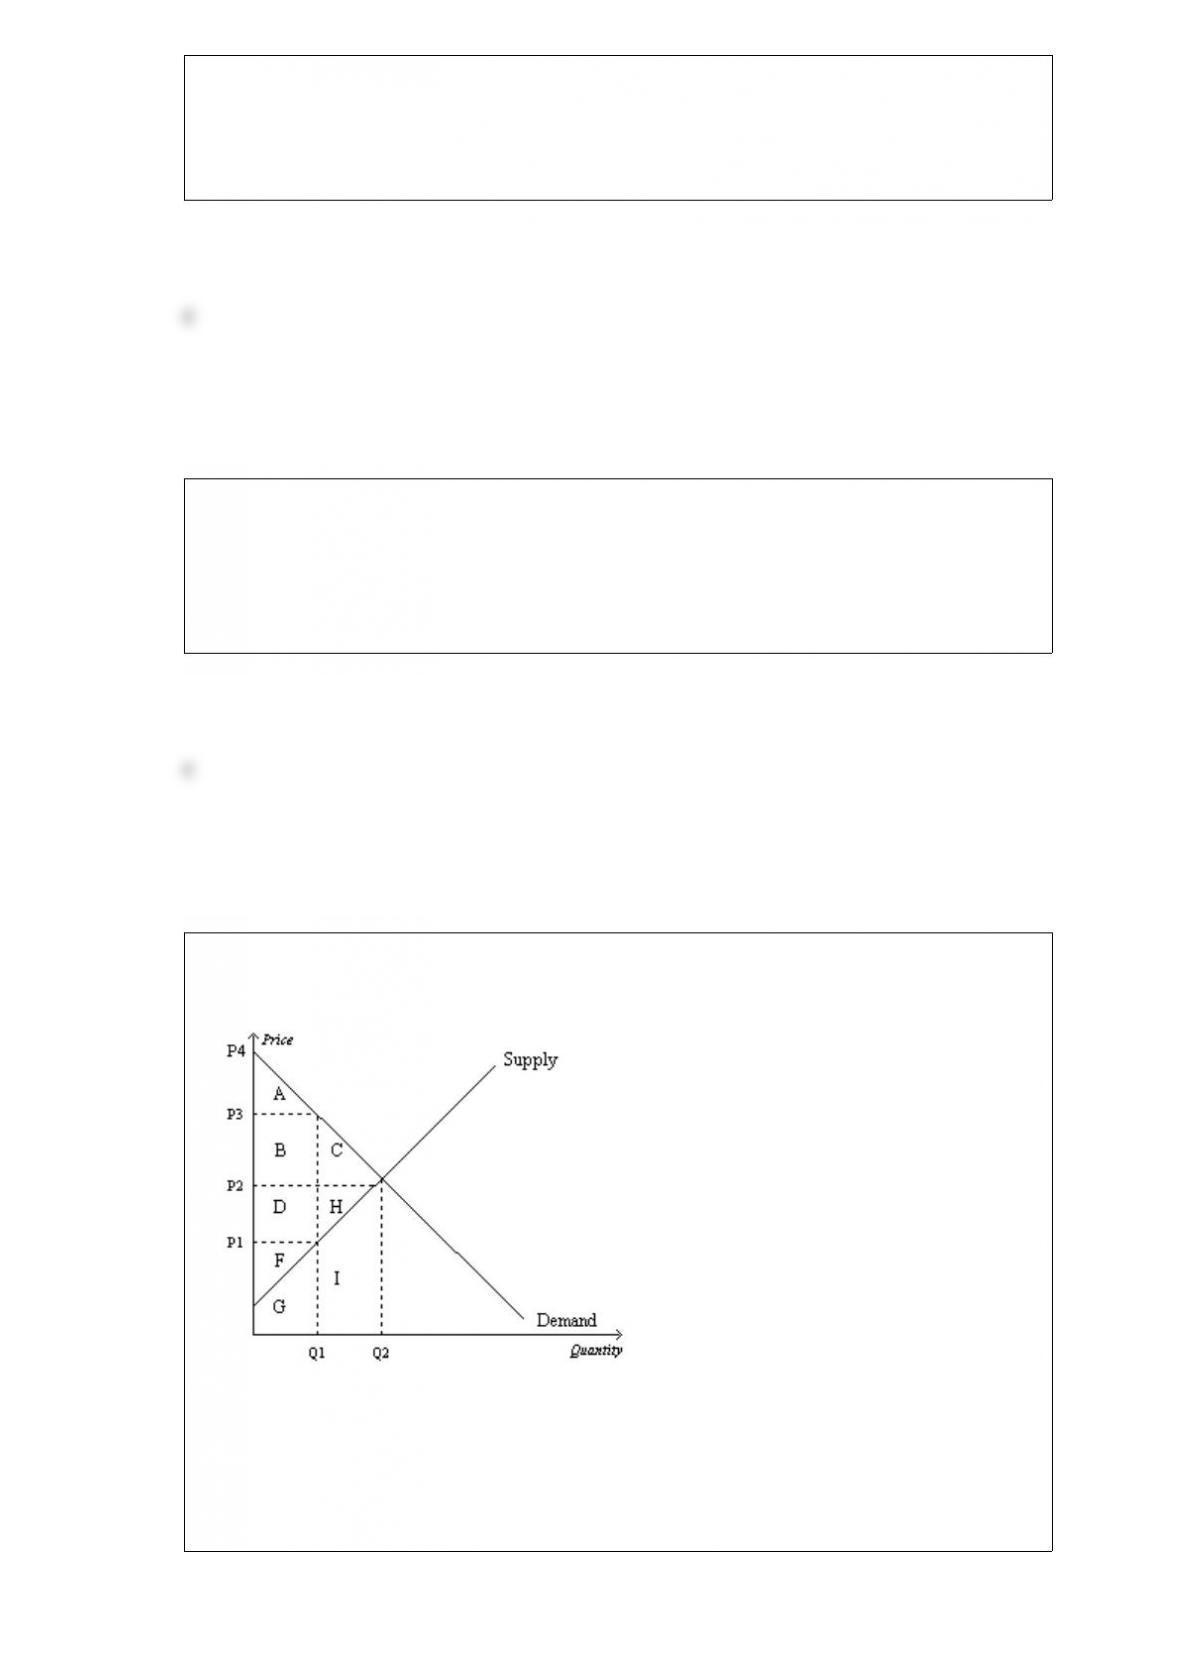
Figure 723
Refer to Figure 723. At equilibrium, producer surplus is represented by the area
a. F.
b. F+G.
c. D+H+F.
d. D+H+F+G+I.
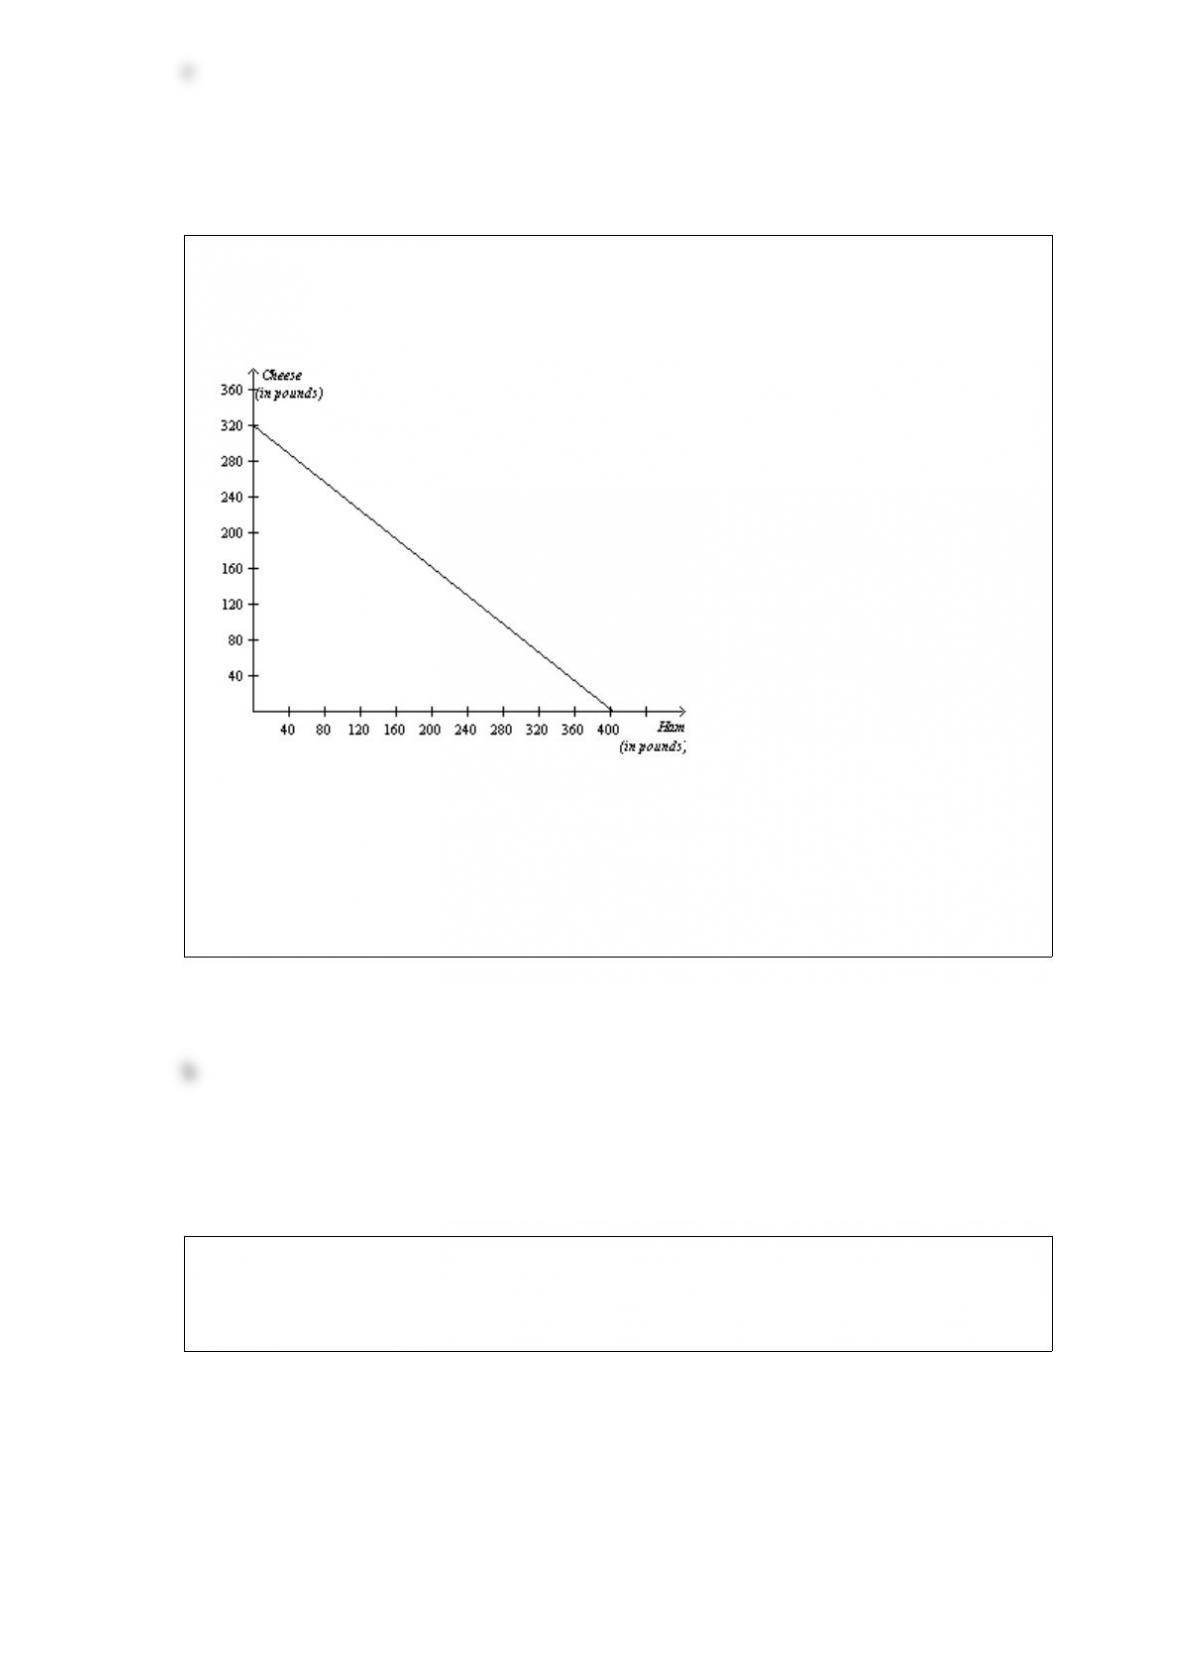
Figure 323
The graph below represents the various combinations of ham and cheese (in pounds)
that the nation of Bonovia could produce in a given month.
Refer to Figure 323. Whenever Bonovia increases its production of ham by 1 pound
per month, then it must decrease its production of cheese by
a. 0.75 pound.
b. 0.80 pound.
c. 1.00 pounds.
d. 1.25 pounds.
Figure 312
Argentina’s Production Possibilities FrontierPeru’s Production Possibilities
Frontier
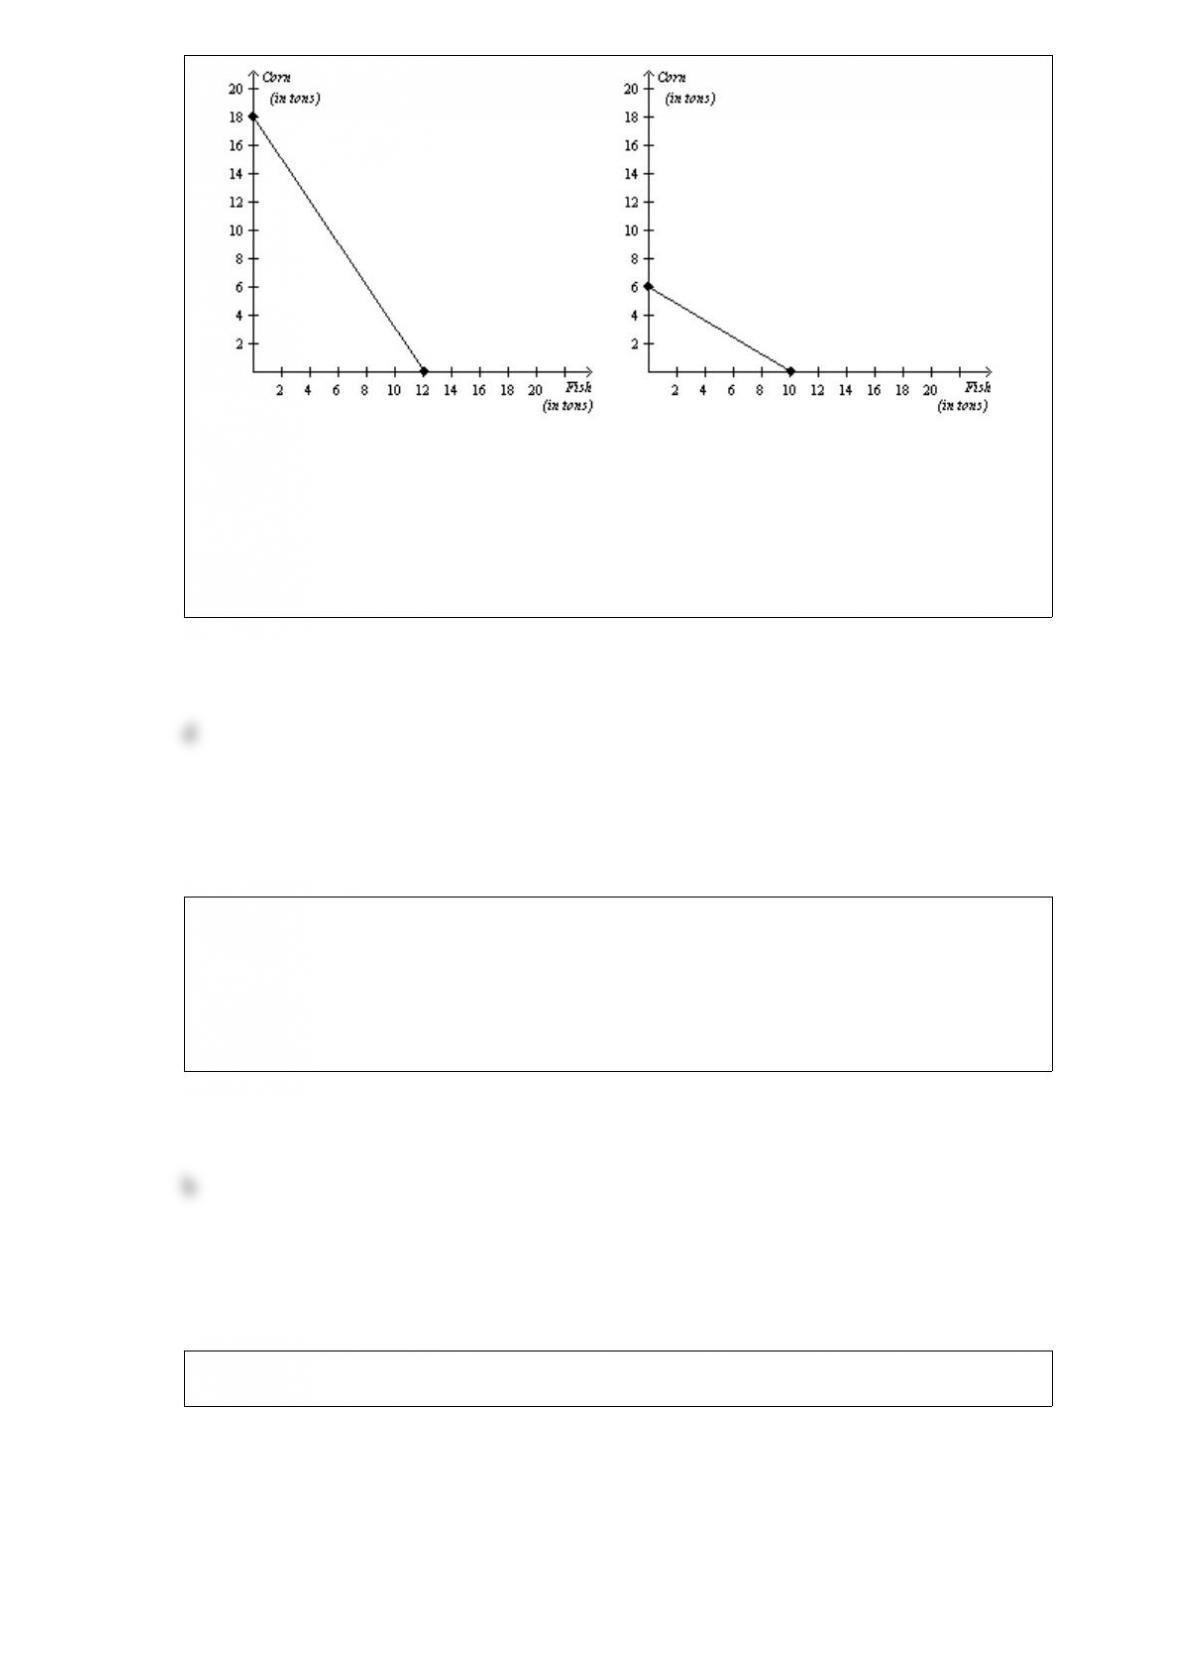
Refer to Figure 312. If Argentina and Peru each divides its time equally between
producing corn and fish, then total production is
a. 13 tons of corn and 15 tons of fish.
b. 13 tons of corn and 10 tons of fish.
c. 12 tons of corn and 16 tons of fish.
d. 12 tons of corn and 11 tons of fish
When a good is taxed, the burden of the tax
a. falls more heavily on the side of the market that is more elastic.
b. falls more heavily on the side of the market that is more inelastic.
c. falls more heavily on the side of the market that is closer to unit elastic.
d. is distributed independently of relative elasticities of supply and demand.
Figure 26
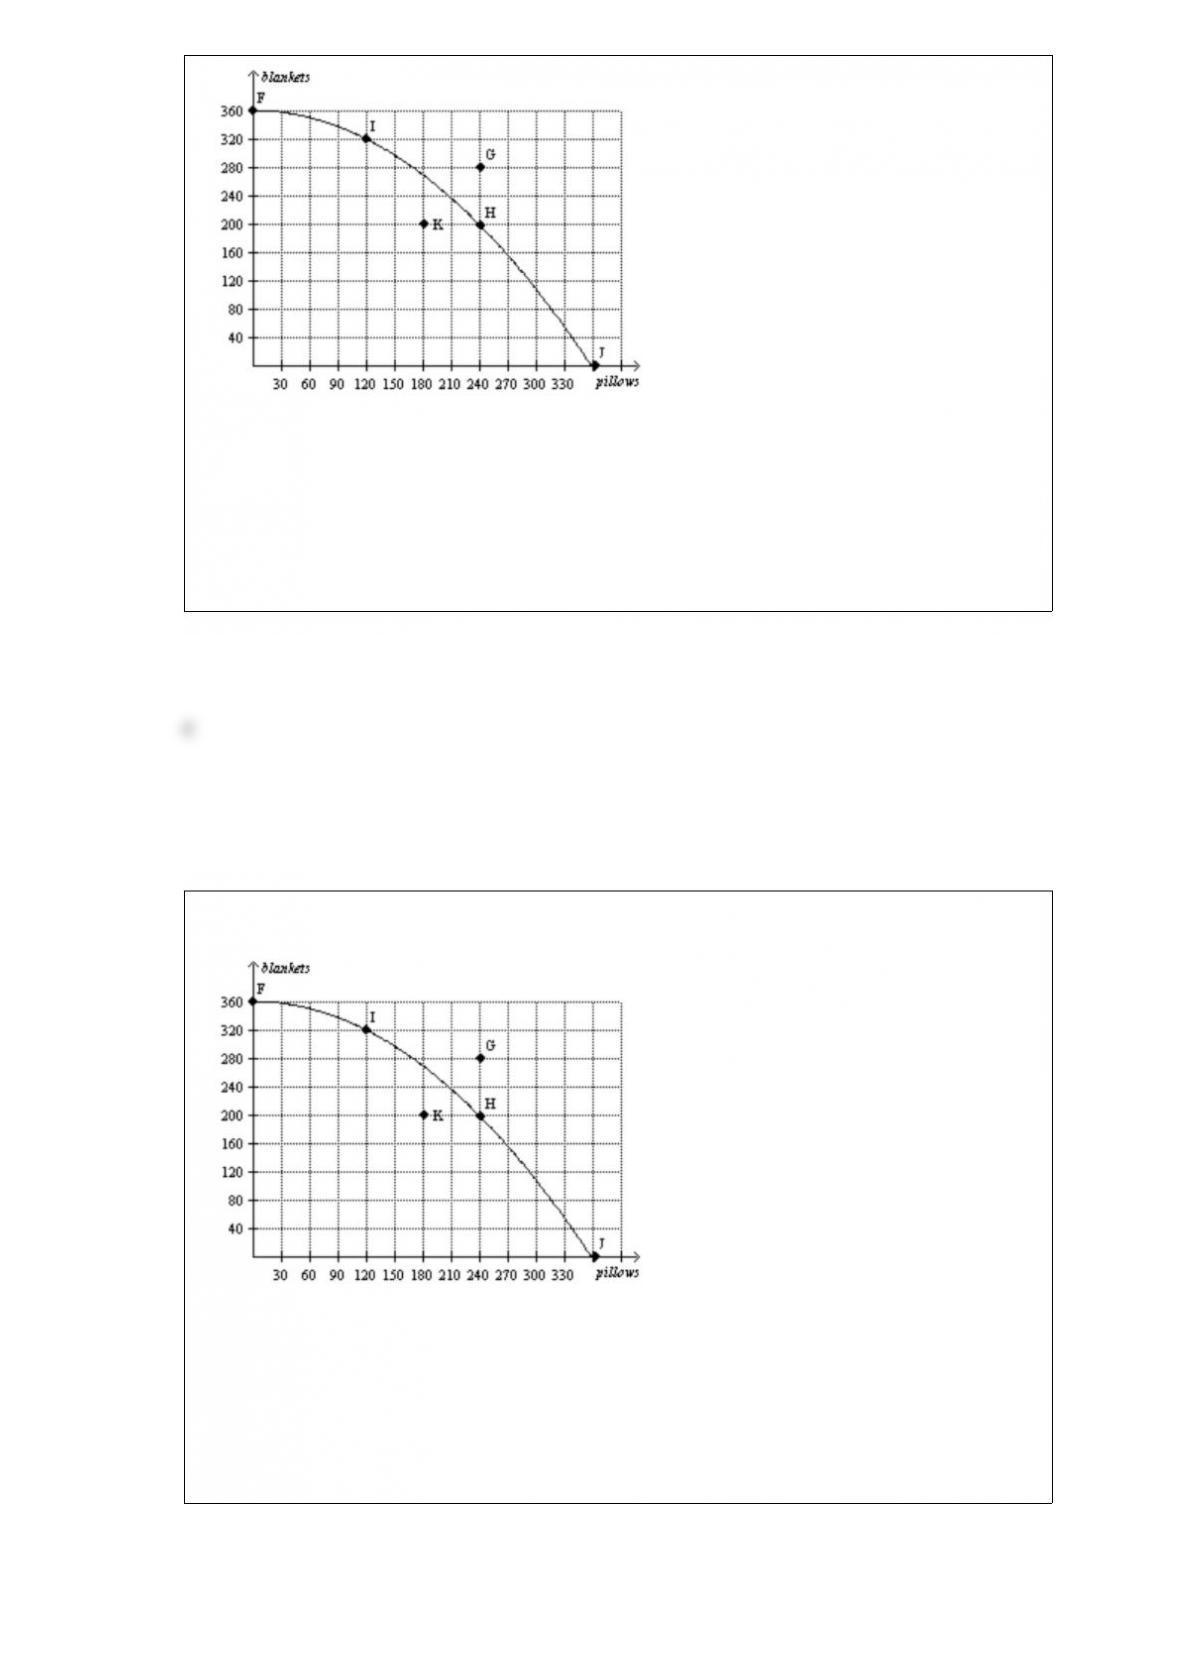
Refer to Figure 26. The opportunity cost of this economy moving from point I to point
F is
a. zero.
b. 40 blankets.
c. 120 pillows.
d. 360 blankets.
Figure 26
Refer to Figure 26. The opportunity cost of this economy moving from point K to
point H is
a. zero.
b. 50 blankets.
c. 60 pillows.
d. 50 blankets and 60 pillows.
In the United States, the overall level of prices more than doubled during the
a. 1950s.
b. 1960s.
c. 1970s.
d. 1980s.
Figure 78
Refer to Figure 78. If the government imposes a price ceiling of $80 in this market,
then, assuming those with the highest willingness to pay purchase the good, consumer
surplus will be
a. $900.
b. $1,200.
c. $1,500.
d. $1,600.

Last year, Max bought 6 pairs of athletic shoes when his income was $35,000. This
year, his income is $42,000, and he purchased 8 pairs of athletic shoes. Holding other
factors constant, it follows that Max
a. considers athletic shoes to be necessities.
b. considers athletic shoes to be inferior goods.
c. considers athletic shoes to be normal goods.
d. has a low price elasticity of demand for athletic shoes.
Which of the following is the best explanation for why President Harry Truman once
said that he wanted to find a onearmed economist?
a. President Truman received input from so many economists that he only wanted one
view from each.
b. President Truman thought economists should analyze policies but not make or
enforce them.
c. Economists understand that most policy decisions involve tradeoffs so they are likely
to present multiple views of policies.
d. A onearmed economist would conduct only positive analysis and no normative
analysis.
Which of the following statements does not help to explain why government drug
interdiction increases drugrelated crime?
a. The demand for illegal drugs is inelastic.
b. Interdiction results in drug addicts having a greater need for quick cash.
c. Interdiction results in an increase in the amount of money needed to buy the same
amount of drugs.
d. Government drug programs are more lenient now with drug offenders than they were
in the 1980s.
Sometimes economists disagree because their values differ. Which of the following
instances best reflects this source of disagreement?
a. One economist believes the North American Free Trade Agreement (NAFTA) has led
to a loss of American jobs; another economist disputes this claim.
b. One economist believes that when income taxes are cut, people will increase their
spending; another economist believes that when income taxes are cut, people will
increase their saving.
c. One economist advises against increases in sales taxes because she thinks such
increases are unfair to lowincome people; another economist disputes the idea that
increases in sales taxes are unfair to lowincome people.
d. One economist believes that, prior to the Civil War, slavery contributed to economic
growth in the South; another economist believes that slavery held back the South’s
economic growth.
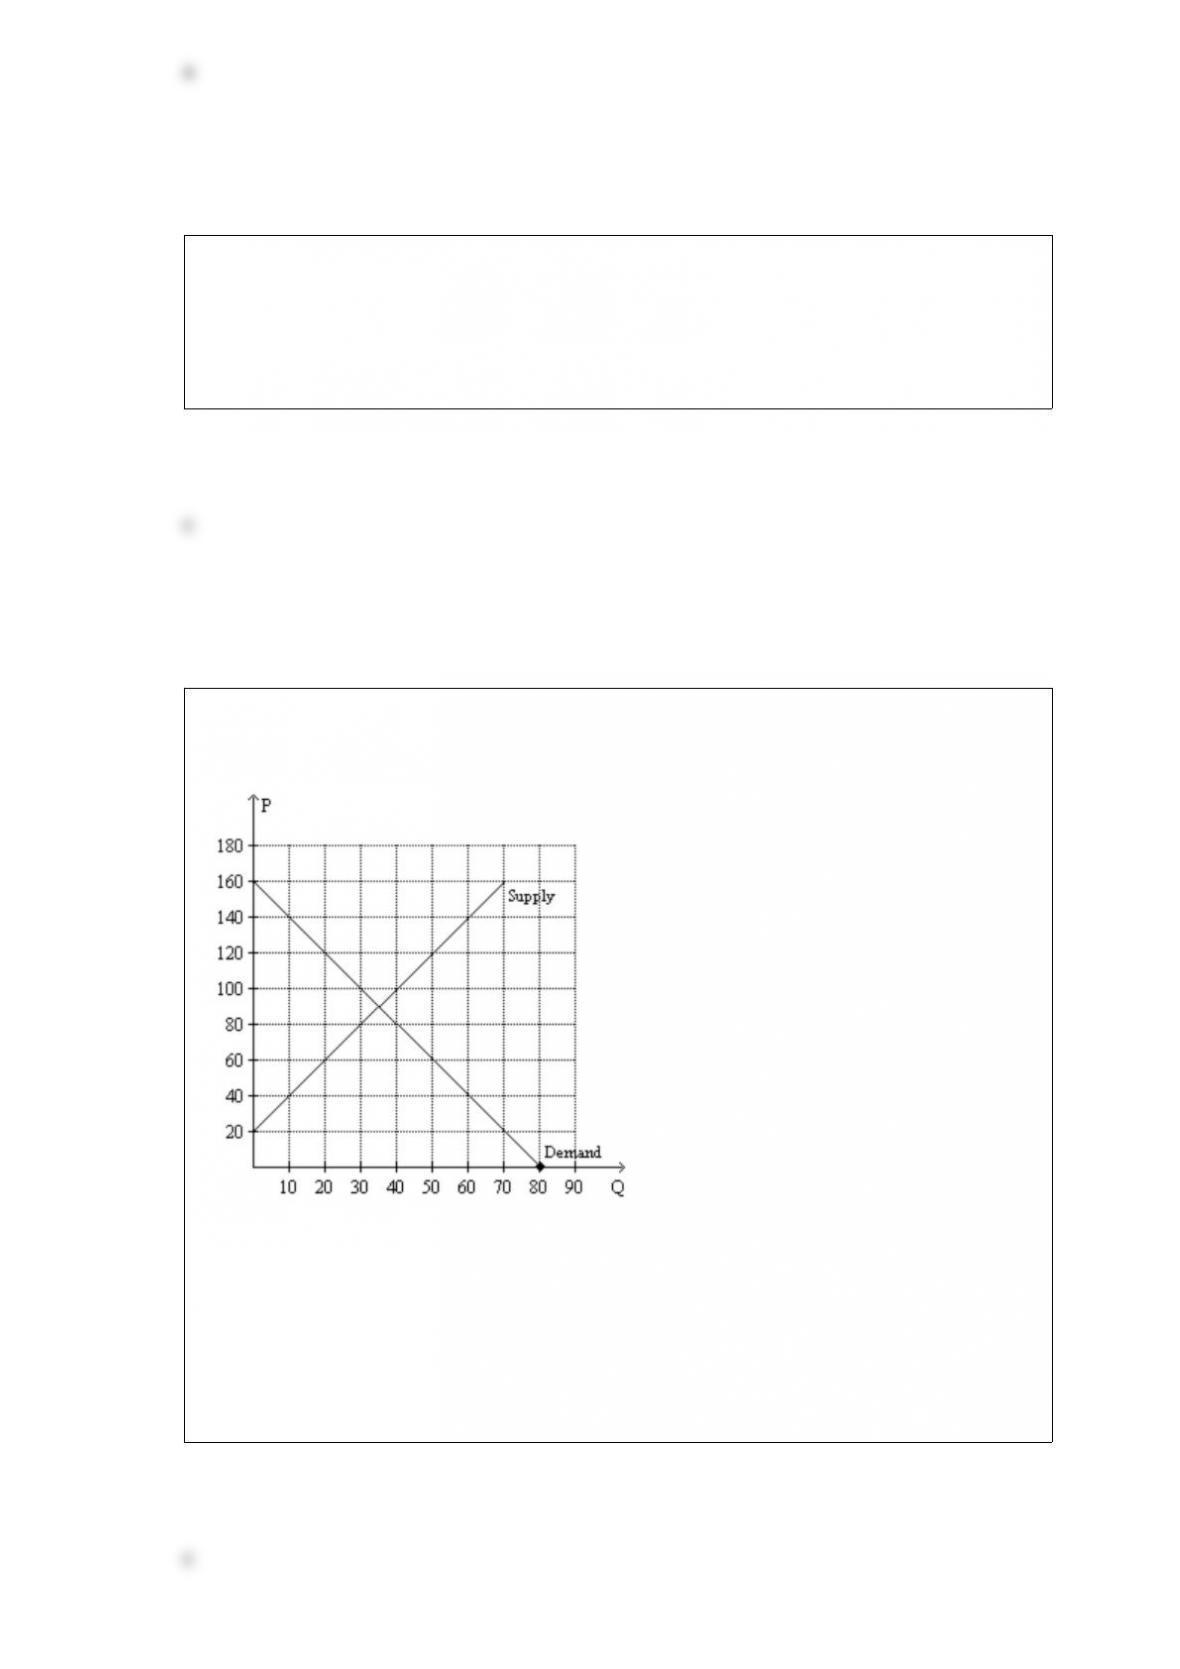
Figure 64
Refer to Figure 64. A governmentimposed price ceiling of $6 in this market results in
a. a shortage of 8 units.
b. a shortage of 4 units.
c. 14 units sold.
d. 10 units sold.
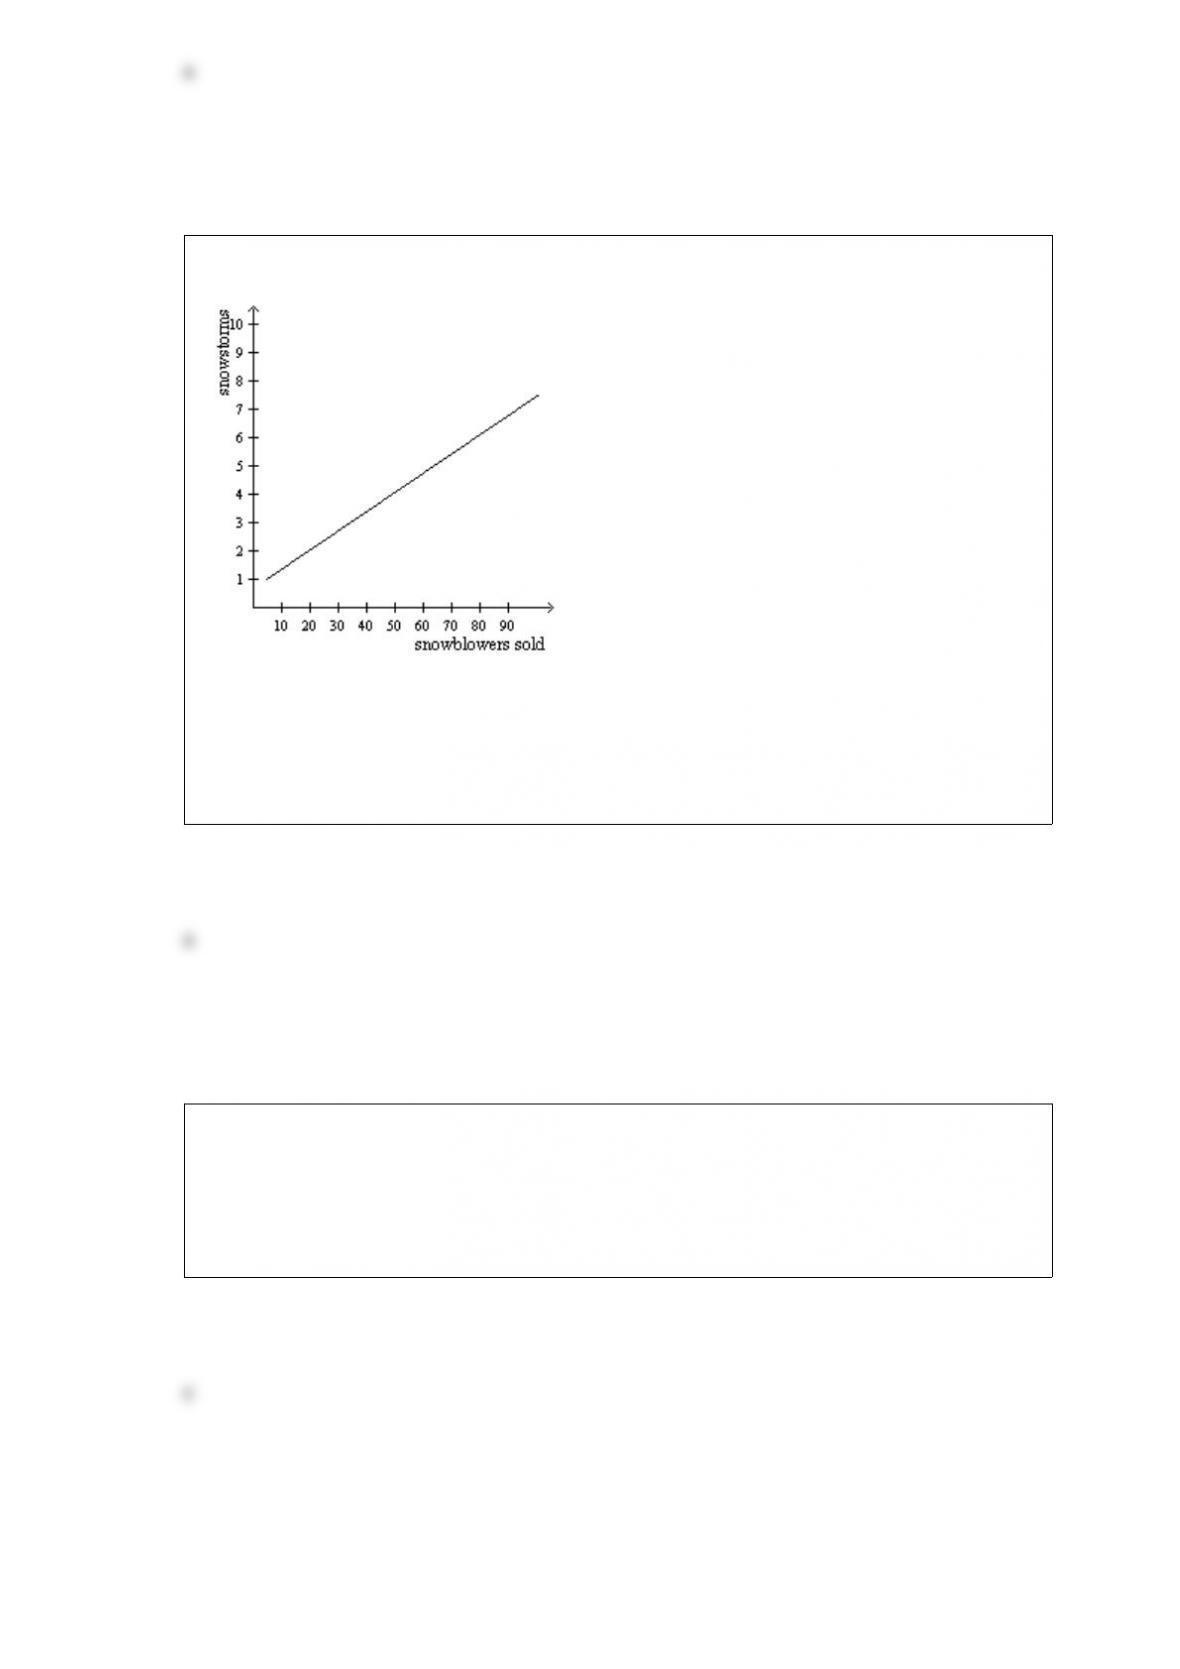
Figure 221
Refer to Figure 221. According to the graph, snowstorms
a. and snowblowers sold are positively correlated.
b. and snowblowers sold are negatively correlated
c. and snowblowers sold are uncorrelated.
d. are caused by more snowblowers being sold.
Economists at the Department of Justice
a. track the behavior of the nation’s money supply.
b. advise Congress on economic matters.
c. help enforce the nation’s antitrust laws.
d. prepare the federal budget.

When two variables have a negative correlation,
a. they tend to move in opposite directions.
b. they tend to move in the same direction.
c. one variable will move while the other remains constant.
d. the variables’ values are never positive.
A tax imposed on the sellers of a good will
a. raise both the price buyers pay and the effective price sellers receive.
b. raise the price buyers pay and lower the effective price sellers receive.
c. lower the price buyers pay and raise the effective price sellers receive.
d. lower both the price buyers pay and the effective price sellers receive.
A species of snakes became extinct due to pollution in a river where the snakes once
lived. This is an example of
a. a market failure caused by an externality.
b. a market failure caused by market power.
c. a market failure caused by equality.
d. There is no market failure in this case.
Table 75
For each of three potential buyers of oranges, the table displays the willingness to pay
for the first three oranges of the day. Assume Allison, Bob, and Charisse are the only
three buyers of oranges, and only three oranges can be supplied per day.

First OrangeSecond OrangeThird Orange
Allison$2.00$1.50$0.75
Bob$1.50$1.00$0.60
Charisse$0.75$0.25$0
Refer to Table 75. Who experiences the largest loss of consumer surplus when the
price of an orange increases from $0.70 to $1.40?
a. Allison
b. Bob
c. Charisse
d. All three individuals experience the same loss of consumer surplus.
A professor spends 10 hours per day giving lectures and writing papers. For the
professor, a graph that shows his various possible mixes of output (lectures given per
day and papers written per day) is called his
a. line of tastes.
b. tradeoff curve.
c. production possibilities frontier.
d. consumption possibilities frontier.
Figure 61
Panel (a)Panel (b)
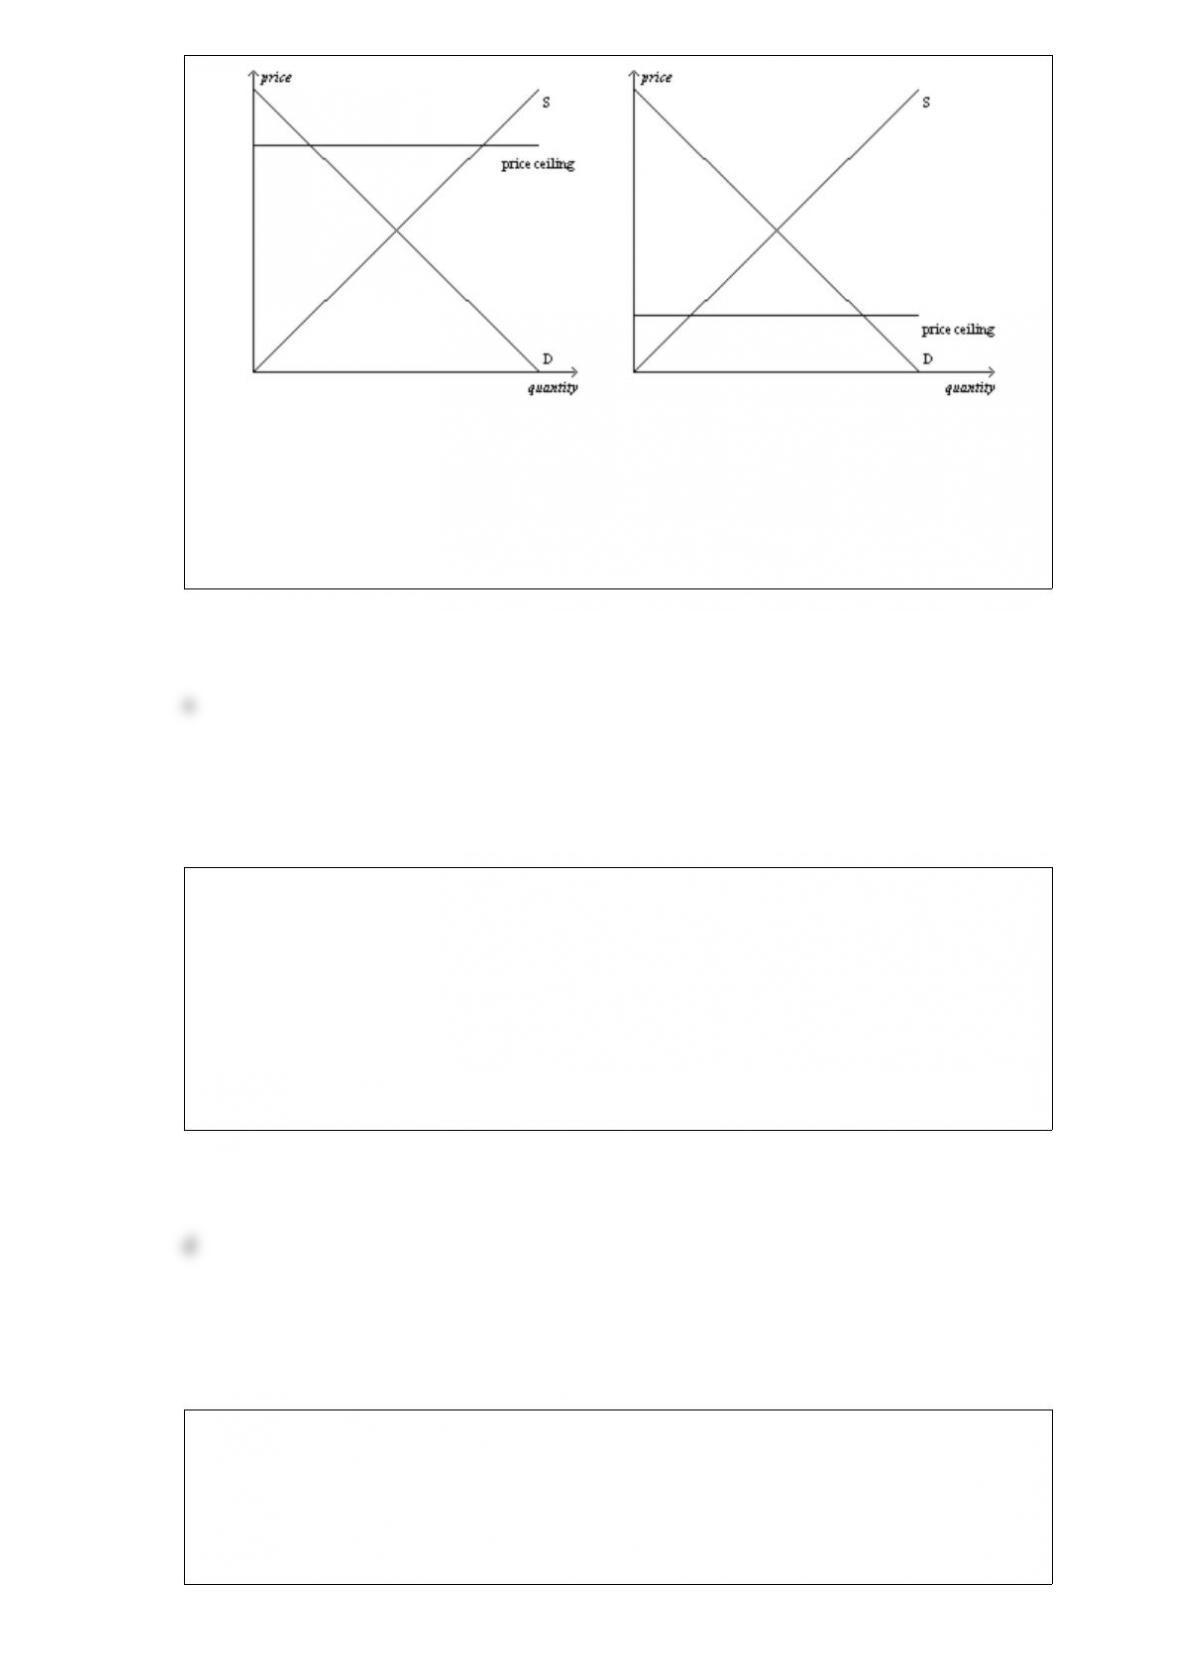
Refer to Figure 61. The price ceiling shown in panel (a)
a. is not binding.
b. creates a surplus.
c. creates a shortage.
d. Both a) and b) are correct.
Which of the following statements is correct?
a. The demand for flatscreen computer monitors is more elastic than the demand for
monitors in general.
b. The demand for grandfather clocks is more elastic than the demand for clocks in
general.
c. The demand for cardboard is more elastic over a long period of time than over a short
period of time.
d. All of the above are correct.
Policymakers use taxes
a. to raise revenue for public purposes but not to influence market outcomes.
b. both to raise revenue for public purposes and to influence market outcomes.
c. when they realize that price controls alone are insufficient to correct market
inequities.
d. only in those markets in which the burden of the tax falls clearly on the sellers.
If the price elasticity of demand for a good is 0.3, then a 20 percent decrease in price
results in a
a. 0.015 percent increase in the quantity demanded.
b. 0.6 percent increase in the quantity demanded.
c. 6 percent increase in the quantity demanded.
d. 66 percent increase in the quantity demanded.
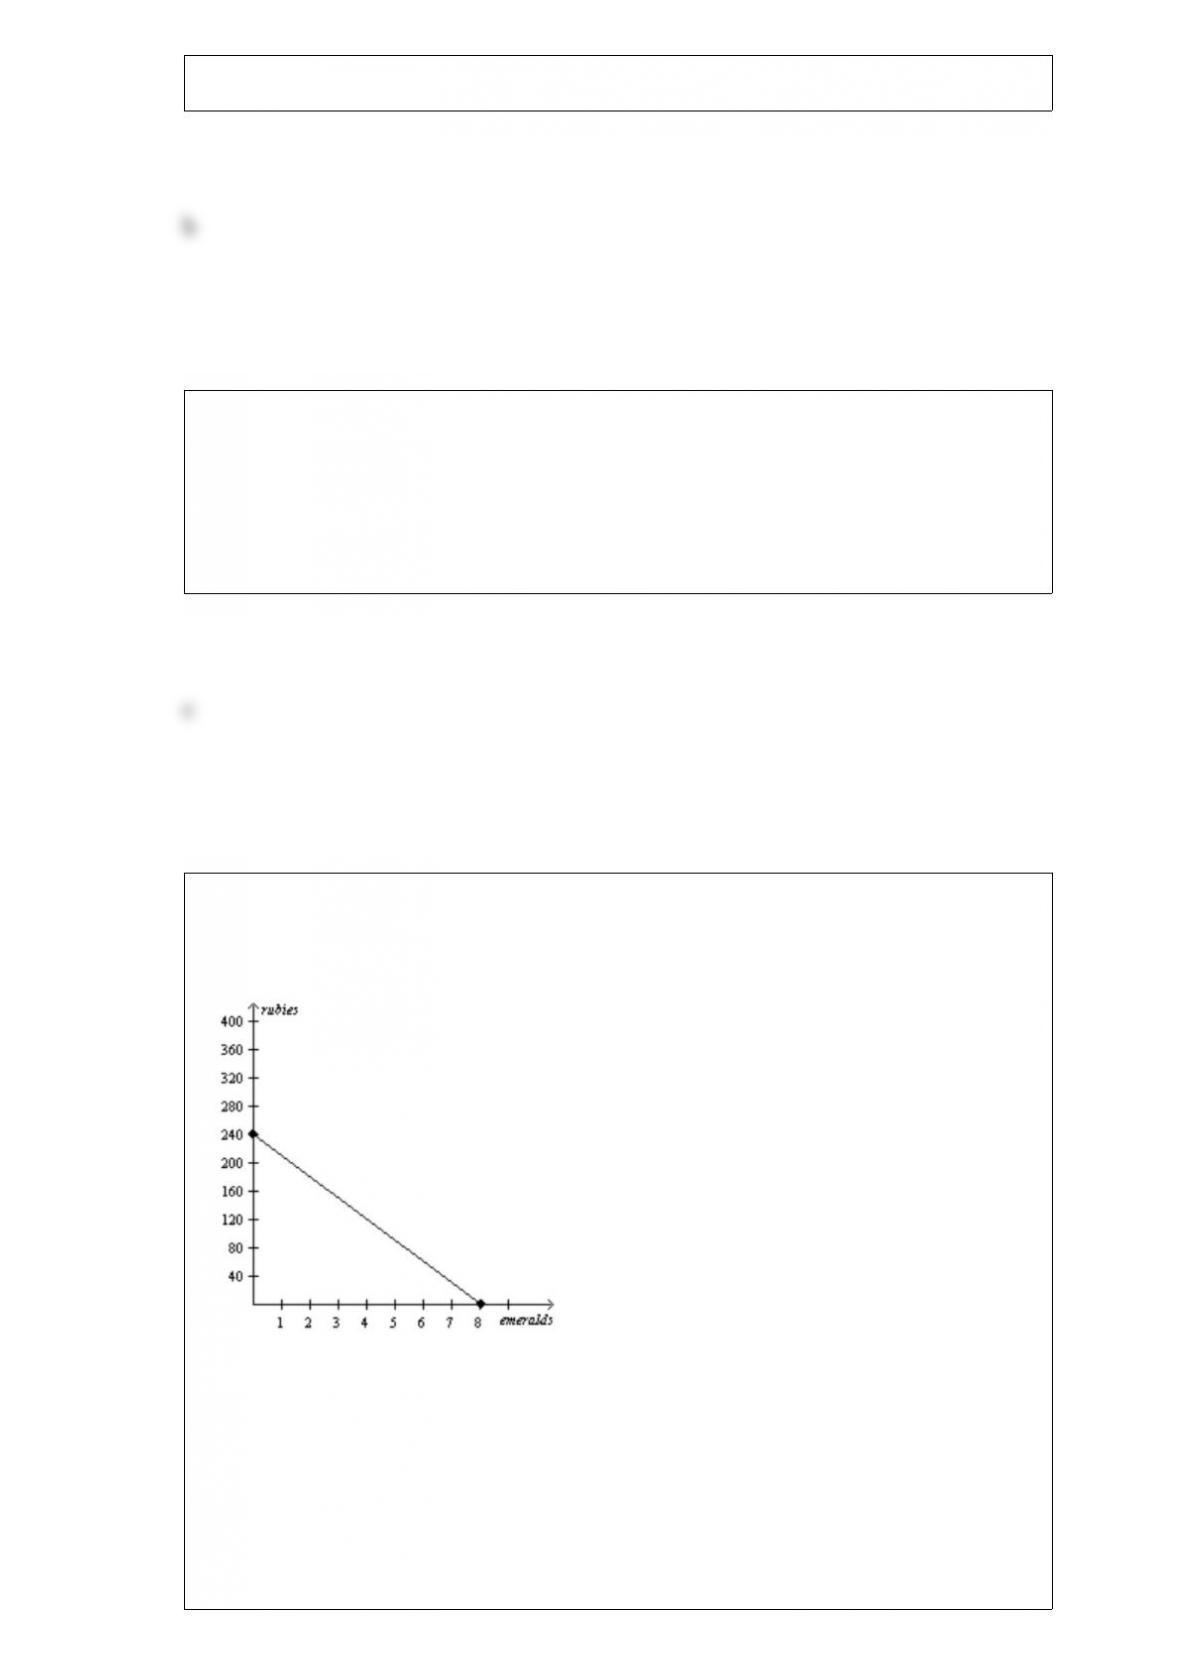
Figure 313
Peru’s Production Possibilities Frontier
Refer to Figure 313. Suppose Madagascar is willing to trade 40 rubies to Peru for each
emerald that Peru produces and sends to Madagascar. Which of the following
combinations of emeralds and rubies could Peru then consume, assuming Peru
specializes in emerald production?
a. 2 emeralds and 240 rubies
b. 3 emeralds and 220 rubies
c. 4 emeralds and 200 rubies
d. 5 emeralds and 140 rubies

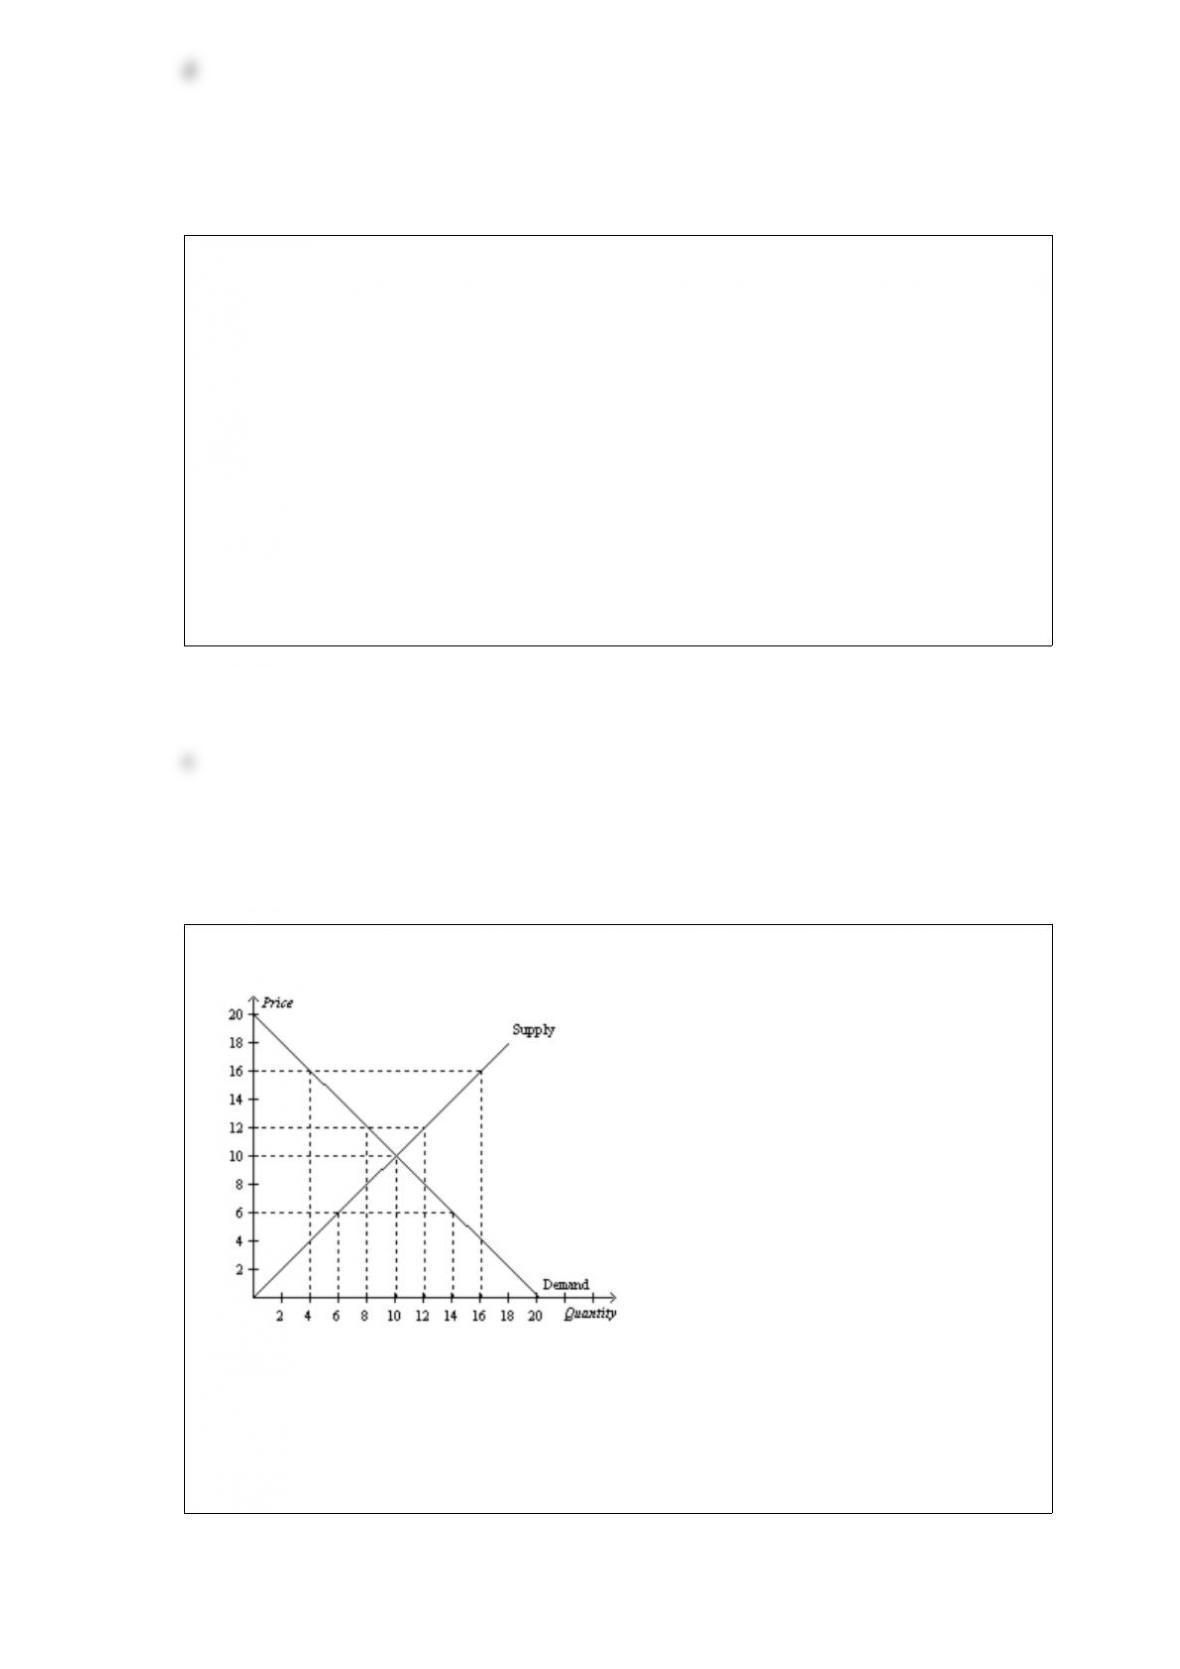
Which of the following is the most likely explanation for the imposition of a price floor
on the market for corn?
a. Policymakers have studied the effects of the price floor carefully, and they recognize
that the price floor is advantageous for society as a whole.
b. Buyers and sellers of corn have agreed that the price floor is good for both of them
and have therefore pressured policy makers into imposing the price floor.
c. Buyers of corn, recognizing that the price floor is good for them, have pressured
policymakers into imposing the price floor.
d. Sellers of corn, recognizing that the price floor is good for them, have pressured
policymakers into imposing the price floor.
Table 324
Assume that England and Spain can switch between producing cheese and producing
bread at a constant rate.
Labor Hours Needed to Make 1 Unit ofNumber of Units Produced in 40 Hours
CheeseBreadCheeseBread
England 144010
Spain 48105
Refer to Table 324. At which of the following prices would both England and Spain
gain from trade with each other?
a. 16 units of bread for 16 units of cheese
b. 16 units of bread for 24 units of cheese
c. 16 units of bread for 48 units of cheese
d. England and Spain could not both gain from trade with each other at any price.
