Saddle shoes are not popular right now, so very few are being produced. If saddle shoes
become popular, then how will this affect the market for saddle shoes?
a. The supply curve for saddle shoes will shift right, which will create a shortage at the
current price. Price will increase, which will decrease quantity demanded and increase
quantity supplied. The new market equilibrium will be at a higher price and higher
quantity.
b. The supply curve for saddle shoes will shift right, which will create a surplus at the
current price. Price will decrease, which will increase quantity demanded and decrease
quantity supplied. The new market equilibrium will be at a lower price and higher
quantity.
c. The demand curve for saddle shoes will shift right, which will create a shortage at the
current price. Price will increase, which will decrease quantity demanded and increase
quantity supplied. The new market equilibrium will be at a higher price and higher
quantity.
d. The demand curve for saddle shoes will shift right, which will create a surplus at the
current price. Price will decrease, which will increase quantity demanded and decrease
quantity supplied. The new market equilibrium will be at a lower price and higher
quantity.
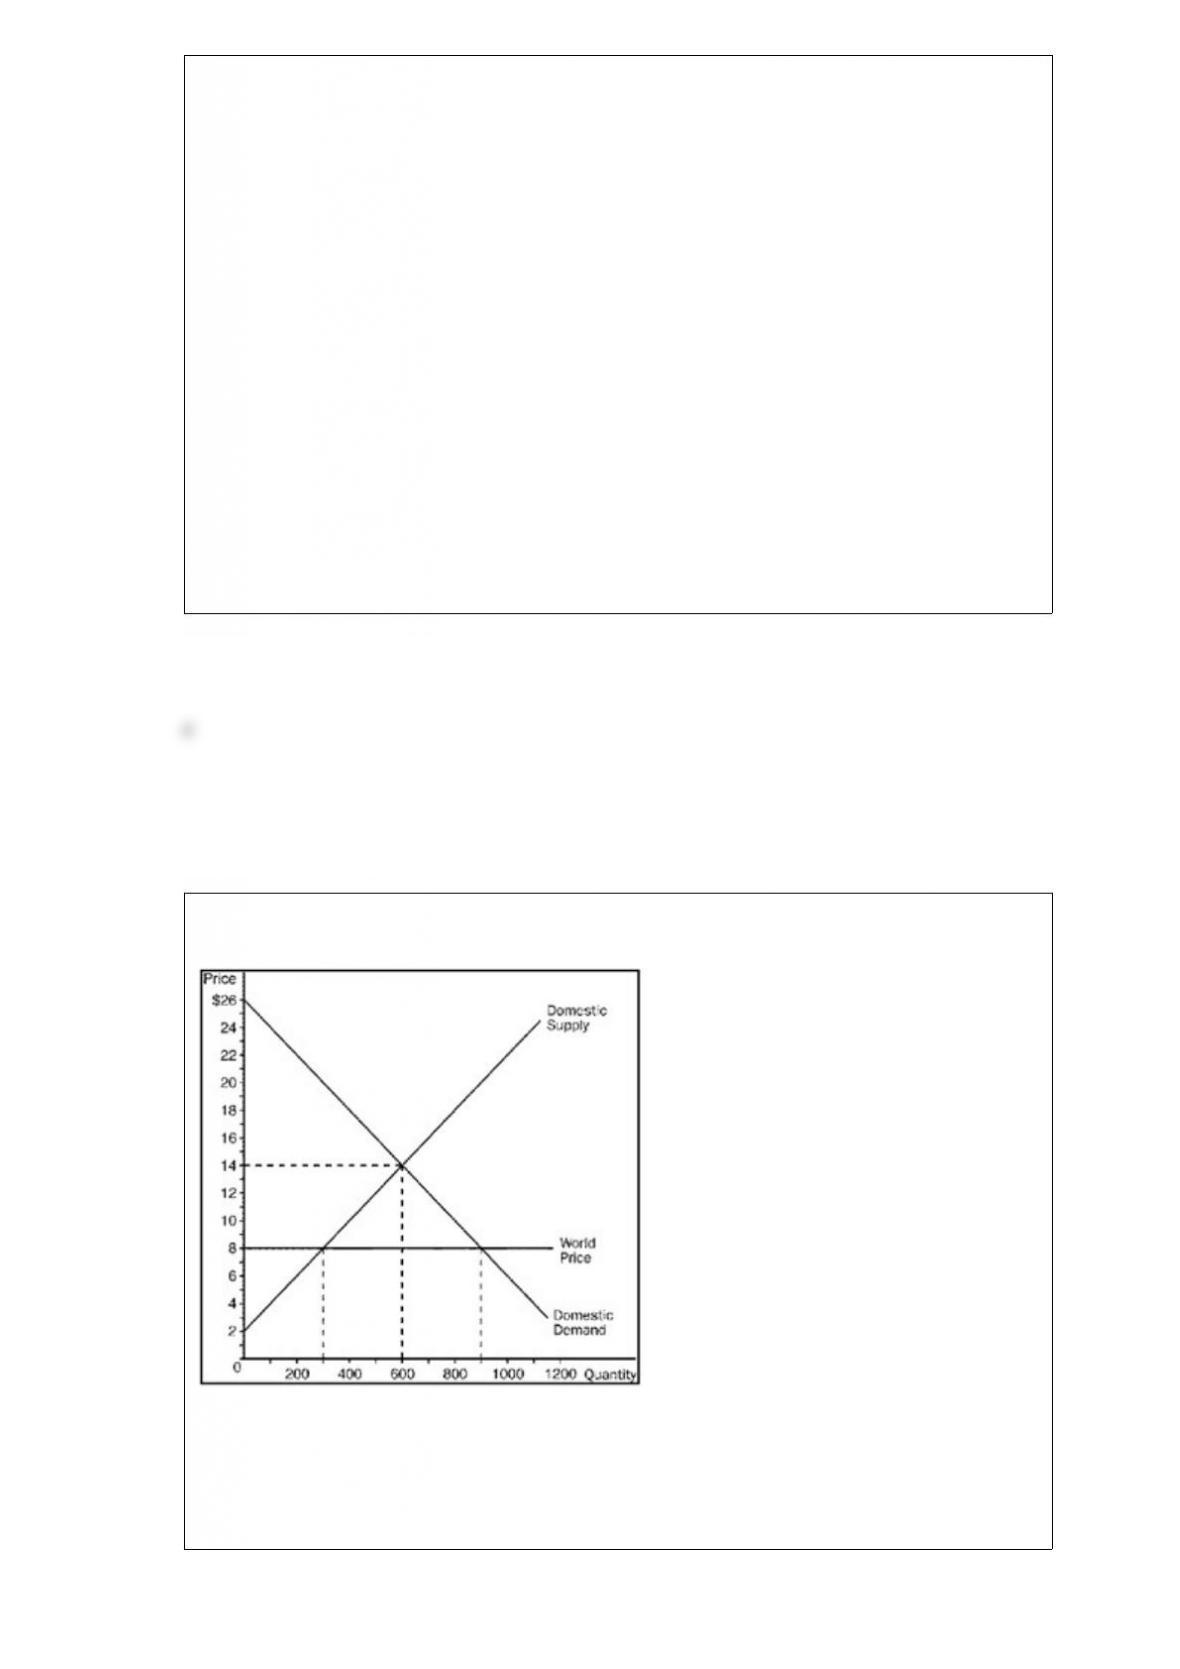
Figure 913
Refer to Figure 913. With trade, the country
a. exports 200 units of the good.
b. exports 400 units of the good.
c. imports 400 units of the good.
d. imports 600 units of the good.
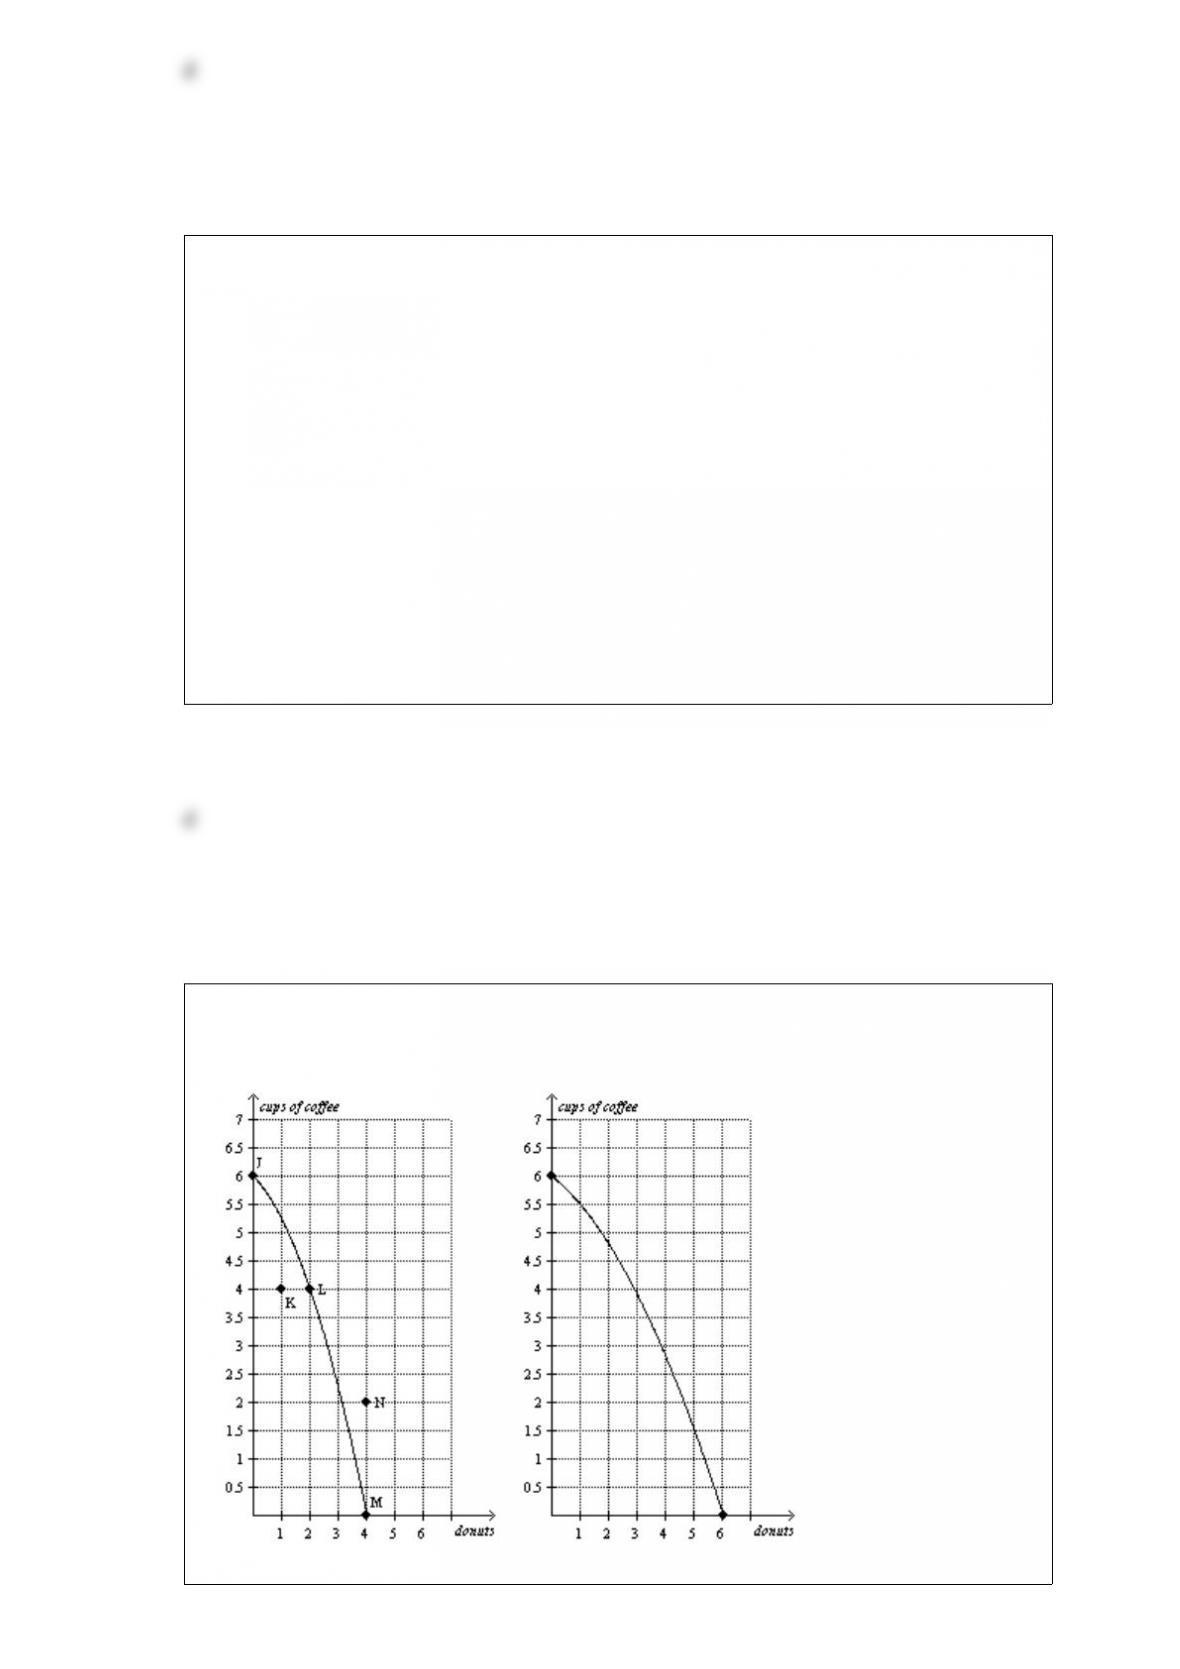
Table 322
Assume that Zimbabwe and Portugal can switch between producing toothbrushes and
producing hairbrushes at a constant rate.
Machine Minutes
Needed to Make 1
ToothbrushHairbrush
Zimbabwe310
Portugal56
Refer to Table 322. Zimbabwe’s opportunity cost of one hairbrush is
a. 3/10 toothbrush and Portugal’s opportunity cost of one hairbrush is 5/6 toothbrush.
b. 3/10 toothbrush and Portugal’s opportunity cost of one hairbrush is 6/5 toothbrushes.
c. 10/3 toothbrushes and Portugal’s opportunity cost of one hairbrush is 5/6 toothbrush.
d. 10/3 toothbrushes and Portugal’s opportunity cost of one hairbrush is 6/5
toothbrushes.
Figure 29
Panel (a) Panel (b)
Refer to Figure 29, Panel (a). The opportunity cost of moving from point M to point L
is
a. 2 donuts.
b. 2 donuts and 4 cups of coffee.
c. 4 donuts.
d. 4 cups of coffee.
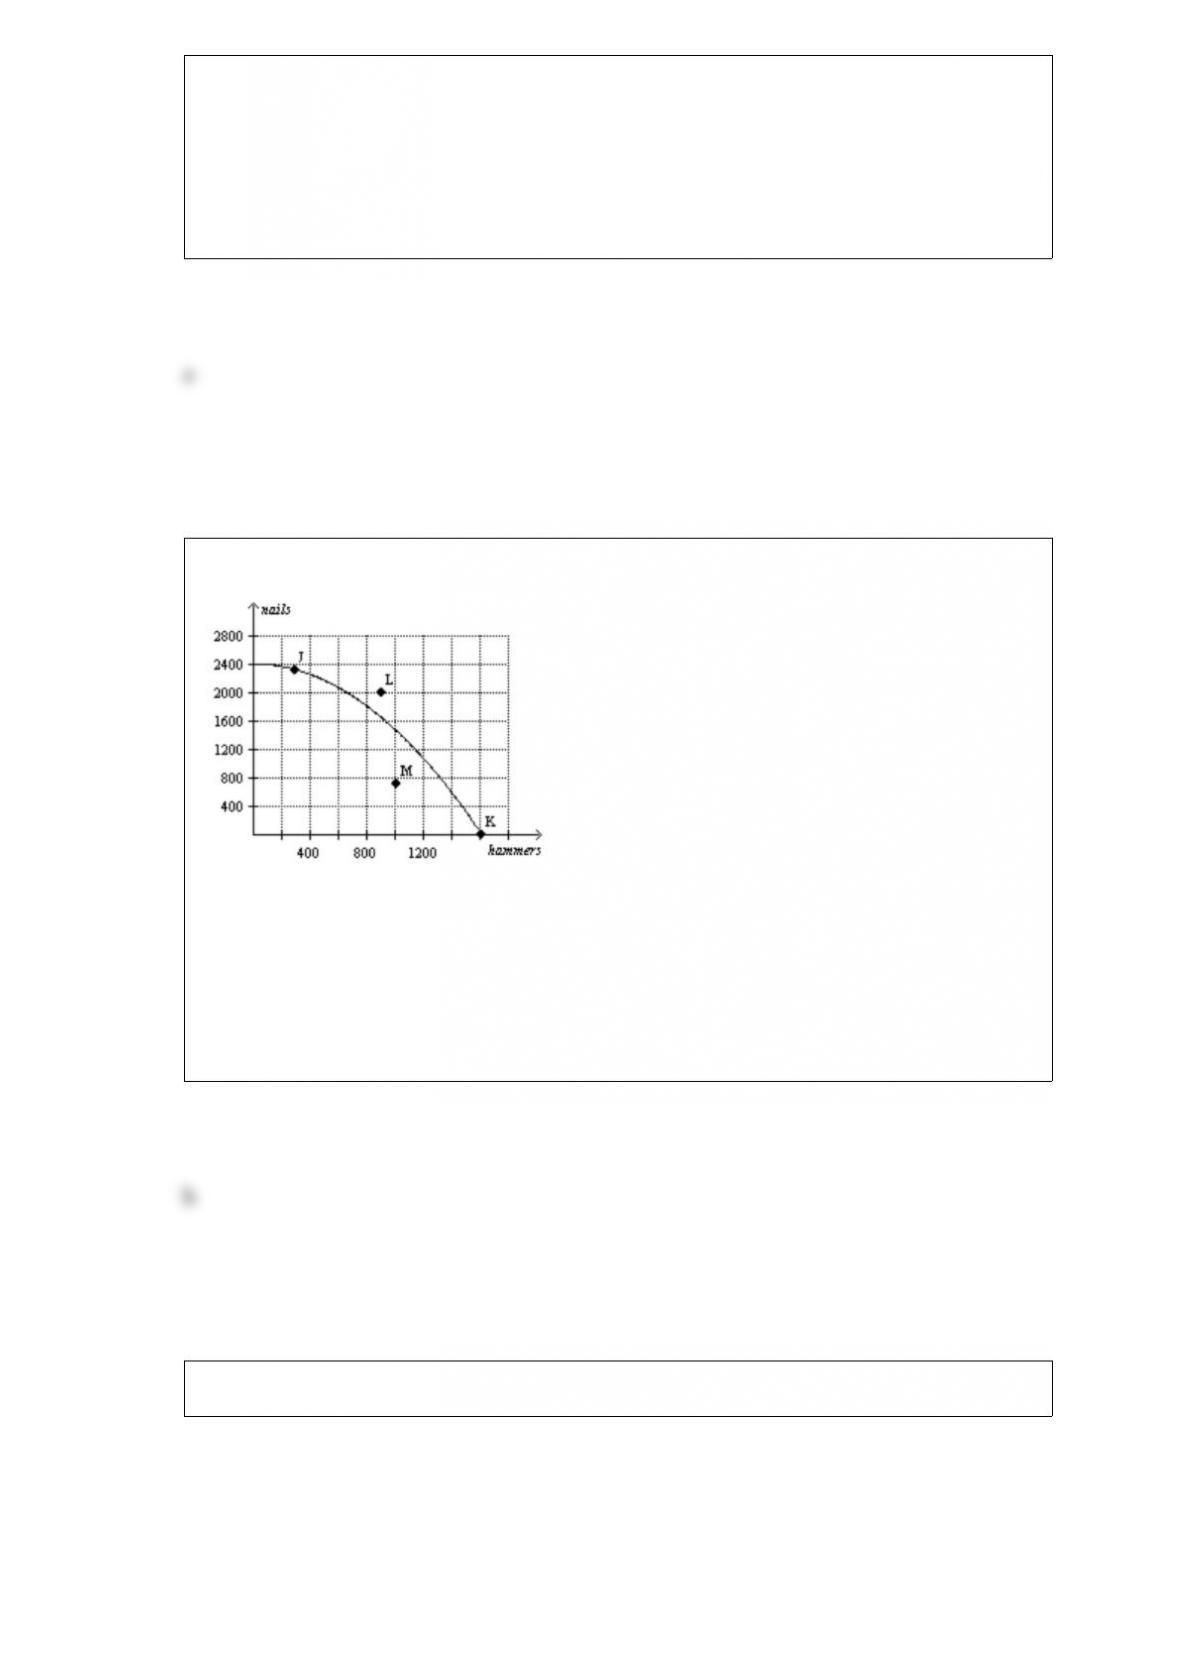
Figure 28
Refer to Figure 28. For this economy, as more and more hammers are produced, the
opportunity cost of an additional hammer produced, in terms of nails,
a. remains constant.
b. increases.
c. decreases.
d. This answer cannot be determined from the graph.
Figure 99
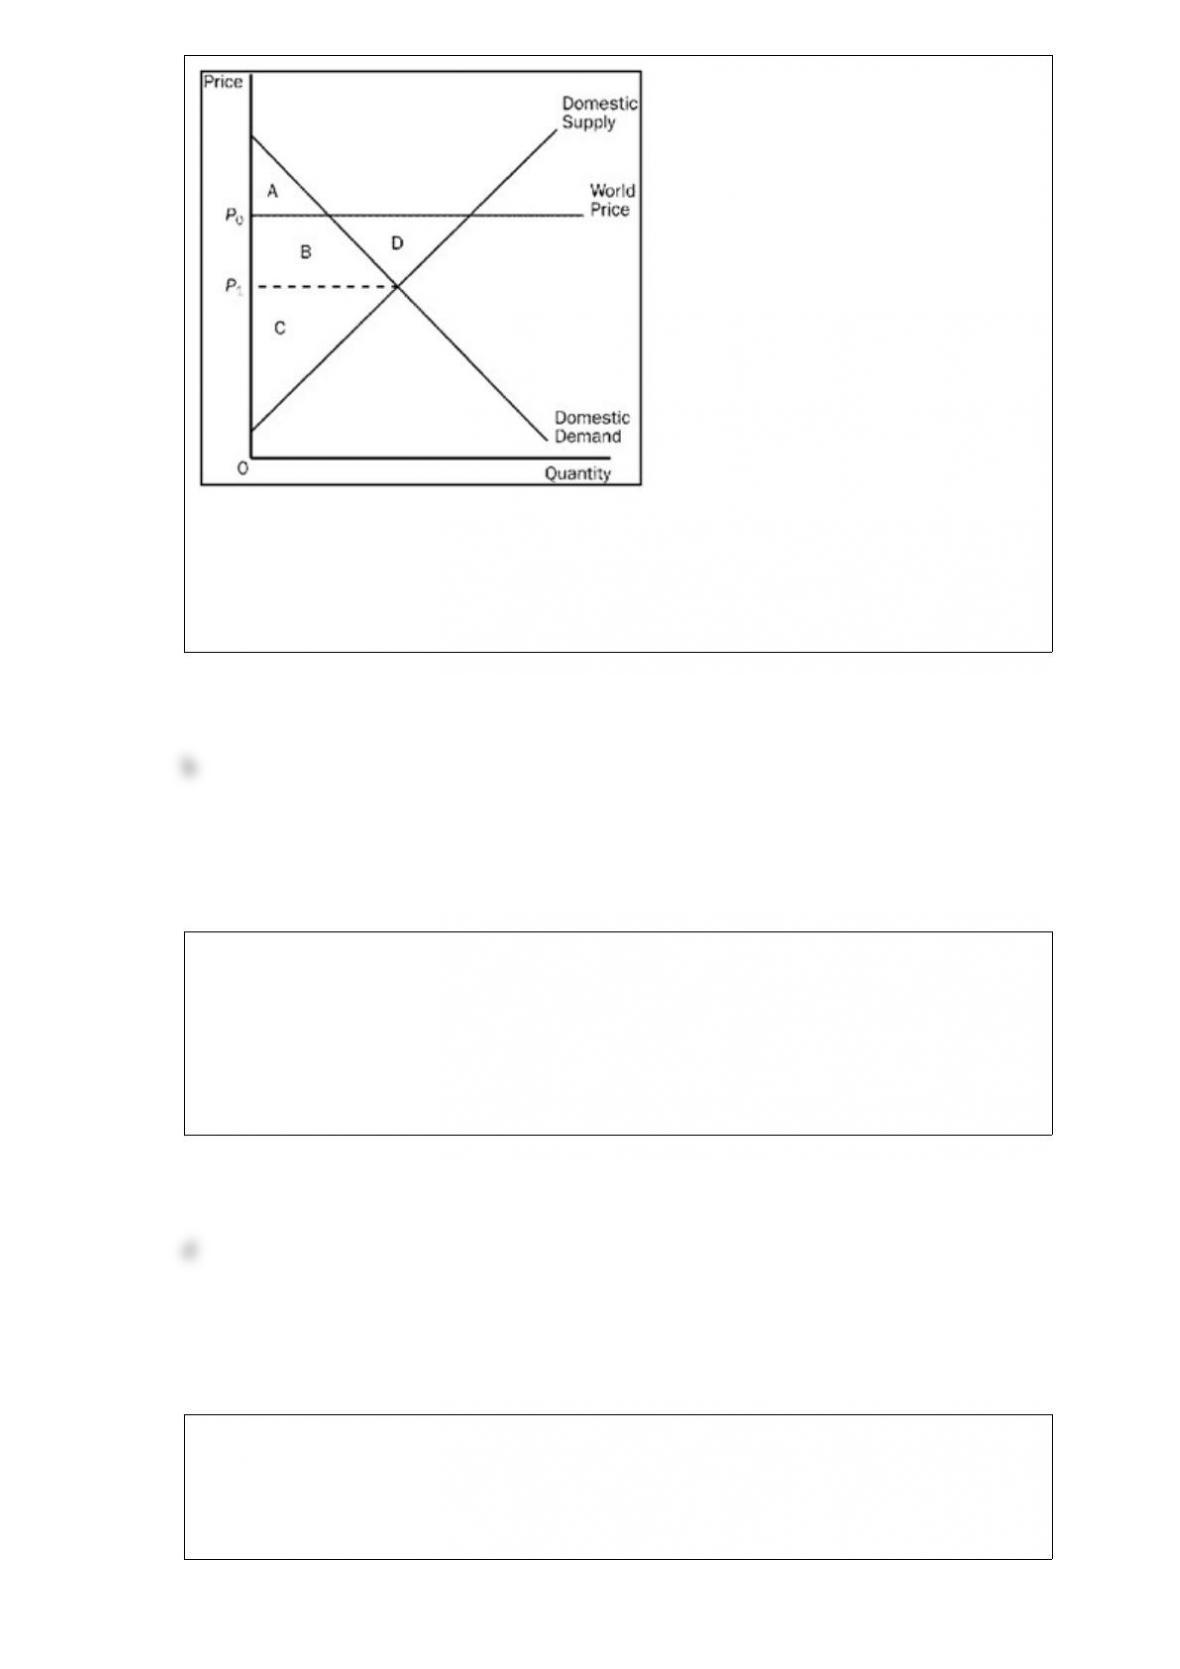
Refer to Figure 99. Total surplus in this market before trade is
a. A + B.
b. A + B + C.
c. A + B + C + D.
d. B + C + D.
Which of the following statements does not apply to a market economy?
a. Firms decide whom to hire and what to produce.
b. The “invisible hand” usually maximizes the income of society as a whole.
c. Households decide which firms to work for and what to buy with their incomes.
d. Government policies are the primary forces that guide the decisions of firms and
households.
Figure 310
Alice and Betty’s Production Possibilities in one 8hour day.
Alice’s Production Possibilities FrontierBetty’s Production Possibilities Frontier
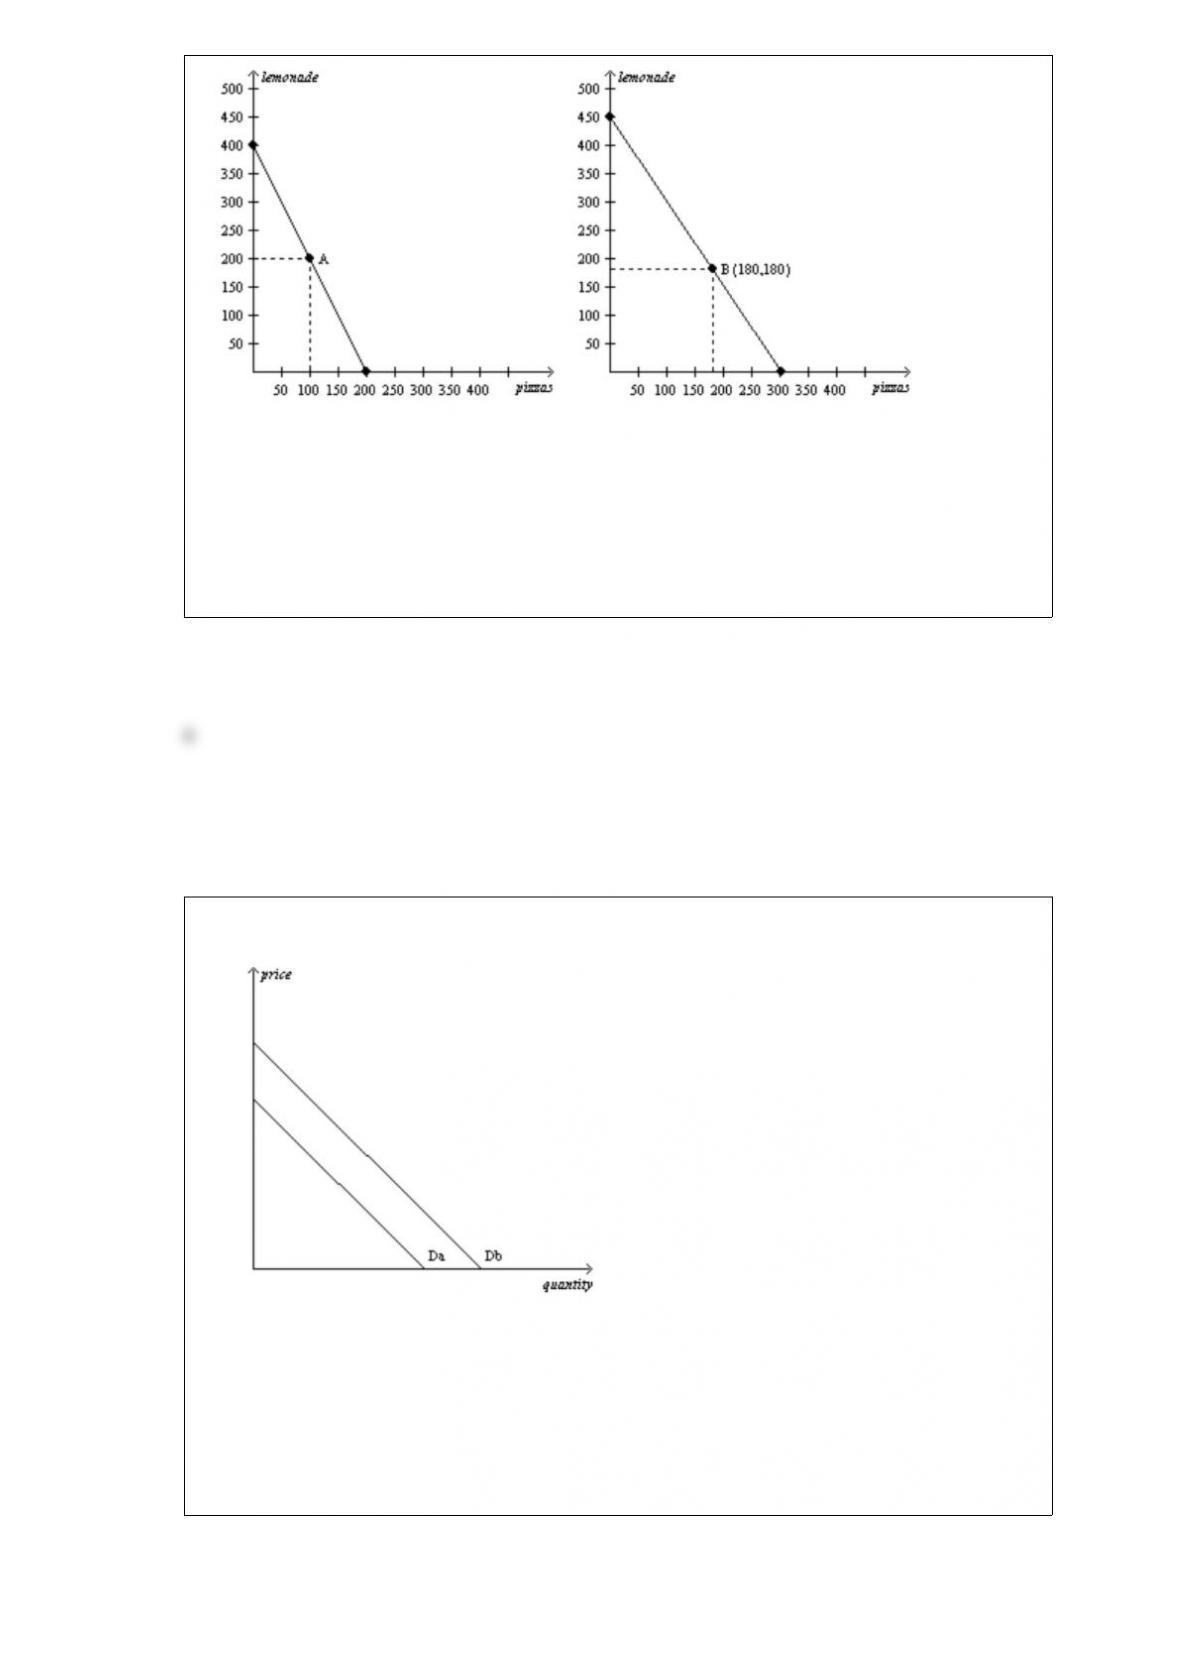
Refer to Figure 310. Both Alice and Betty
a. face a constant tradeoff between producing pitchers of lemonade and pizzas.
b. can produce more pizzas than pitchers of lemonade if they devote all of their time to
pizza production.
c. would benefit from specializing in lemonade production.
d. would benefit from specializing in pizza production.
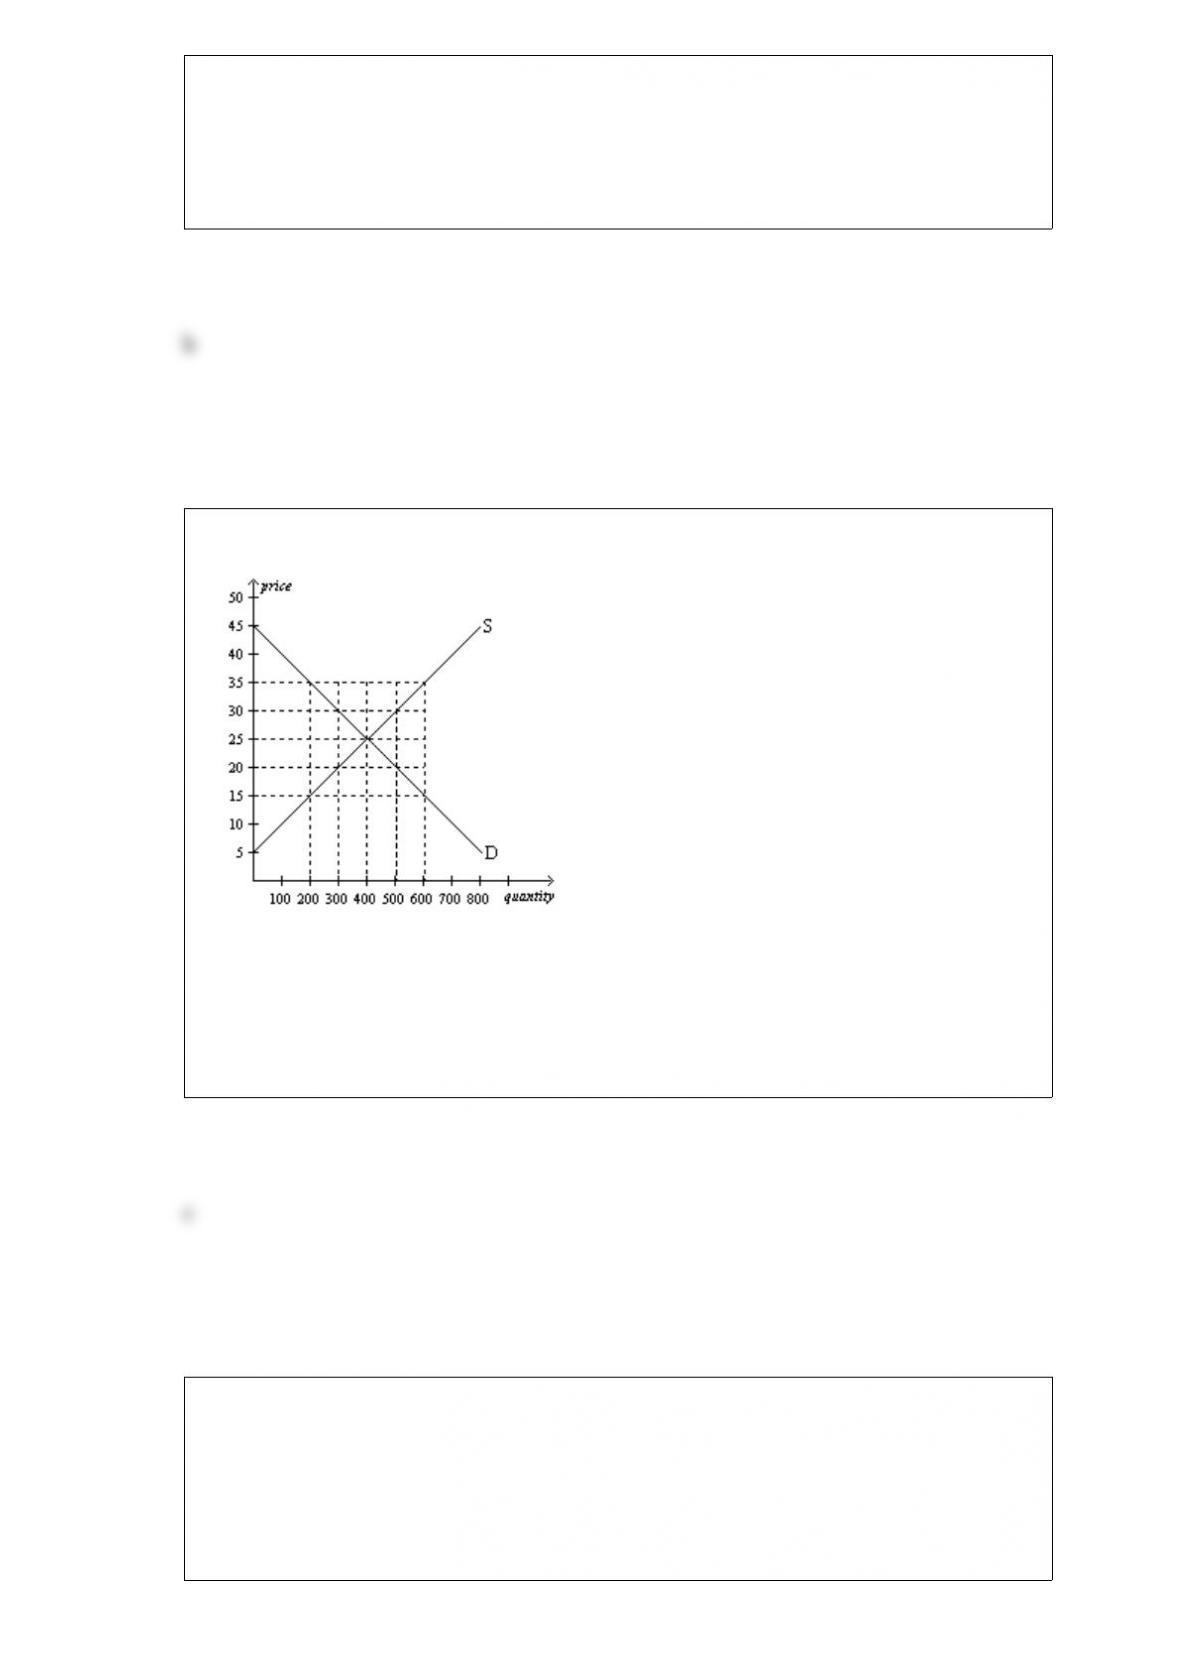
Figure 47
Refer to Figure 47. The movement from Da to Db in the market for potato chips could
be caused by a(n)
a. decrease in the price of potato chips.
b. decrease in income, assuming that potato chips are a normal good.
c. announcement by the FDA that potato chips cause cancer.
d. increase in the price of a pretzels.

Another term for equilibrium price is
a. dynamic price.
b. marketclearing price.
c. quantitydefining price.
d. balance price.
A legal minimum on the price at which a good can be sold is called a
a. price subsidy.
b. price floor.
c. tax.
d. price ceiling.
Public policies
a. may be able to improve either economic efficiency or equality.
b. may be able to improve economic efficiency but cannot improve equality.
c. may be able to improve equality but cannot improve economic efficiency.
d. cannot improve either equality or economic efficiency.
A statement describing how the world is
a. is a normative statement.
b. is a positive statement.
c. would only be made by an economist speaking as a policy adviser.
d. would only be made by an economist employed by the government.
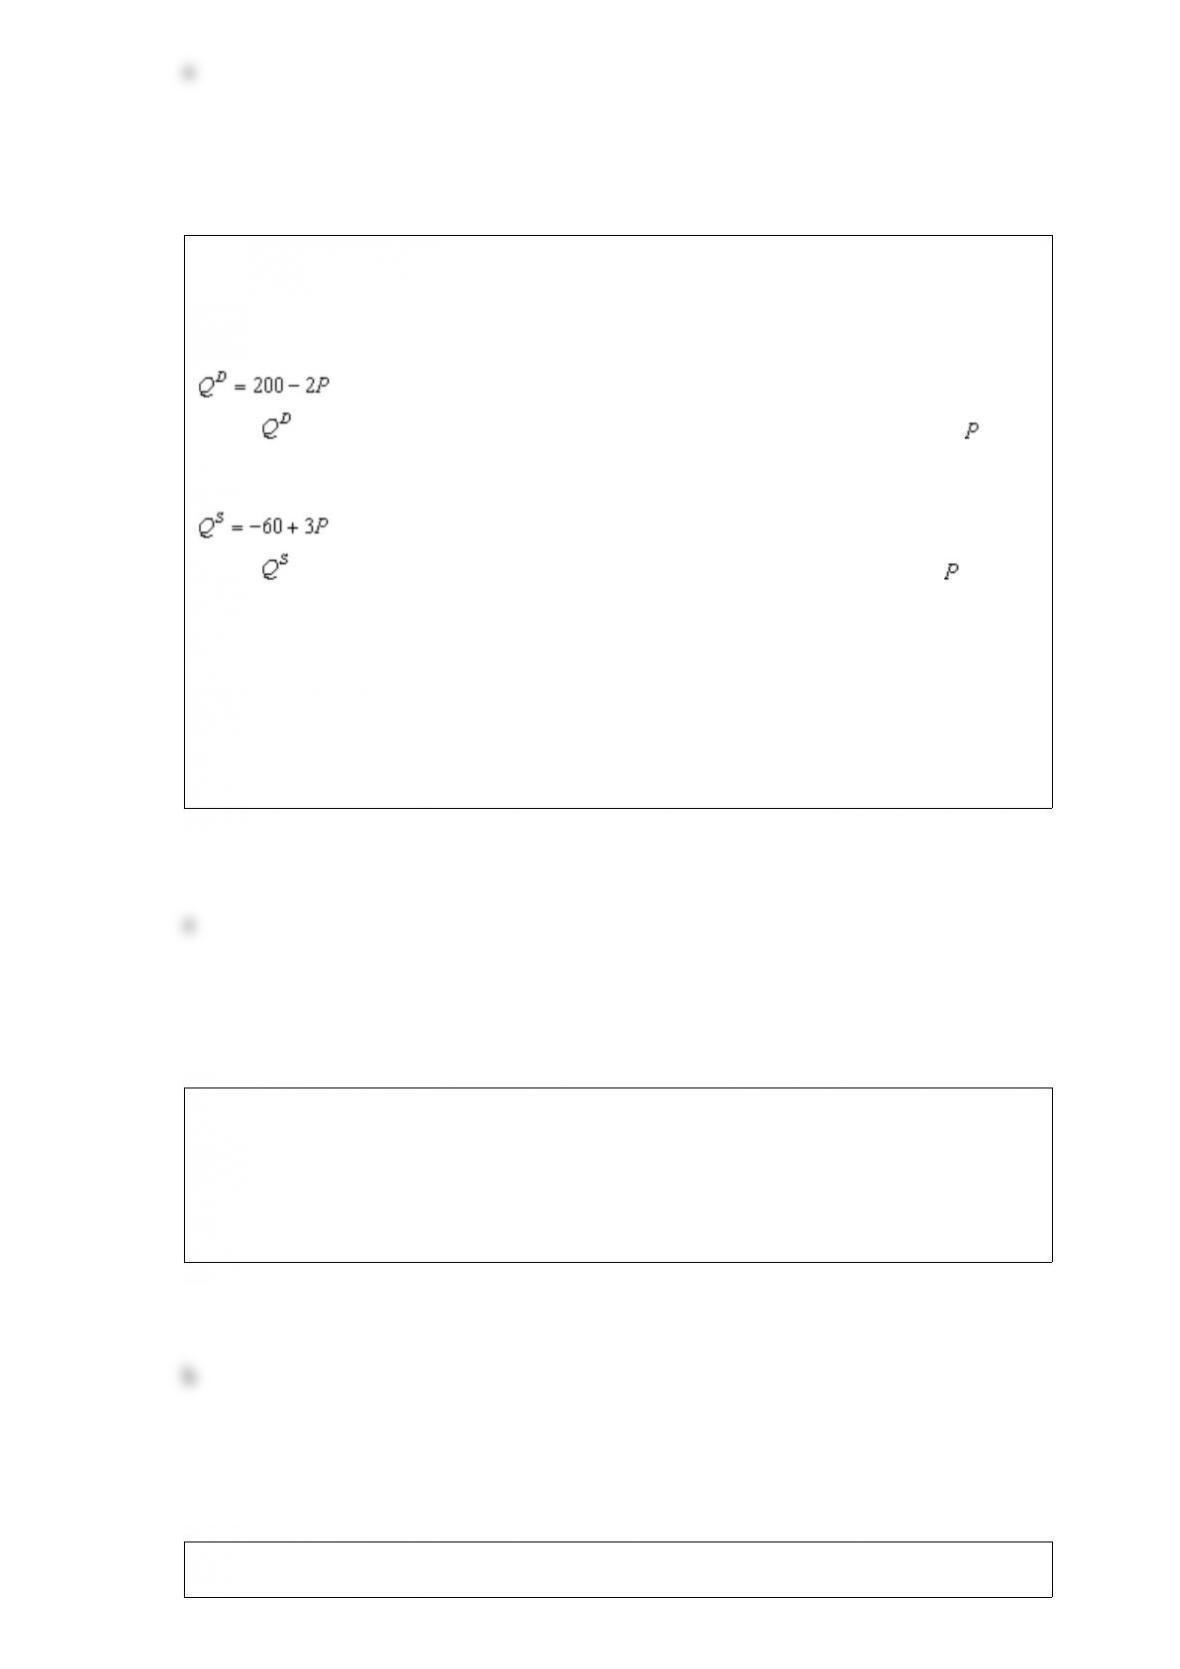
Figure 418
Refer to Figure 418. At a price of $15, there would be a
a. surplus of 400 units.
b. shortage of 200 units.
c. shortage of 400 units.
d. shortage of 600 units.
In the circularflow diagram, which of the following items represents a payment for a
factor of production?
a. interest
b. capital
c. spending by households on goods
d. spending by households on services

Suppose a tax of $3 per unit is imposed on a good. The supply curve is a typical
upwardsloping straight line, and the demand curve is a typical downwardsloping
straight line. The tax decreases consumer surplus by $3,900 and decreases producer
surplus by $3,000. The tax generates tax revenue of $6,000. The tax decreased the
equilibrium quantity of the good from
a. 2,000 to 1,500.
b. 2,400 to 2,000.
c. 2,600 to 2,000.
d. 3,000 to 2,400.
When computing the opportunity cost of attending a basketball game you should
include
a. the price you pay for the ticket and the value of your time.
b. the price you pay for the ticket, but not the value of your time.
c. the value of your time, but not the price you pay for the ticket.
d. neither the price of the ticket nor the value of your time.
In the ordered pair (3, 6), 3 is the
a. xcoordinate.
b. ycoordinate.
c. origin.
d. slope.
Scenario 92
• For a small country called Boxland, the equation of the domestic demand curve for
cardboard is
,
where represents the domestic quantity of cardboard demanded, in tons, and
represents the price of a ton of cardboard.
• For Boxland, the equation of the domestic supply curve for cardboard is
,
where represents the domestic quantity of cardboard supplied, in tons, and again
represents the price of a ton of cardboard.
Refer to Scenario 92. Suppose the world price of cardboard is $45 and international
trade is allowed. Then Boxland’s consumers demand
a. 110 tons of cardboard and Boxland’s producers supply 75 tons of cardboard.
b. 110 tons of cardboard and Boxland’s producers supply 96 tons of cardboard.
c. 96 tons of cardboard and Boxland’s producers supply 75 tons of cardboard.
d. 96 tons of cardboard and Boxland’s producers supply 96 tons of cardboard.
Specialization and trade are closely linked to
a. absolute advantage.
b. comparative advantage.
c. gains to some traders that exactly offset losses to other traders.
d. shrinkage of the economic pie.
If the price elasticity of supply for a window manufacturer is 1.5,

a. a 10% increase in the price of windows results in a 15% increase in the quantity of
windows supplied.
b. supply is considered to be inelastic.
c. the manufacturer is likely operating very near capacity.
d. All of the above are correct.
HTMLENTITY#8203HTMLENTITY Table 338
Output produced in one growing season
CornSoybeans
Iowa 3045
Nebraska 4080
Refer to Table 338. Iowa and Nebraska can both produce corn and soybeans, and can
switch between the production of corn and soybeans at a constant rate. The table
illustrates the amount of corn or soybeans each state can produce in one growing
season. From this table, we know that Nebraska has an absolute advantage in the
production of
a. HTMLENTITY#8203HTMLENTITYcorn and a comparative advantage in the
production of soybean.
b. HTMLENTITY#8203HTMLENTITYboth goods and a comparative advantage in the
production of soybeans.
c. HTMLENTITY#8203HTMLENTITYcorn and a comparative advantage in the
production of corn.
d. HTMLENTITY#8203HTMLENTITYboth goods and a comparative advantage in the
production of corn.
The price elasticity of demand measures
a. buyers’ responsiveness to a change in the price of a good.
b. the extent to which demand increases as additional buyers enter the market.
c. how much more of a good consumers will demand when incomes rise.
d. the movement along a supply curve when there is a change in demand.

When we move along a given demand curve,
a. only price is held constant.
b. income and price are held constant.
c. all nonprice determinants of demand are held constant.
d. all determinants of quantity demanded are held constant.
The price of diamonds is high, in part because the majority of the world’s diamonds are
controlled by a single firm. This is an example of
a. a market failure caused by an externality.
b. a market failure caused by market power.
c. a market failure caused by equality.
d. There is no market failure in this case.
Figure 32
Brazil’s Production Possibilities Frontier

Refer to Figure 32. If the production possibilities frontier shown is for two months of
production, then which of the following combinations of peanuts and cashews could
Brazil not produce in two months?
a. 5 peanuts and 88 cashews
b. 4 peanuts and 115 cashews
c. 3 peanuts and 155 cashews
d. 1 peanuts and 200 cashews
When a society cannot produce all the goods and services people wish to have, the
economy is experiencing
a. scarcity.
b. surpluses.
c. inefficiencies.
d. inequalities.
Table 321
Assume that Jamaica and Norway can switch between producing coolers and producing
radios at a constant rate. The following table shows the number of coolers or number of
radios each country can produce in one day.

Output Produced in One Day
CoolersRadios
Jamaica126
Norway243
Refer to Table 321. Jamaica and Norway would not be able to gain from trade if
Norway’s opportunity cost of one radio changed to
a. 0 coolers.
b. 1 cooler.
c. 2 coolers.
d. Jamaica and Norway can always gain from trade regardless of their opportunity
costs.
Table 43
PriceBert’s
Quantity
DemandedErnie’s
Quantity
DemandedGrover’s
Quantity
DemandedOscar’s
Quantity
Demanded
$0.00201648
$0.50181266
$1.00141025
$1.5012804
$2.006602
$2.500400
Refer to Table 43. If these are the only four buyers in the market, then when the price
increases from $1.00 to $1.50, the market quantity demanded
a. decreases by 1.75 units.
b. increases by 2 units.
c. decreases by 7 units.
d. decreases by 24 units.
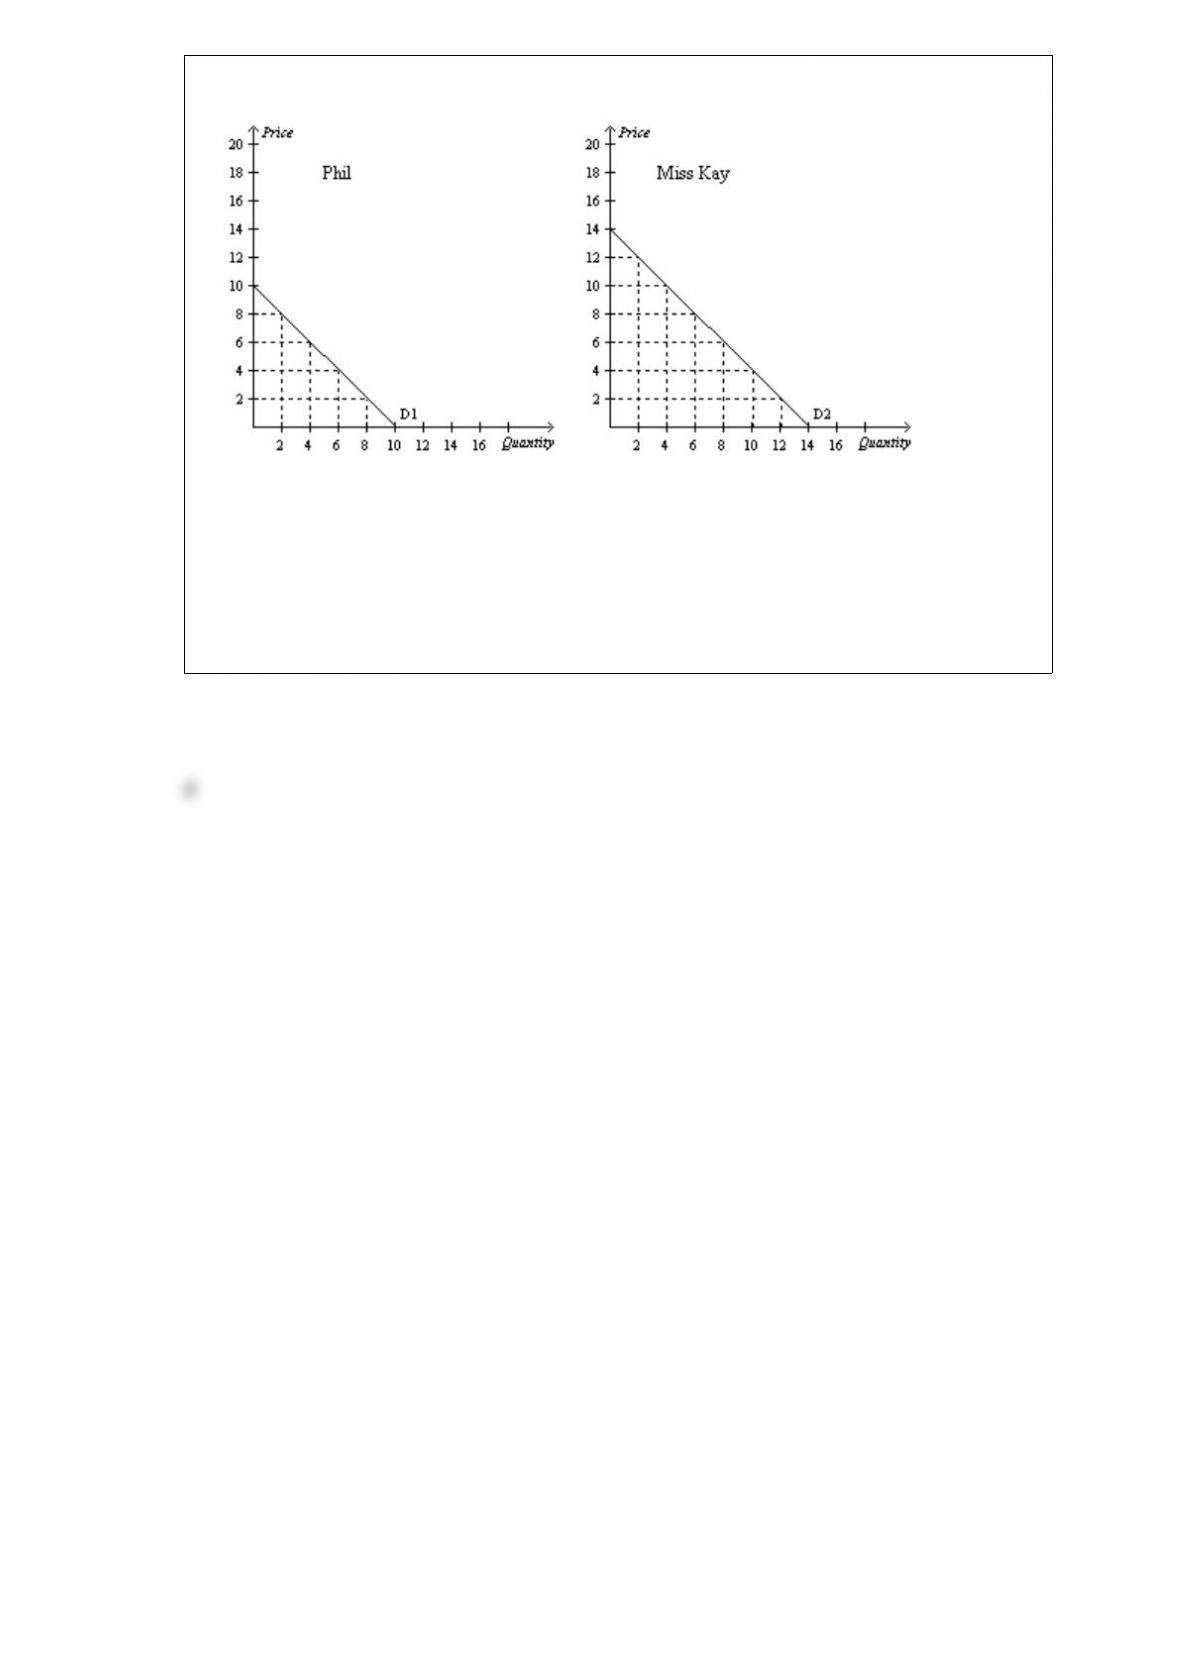
Figure 42
Refer to Figure 42. Suppose Phil and Miss Kay are the only consumers in the market.
If the price is $6, then the market quantity demanded is
a. 4 units.
b. 6 units.
c. 8 units.
d. 12 units.