When the United States trades with China,
a. both countries will likely benefit.
b. only United States will benefit.
c. only China will benefit.
d. neither country will benefit.
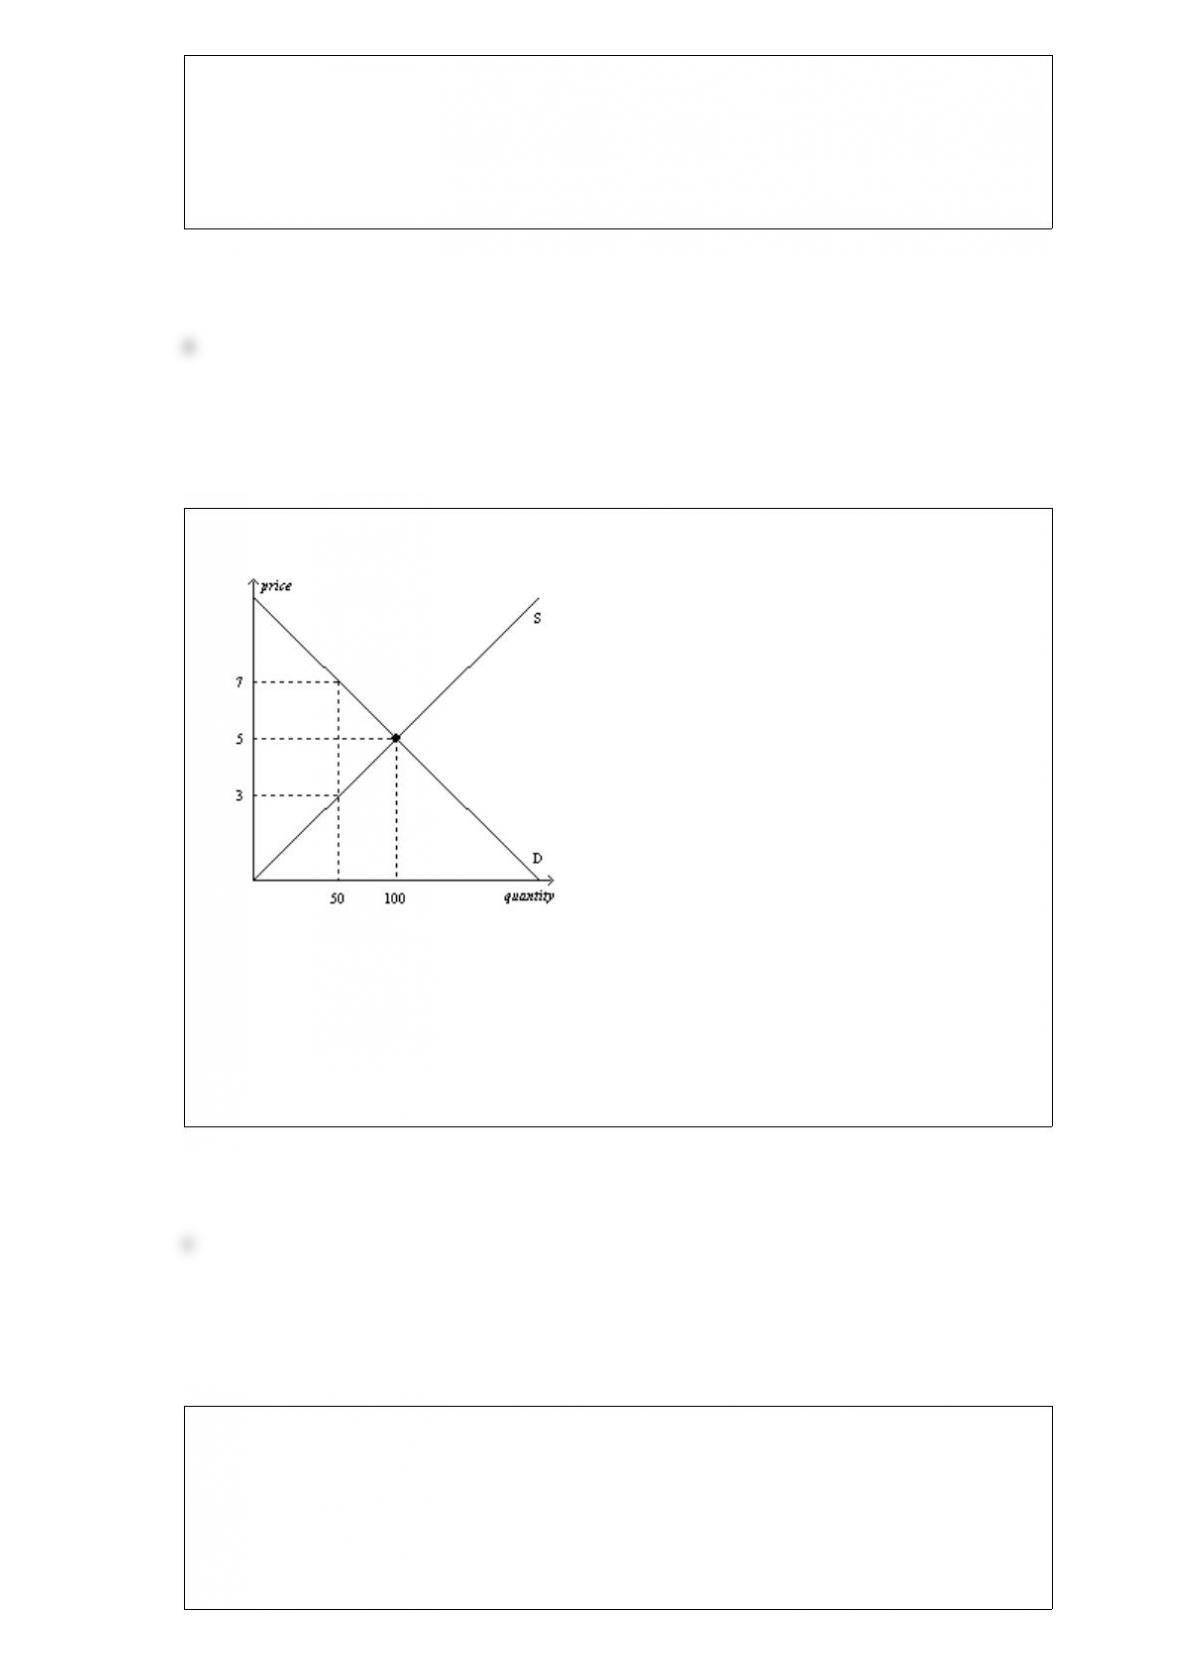
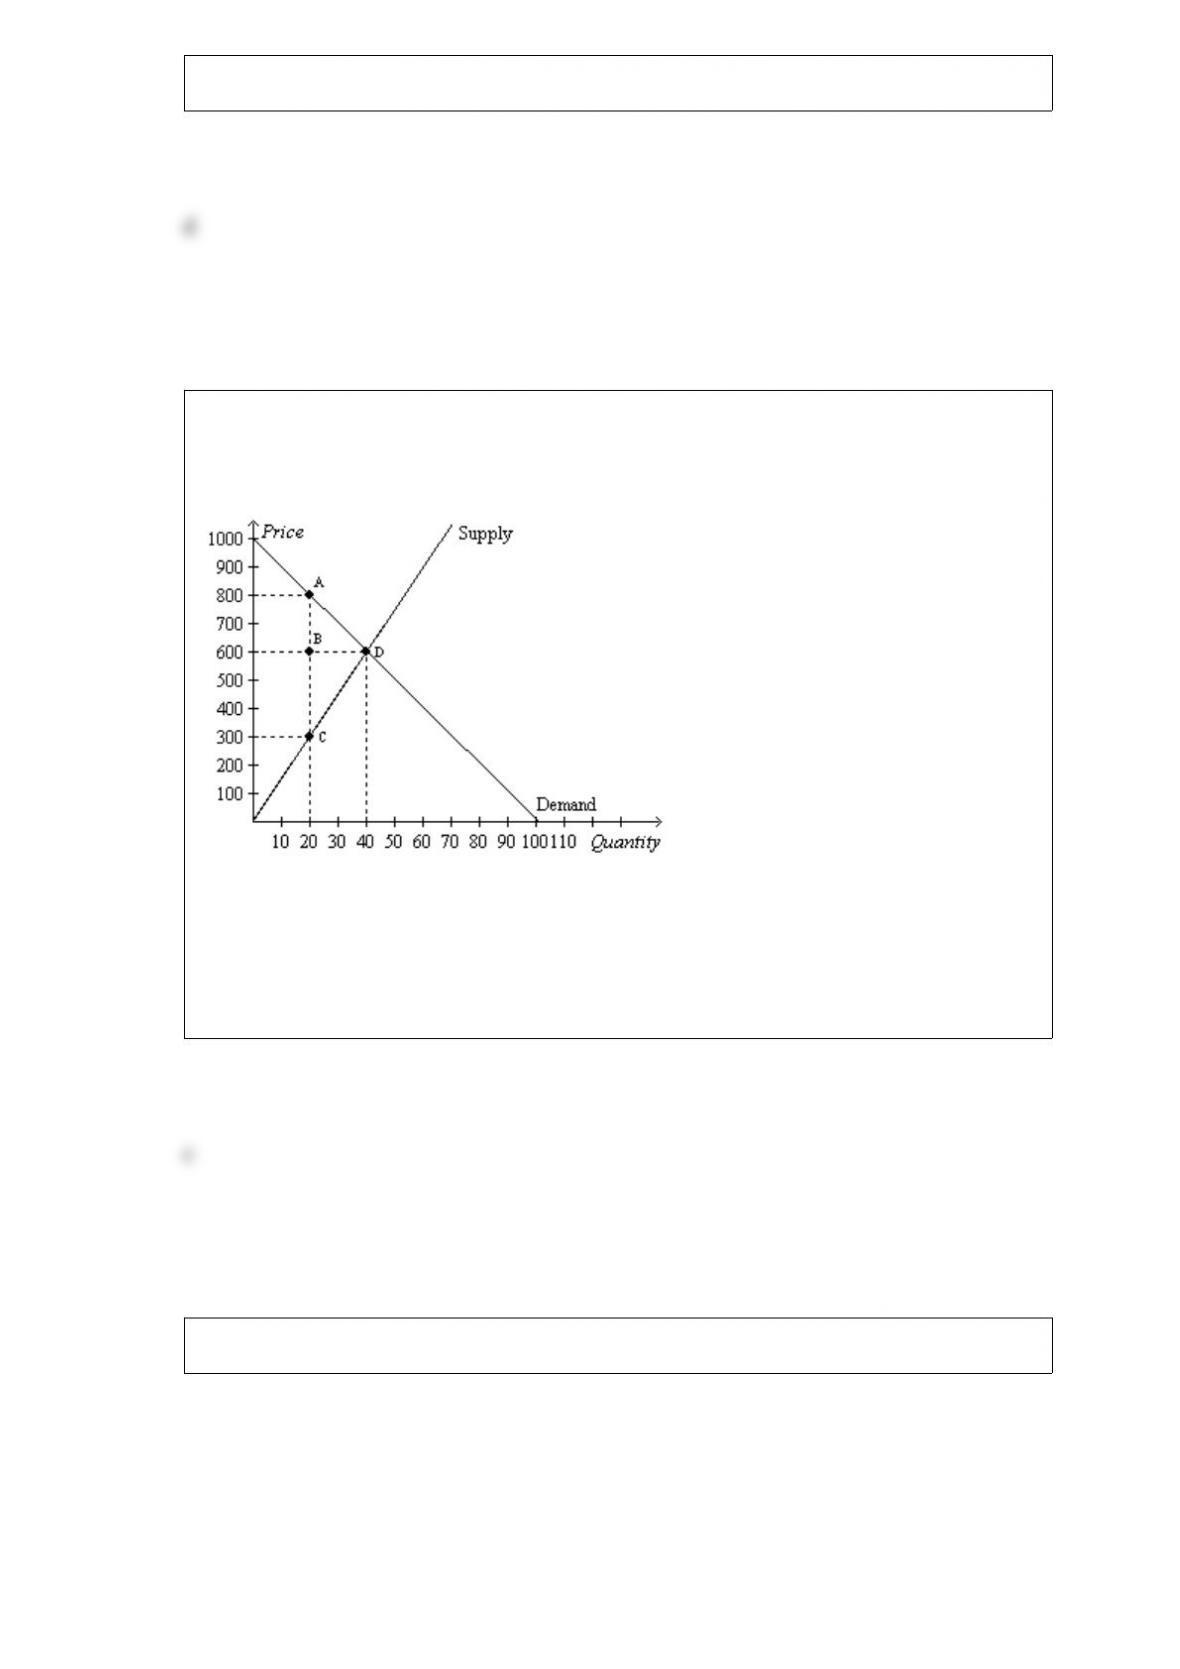
Figure 619
Refer to Figure 619. Suppose a tax of $2 per unit is imposed on this market. What will
be the new equilibrium quantity in this market?
a. less than 50 units
b. 50 units
c. between 50 units and 100 units
d. greater than 100 units
The study of how society manages its scarce resources is most closely associated with
which field of study?
a. environmental studies
b. economics
c. management
d. accounting
To display information on two variables, an economist must use
a. a bar graph.
b. a pie chart.
c. the coordinate system.
d. a timeseries graph.
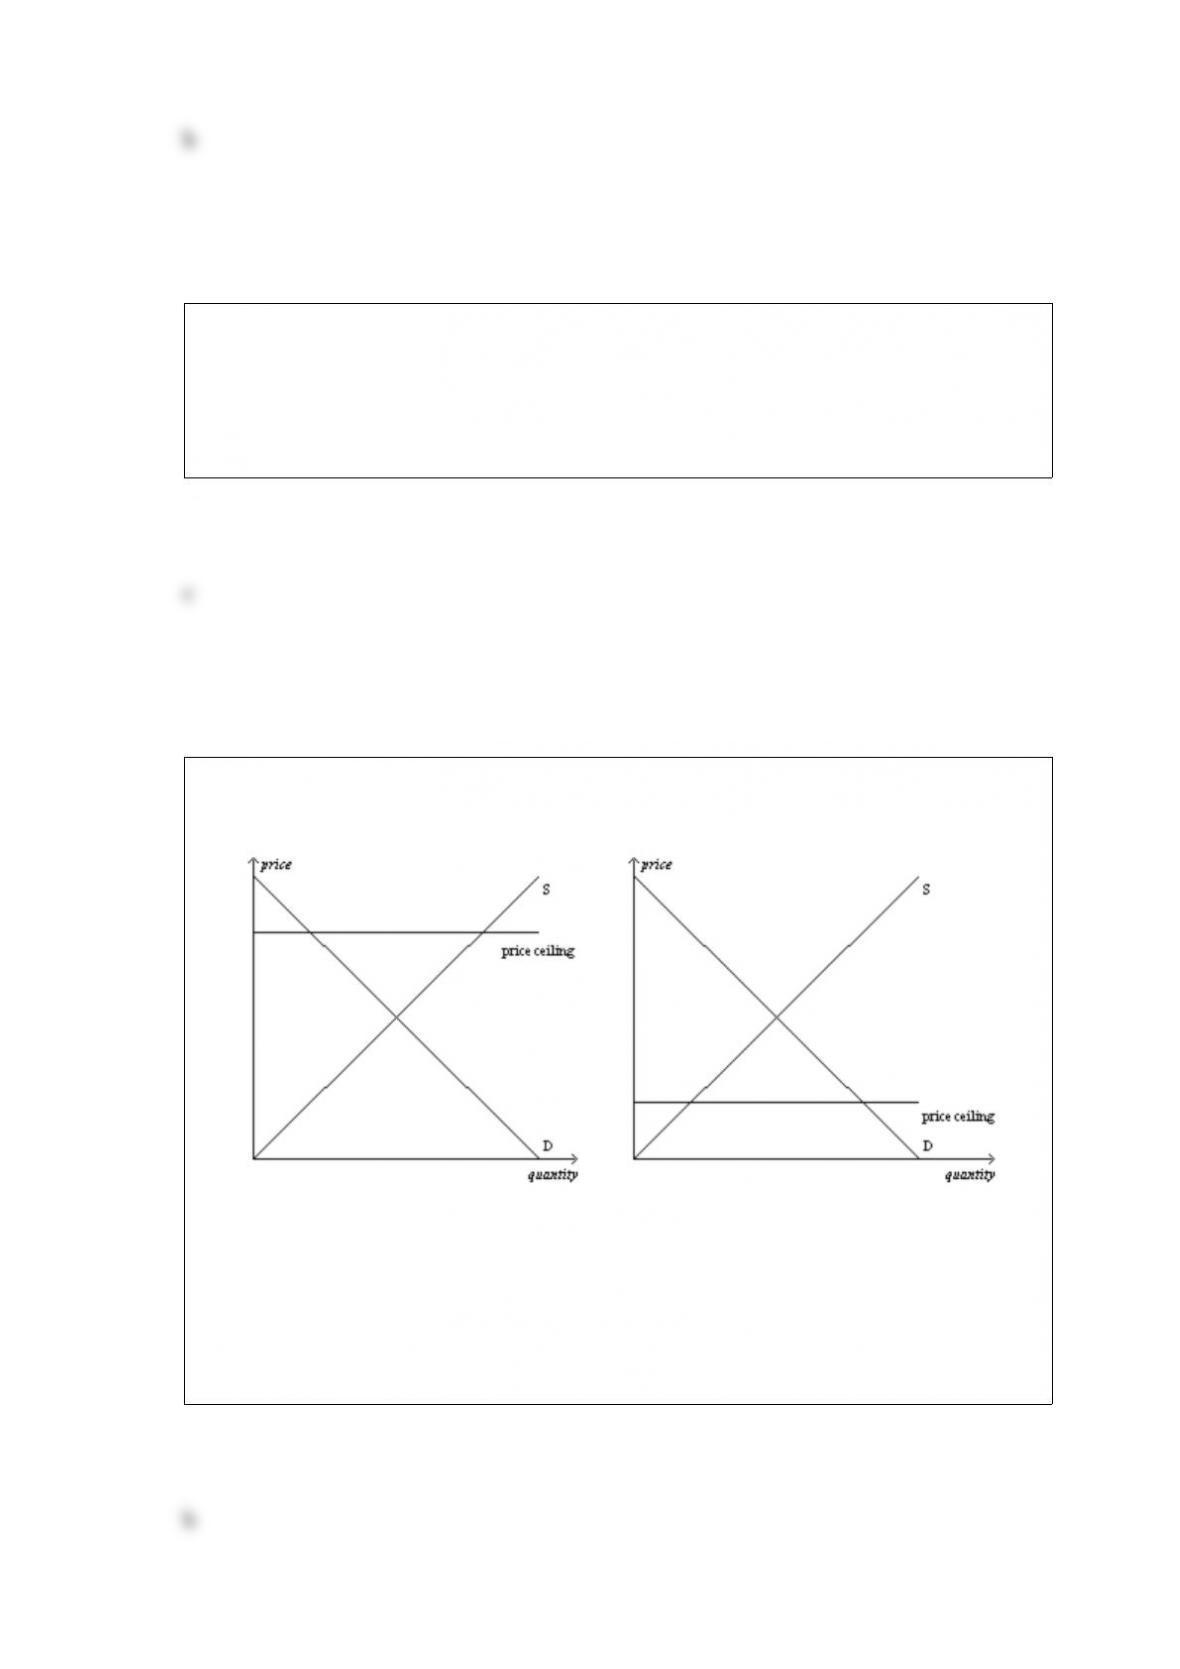
Figure 61
Panel (a)Panel (b)
Refer to Figure 61. In which panel(s) of the figure would there be a shortage of the
good at the price ceiling?
a. panel (a) only
b. panel (b) only
c. both panel (a) and panel (b)
d. neither panel (a) nor panel (b)
You lose your job and, as a result, you buy more frozen pizzas. For you, frozen pizza
are a(n)
a. luxury good.
b. inferior good.
c. normal good.
d. complementary good.
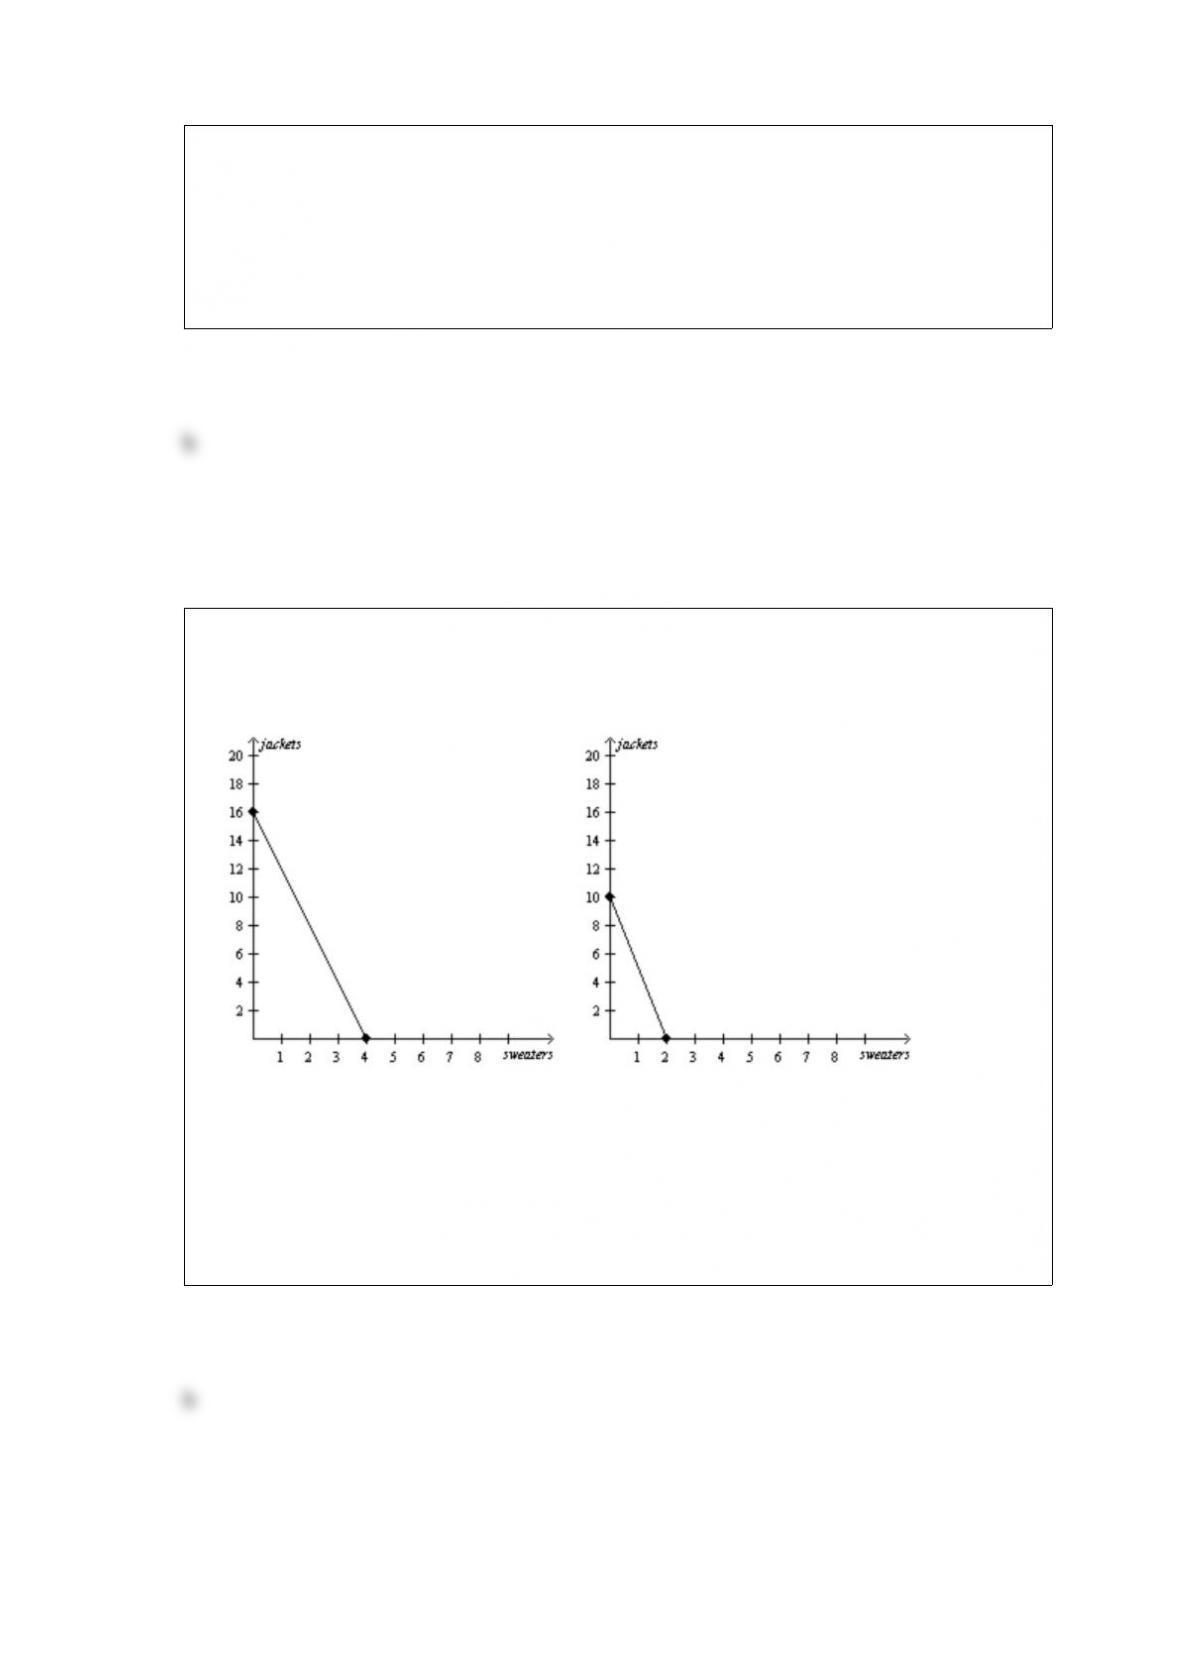
Figure 34
Lisa’s Production Possibilities FrontierBryce’s Production Possibilities Frontier
Refer to Figure 34. If Bryce must work 4 months to produce each sweater, then his
production possibilities frontier is based on how many months of work?
a. 4 months
b. 8 months
c. 12 months
d. 16 months
The price elasticity of demand for bread
a. is computed as the percentage change in quantity demanded of bread divided by the
percentage change in price of bread.
b. depends, in part, on the availability of close substitutes for bread.
c. reflects the many economic, social, and psychological forces that influence
consumers’ tastes for bread.
d. All of the above are correct.
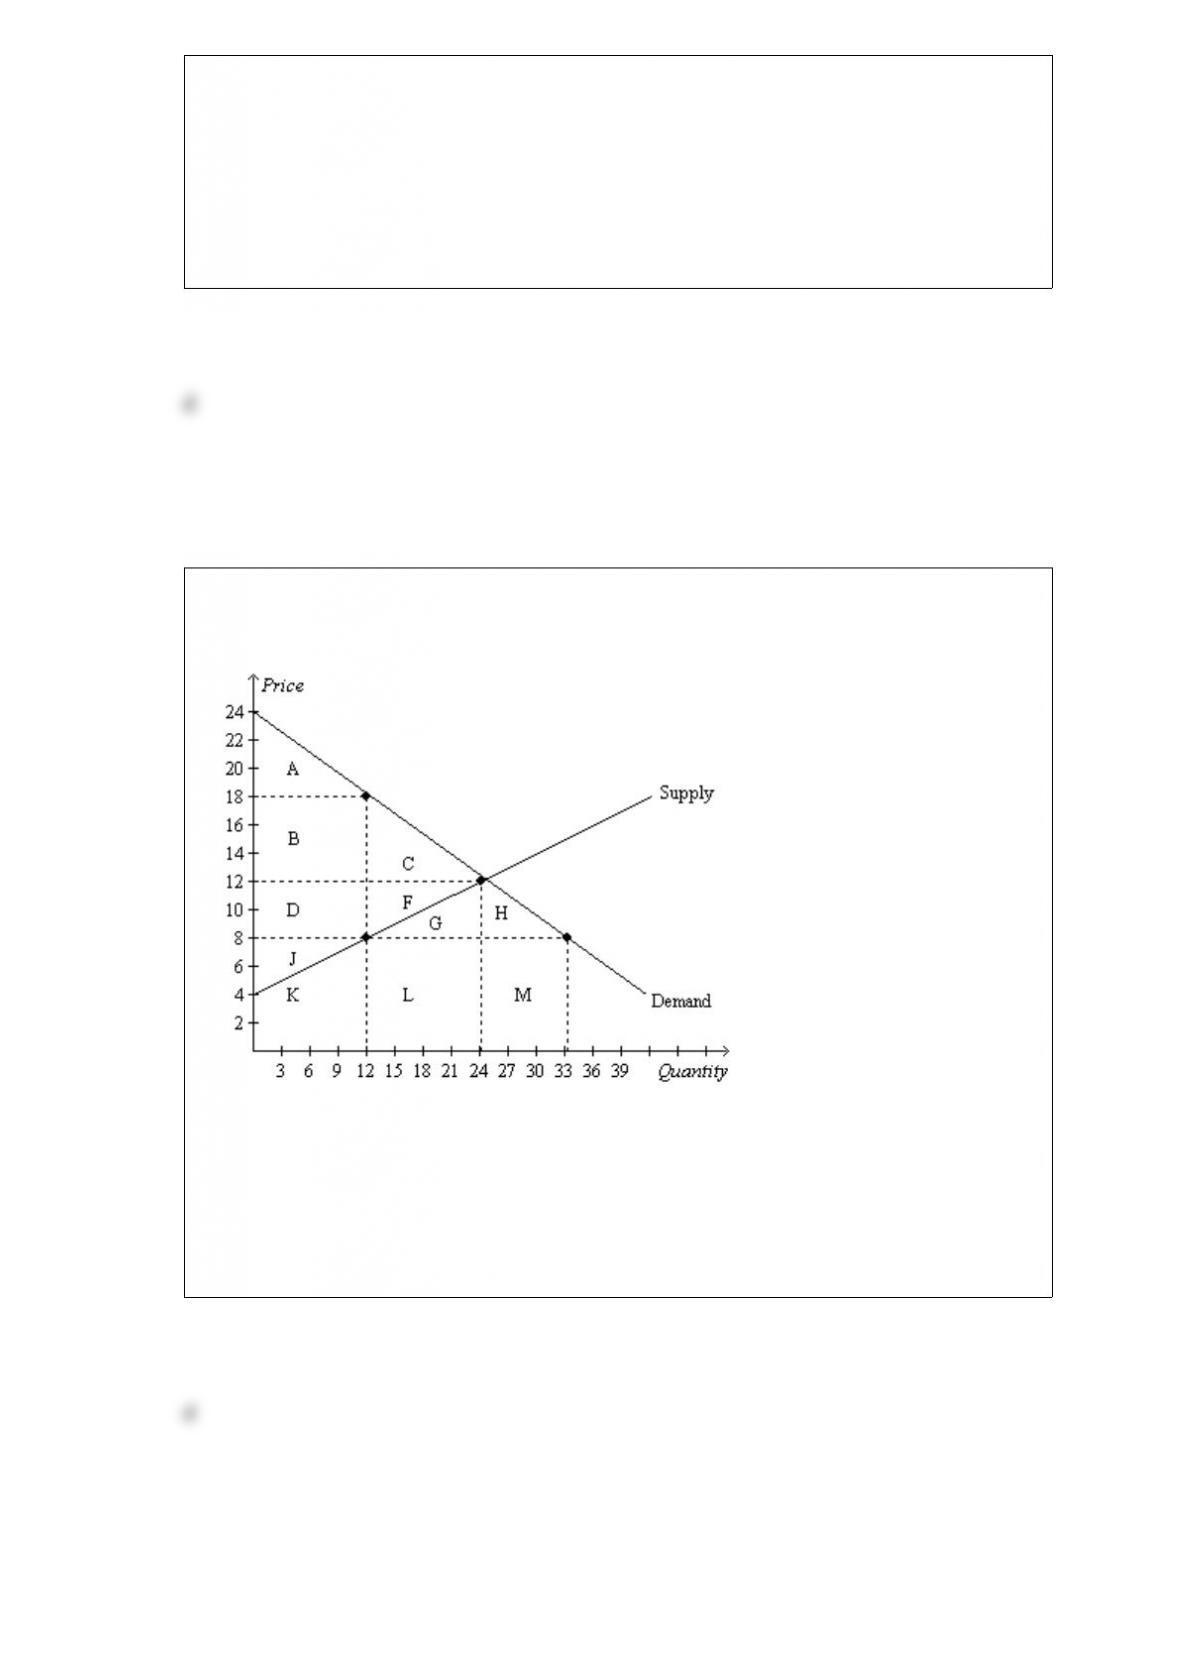
Figure 88
Suppose the government imposes a $10 per unit tax on a good.
Refer to Figure 88. The decrease in consumer and producer surpluses that is not offset
by tax revenue is the area
a. C.
b. F.
c. G.
d. C+F.
An increase in the price of blueberries would lead to a(n)
a. increased supply of blueberries.
b. a movement up and to the right along the supply curve for blueberries.
c. a movement down and to the left along the supply curve for blueberries.
d. Both a and b are correct.
A city wants to raise revenues to build a new municipal swimming pool next year. The
mayor suggests that the city raise the price of admission to the current municipal pools
this year to raise revenues. The city manager suggests that the city lower the price of
admission to raise revenues. Who is correct?
a. the mayor
b. the city manager
c. The answer depends on the price elasticity of demand.
d. The answer depends on the costs of construction of the new municipal swimming
pool.
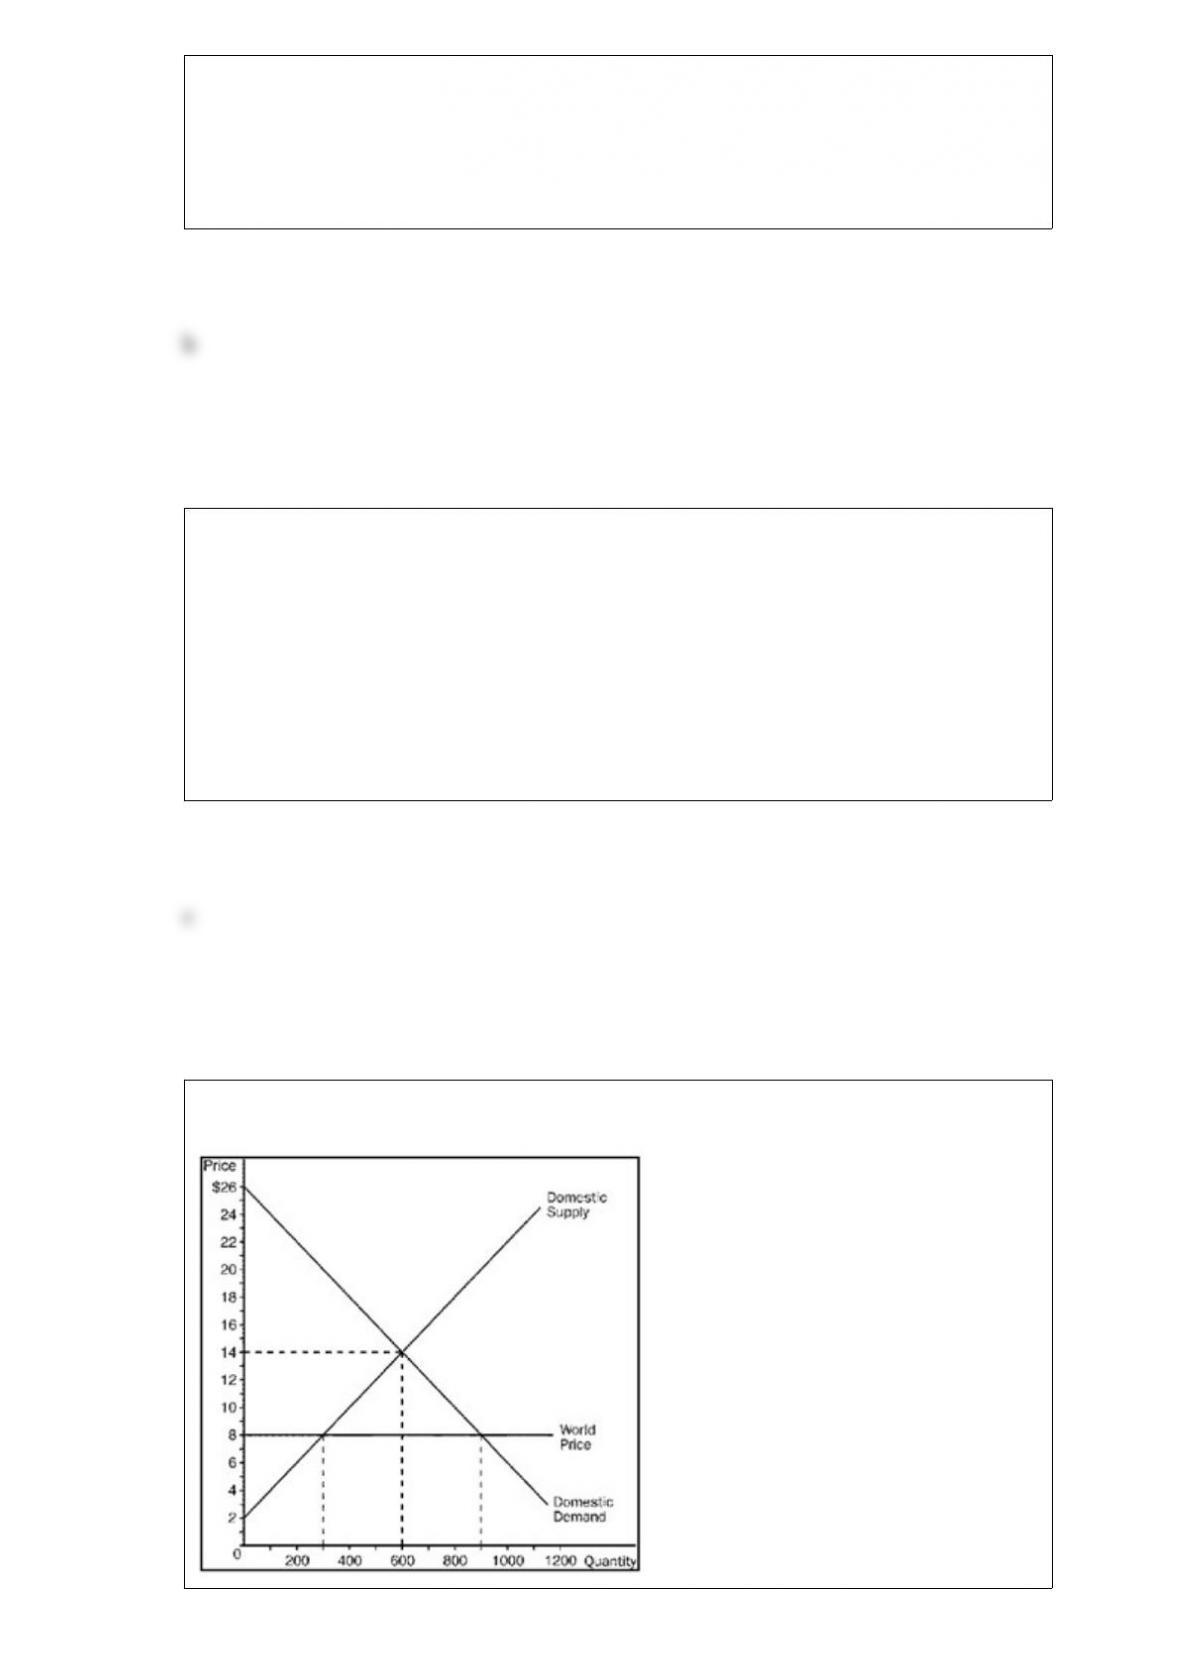
Figure 913
Refer to Figure 913. Consumer surplus before trade is
a. $1,600.
b. $2,400.
c. $3,200.
d. $3,600.
When the price of an eBook is $15.00, the quantity demanded is 400 eBooks per day.
When the price falls to $10.00, the quantity demanded increases to 700. Given this
information and using the midpoint method, we know that the demand for eBooks is
a. inelastic.
b. elastic.
c. unit elastic.
d. perfectly inelastic.
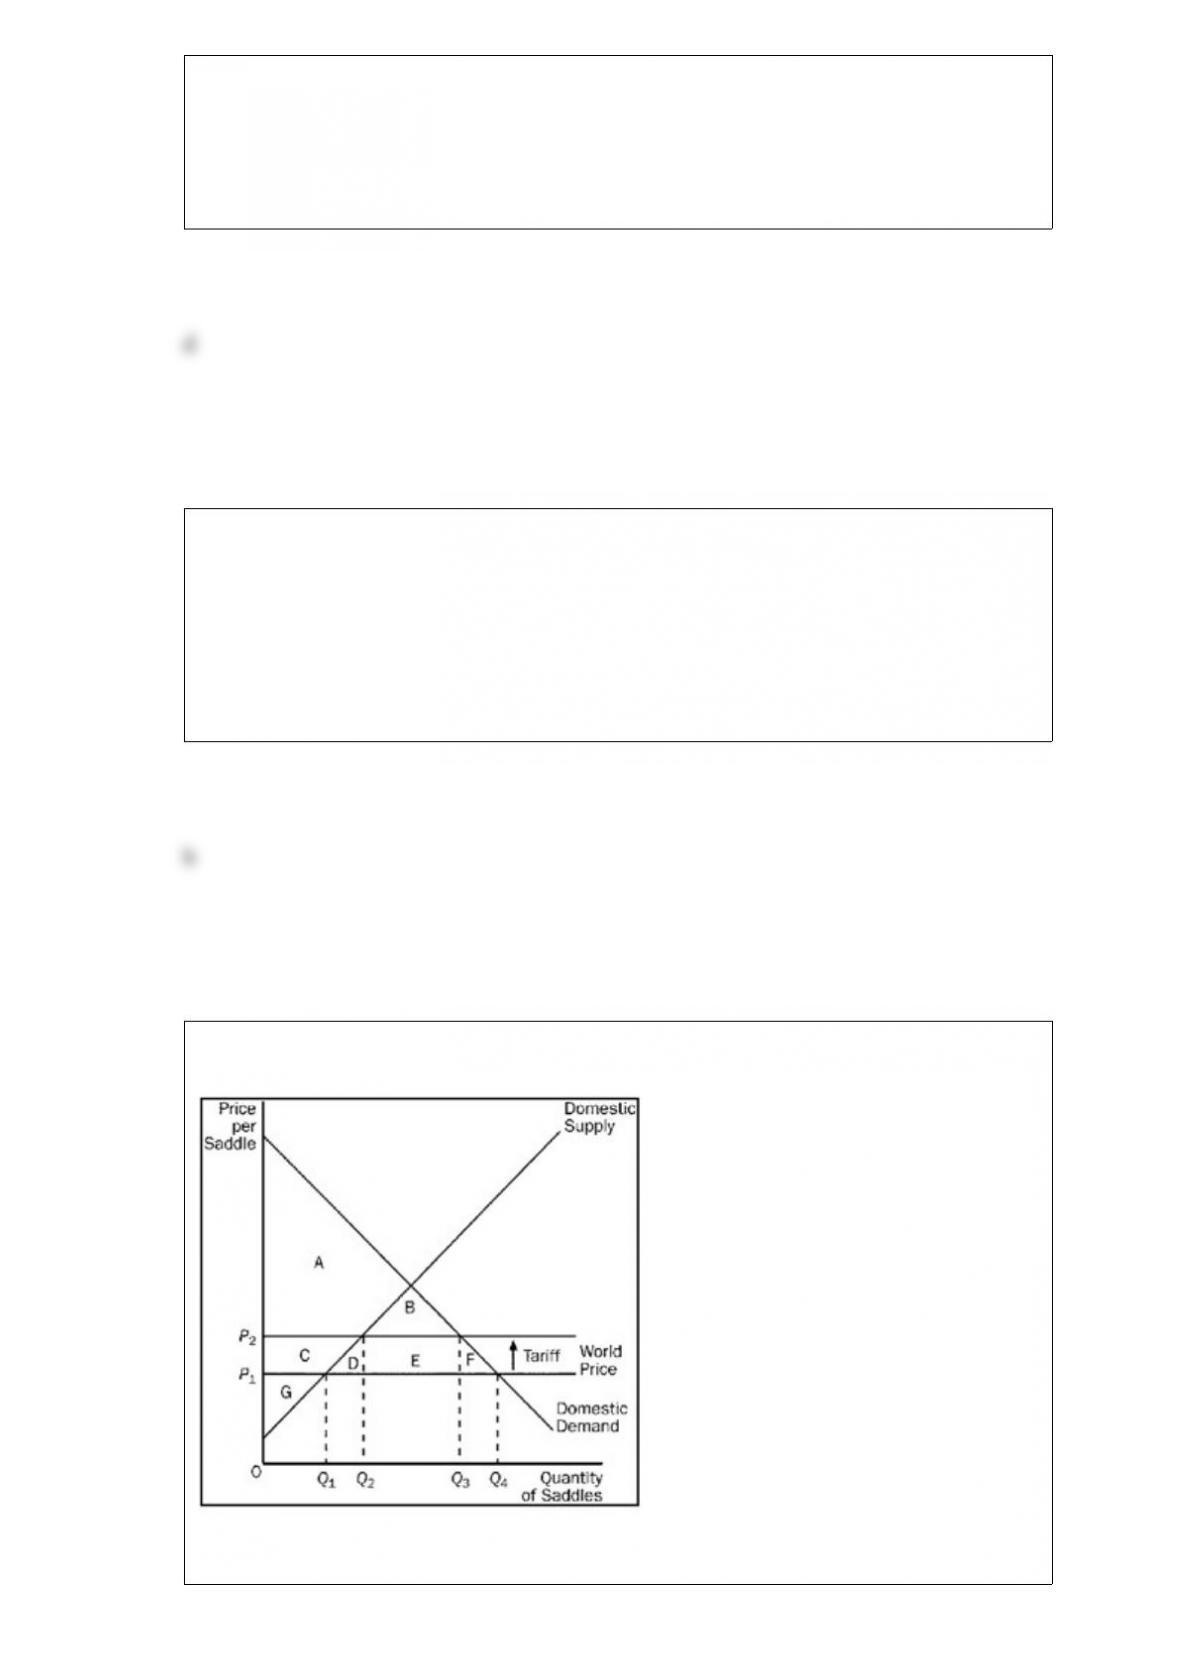
Figure 915
Refer to Figure 915. For the saddle market, area B represents
a. government’s revenue from the tariff.
b. the deadweight loss of the tariff.
c. the increase in producer surplus, relative to the freetrade situation, as a result of the
tariff.
d. None of the above is correct.
If the price of gasoline rises, when is the price elasticity of demand likely to be the
highest?
a. immediately after the price increases
b. one month after the price increase
c. three months after the price increase
d. one year after the price increase
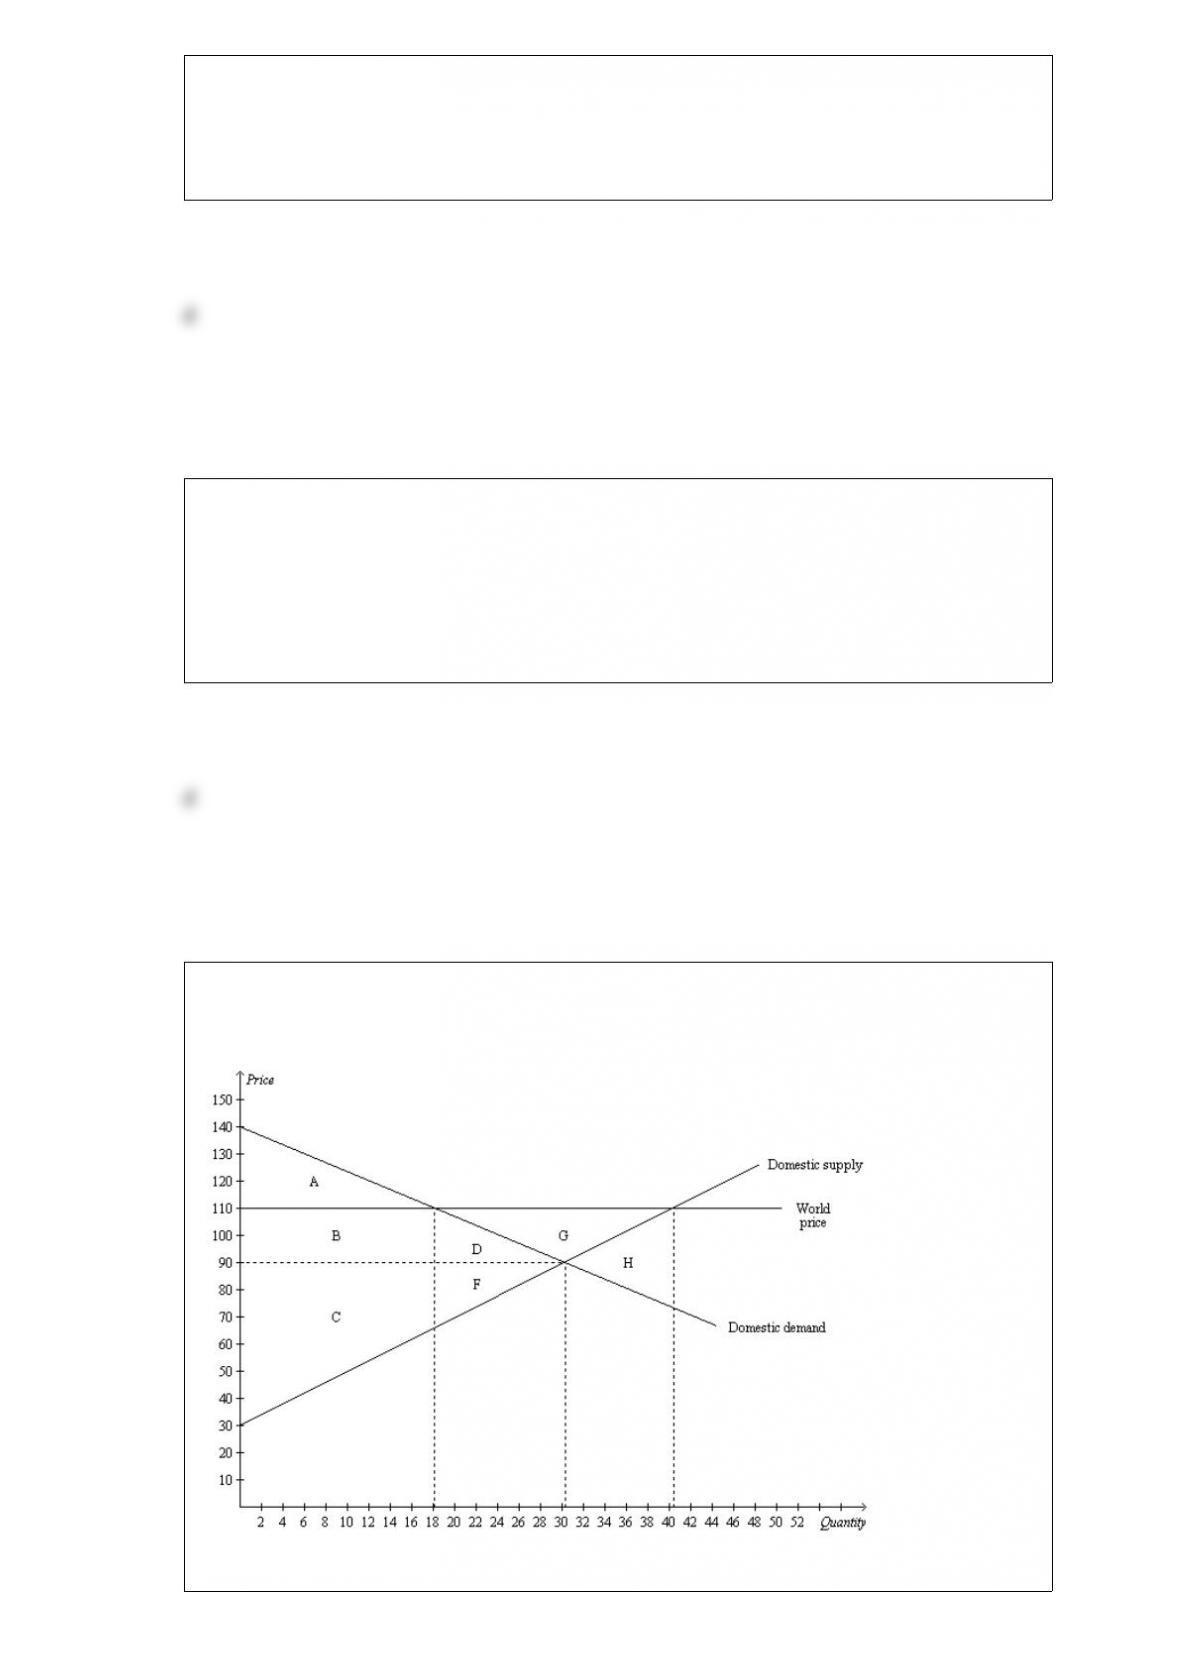
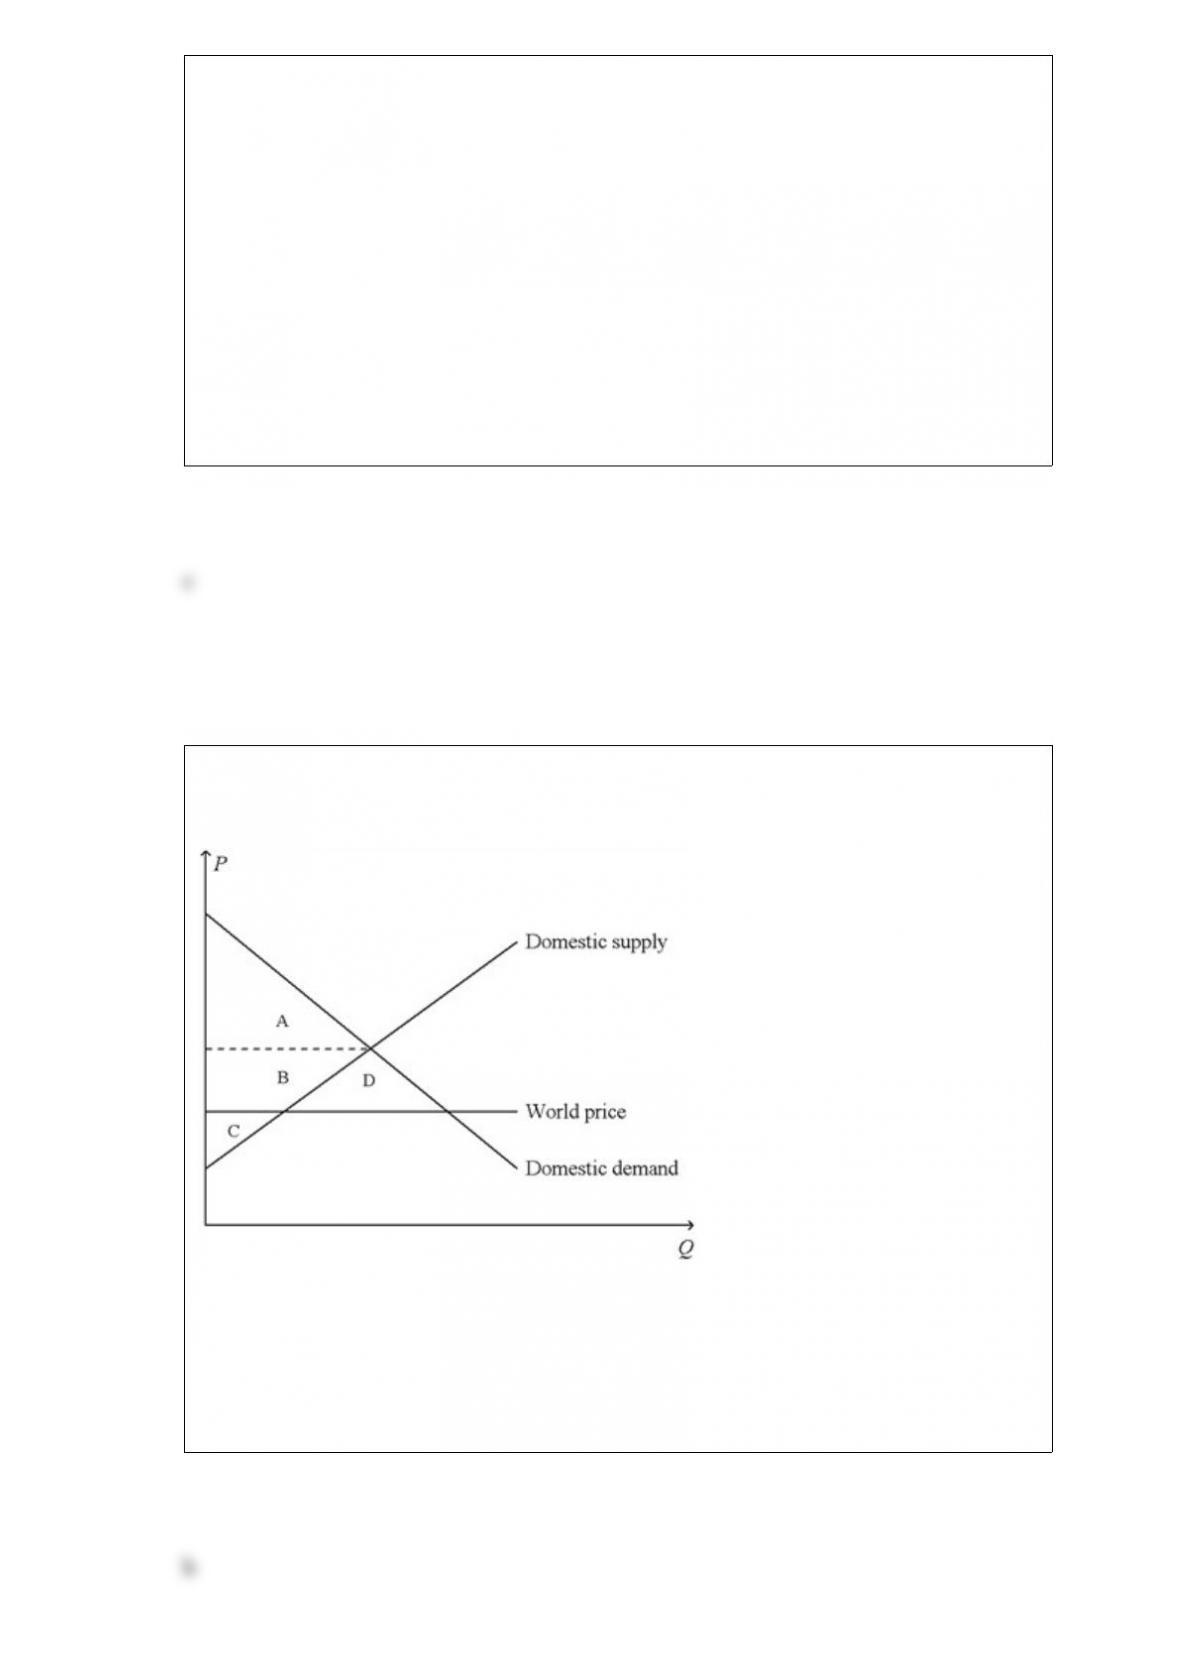
Figure 91
The figure illustrates the market for coffee in Guatemala.
Refer to Figure 91. In the absence of trade, total surplus in Guatemala is represented

by the area
a. A + B + C.
b. A + B + C + D + F.
c. A + B + C + D + F + G.
d. A + B + C + D + F + G + H.
Table 325
Assume that Maya and Miguel can switch between producing mixers and producing
toasters at a constant rate.
Hours Needed to Make 1Amount Produced in 40 Hours
mixertoastermixerstoasters
Maya8558
Miguel201024
Refer to Table 325. Maya has an absolute advantage in the production of
a. both goods and a comparative advantage in the production of mixers.
b. both goods and a comparative advantage in the production of toasters.
c. neither good and a comparative advantage in the production of mixers.
d. neither good and a comparative advantage in the production of toasters.
Figure 48
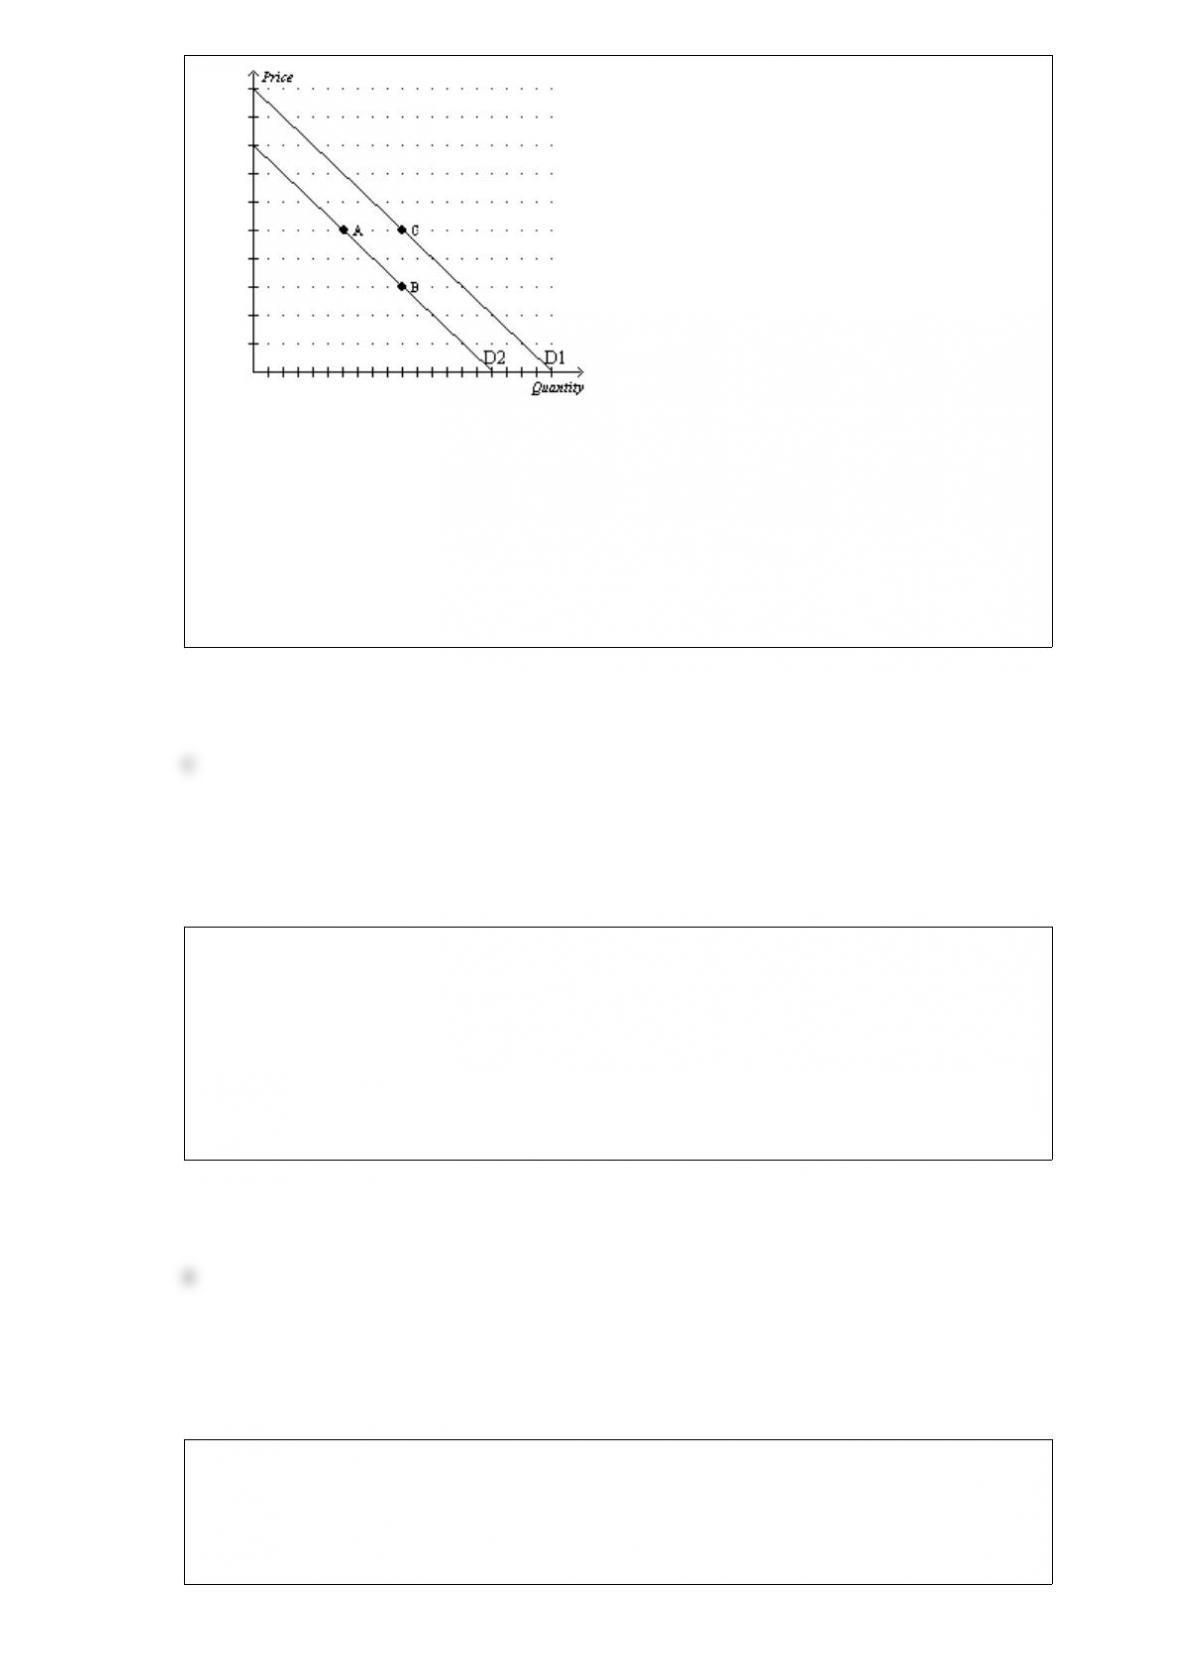
Refer to Figure 48. Suppose the figure shows the market demand for laptop computers.
Suppose the price of wireless keyboards, a complementary good, increases. Which of
the following changes would occur?
a. a movement along D2 from point A to point B
b. a movement along D2 from point B to point A
c. a shift from D1 to D2
d. a shift from D2 to D1
A binding minimum wage
a. alters both the quantity demanded and quantity supplied of labor.
b. affects only the quantity of labor demanded; it does not affect the quantity of labor
supplied.
c. has no effect on the quantity of labor demanded or the quantity of labor supplied.
d. causes only temporary unemployment because the market will adjust and eliminate
any temporary surplus of workers.
Which of the following is not an example of the opportunity cost of going to school?
a. The money a student could have earned by working if he had not gone to college.
b. The nap a student could have enjoyed if he had not attended class.
c. The party a student could have enjoyed if he had not stayed in to study for his exam.
d. The money a student spends on rent for his apartment while attending school.
Figure 89
The vertical distance between points A and C represents a tax in the market.
Refer to Figure 89. The amount of tax revenue received by the government is
a. $4,000.
b. $6,000.
c. $10,000.
d. $24,000.
Figure 721
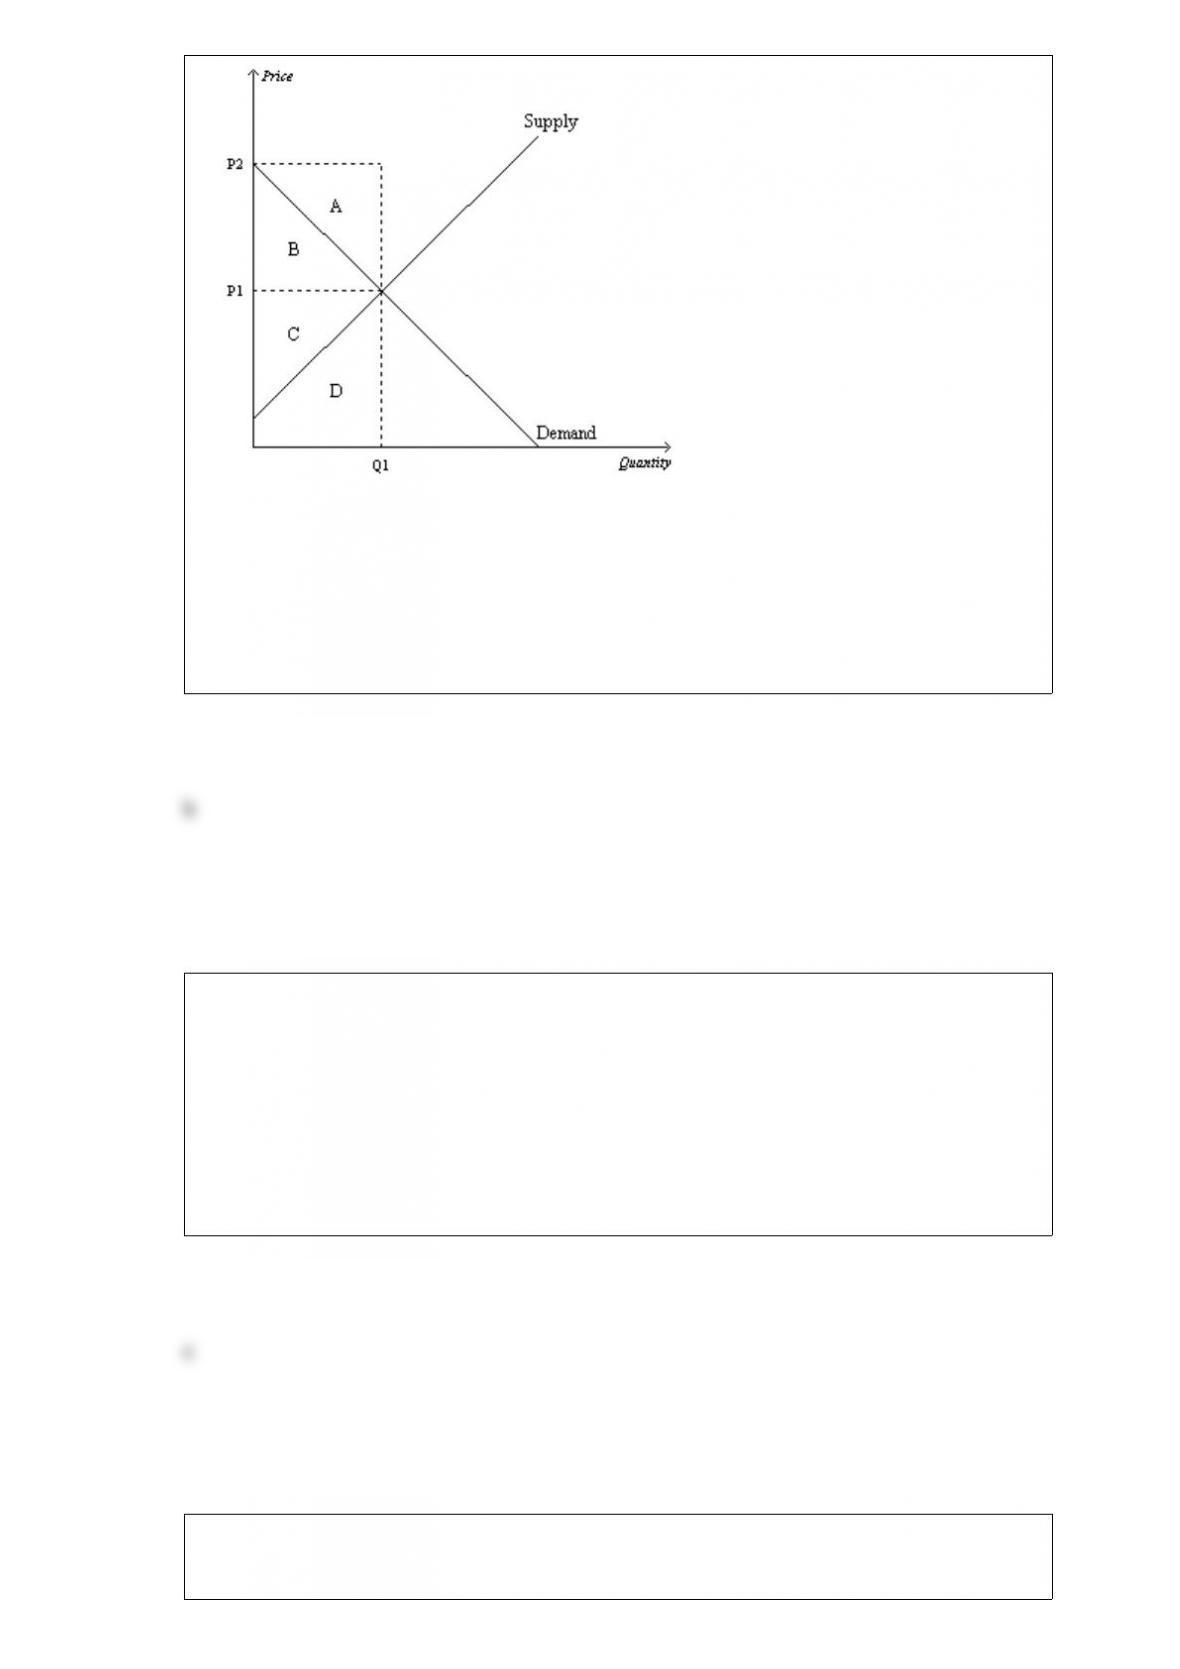
Refer to Figure 721. Which area represents total surplus in the market when the price
is P1?
a. A+B
b. B+C
c. C+D
d. A+B+C+D
Studies indicate that the price elasticity of demand for beer is about 0.9. A government
policy aimed at reducing beer consumption changed the price of a case of beer from
$10 to $20. According to the midpoint method, the government policy should have
reduced beer consumption by
a. 30%.
b. 40%.
c. 60%.
d. 74%.
Table 324
Assume that England and Spain can switch between producing cheese and producing
bread at a constant rate.
Labor Hours Needed to Make 1 Unit ofNumber of Units Produced in 40 Hours
CheeseBreadCheeseBread
England 144010
Spain 48105
Refer to Table 324. England has an absolute advantage in the production of
a. cheese and Spain has an absolute advantage in the production of bread.
b. bread and Spain has an absolute advantage in the production of cheese.
c. both goods and Spain has an absolute advantage in the production of neither good.
d. neither good and Spain has an absolute advantage in the production of both goods.
Figure 98. On the diagram below, Q represents the quantity of cars and P represents the
price of cars.
Refer to Figure 98. The price corresponding to the horizontal dotted line on the graph
represents the price of cars
a. after trade is allowed.
b. before trade is allowed.
c. that maximizes total surplus when trade is allowed.
d. that minimizes the wellbeing of domestic car producers when trade is allowed.
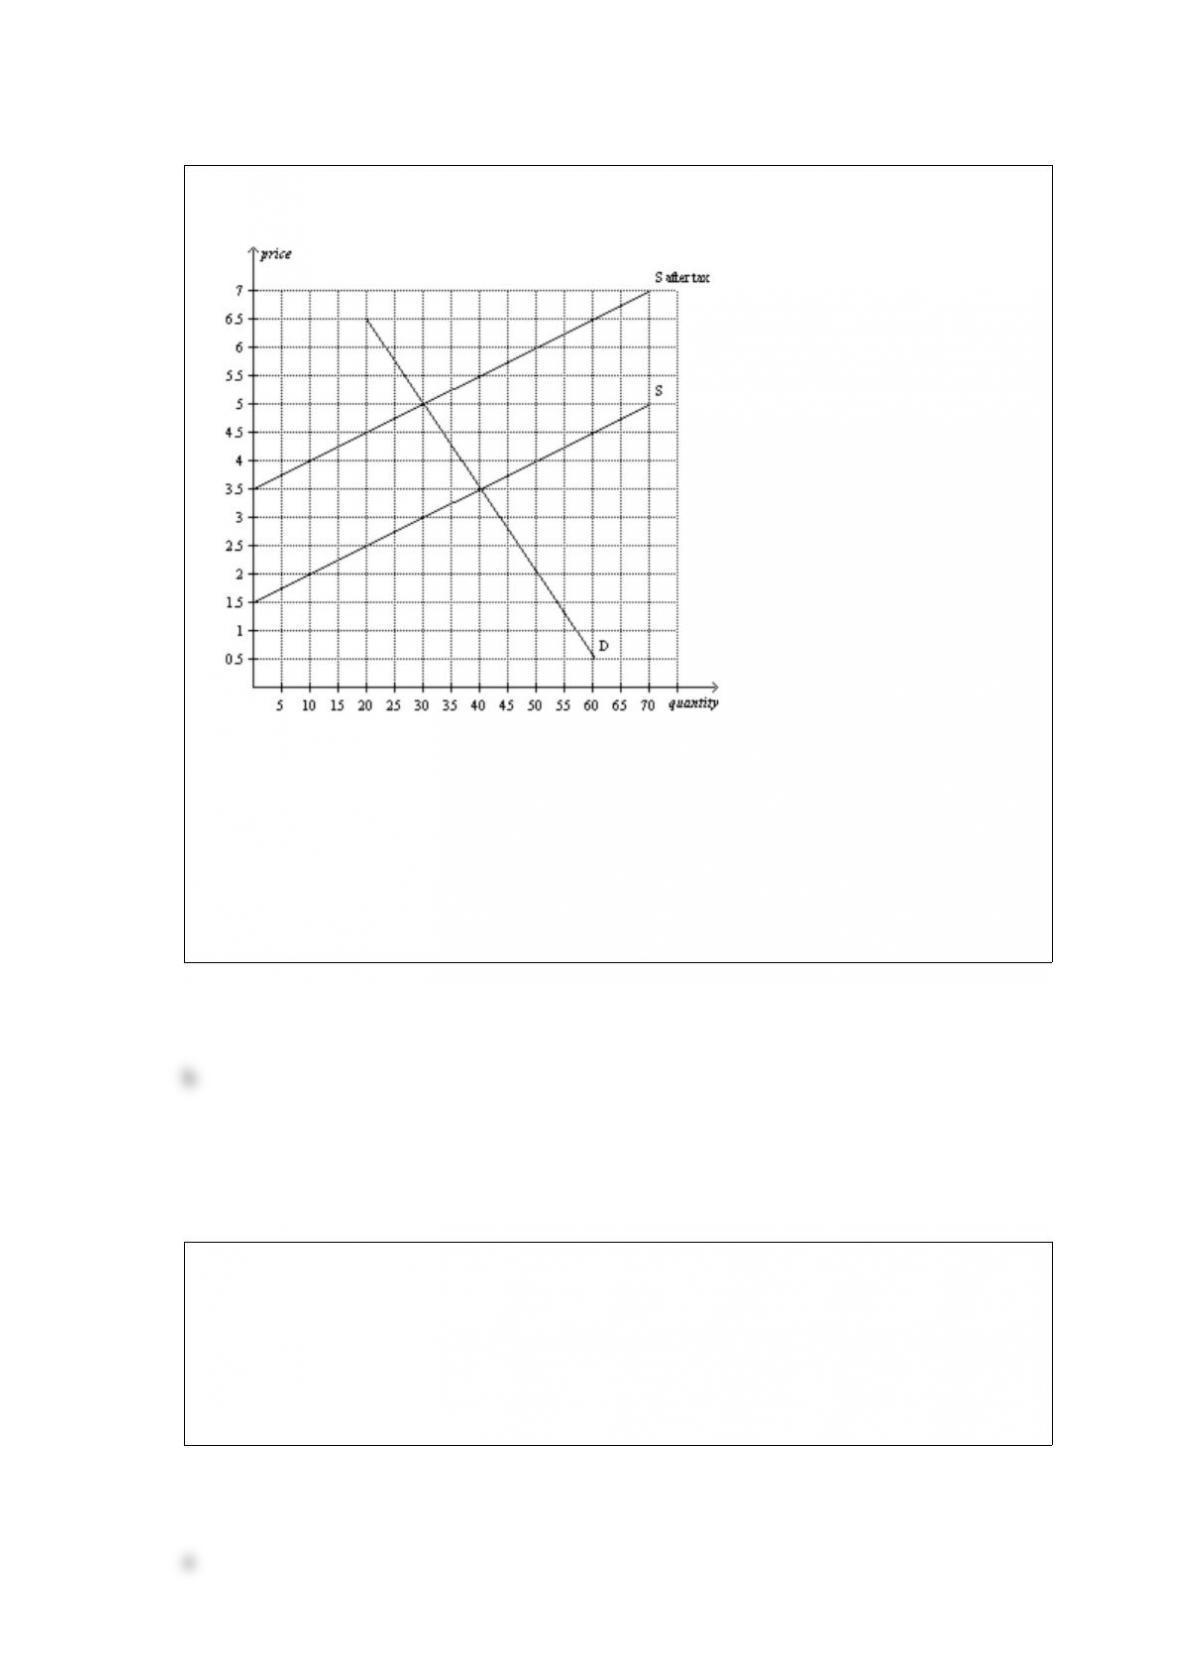
Figure 622
Refer to Figure 622. As the figure is drawn, who sends the tax payment to the
government?
a. The buyers send the tax payment.
b. The sellers send the tax payment.
c. A portion of the tax payment is sent by the buyers, and the remaining portion is sent
by the sellers.
d. The question of who sends the tax payment cannot be determined from the graph.
Which of the following scenarios is consistent with the Laffer curve?
a. The tax rate is 1 percent, and tax revenue is very low.
b. The tax rate is 1 percent, and tax revenue is very high.
c. The tax rate is 99 percent, and tax revenue is very high.
d. The tax rate is moderate (between very high and very low), and tax revenue is very
low.

In communism, central planners decide which of the following?
a. what goods and services will be produced
b. how much will be produced
c. who will produce and consume the goods and services
d. All of the above are correct.
When a tax is levied on a good,
a. government collects revenues which might justify the loss in total welfare.
b. there is a decrease in the quantity of the good bought and sold in the market.
c. a wedge is placed between the price buyers pay and the price sellers effectively
receive.
d. All of the above are correct.
The supply curve for motor oil is the typical upwardsloping straight line, and the
demand curve for motor oil is the typical downwardsloping straight line. When motor
oil is taxed, the area on the relevant supplyanddemand graph that represents the
deadweight loss is
a. larger than the area that represents consumer surplus in the absence of the tax.
b. larger than the area that represents government’s tax revenue.
c. a triangle.
d. All of the above are correct.